HTTP 200 OK
Allow: GET, HEAD, OPTIONS
Content-Type: application/json
Vary: Accept
[
{
"id": 319,
"slug": "178-1734634003-pharmacological-insights-and-therapeutic-advances-of-mangiferin-against-various-pathological-conditions-in-liver-diseases",
"type": "review_article",
"manuscript_id": "178-1734634003",
"published": "2025-01-20",
"journal_reference": "J Adv Biotechnol Exp Ther. 2025; 8(1): 125-138",
"academic_editor": "Md. Abdul Hannan, PhD; Bangladesh Agricultural University, Bangladesh",
"cite_info": "Shoyshob TZ, Akter S, et al. Pharmacological insights and therapeutic advances of mangiferin against various pathological conditions in liver diseases. J Adv Biotechnol Exp Ther. 2025; 8(1): 125-138.",
"title": "Pharmacological insights and therapeutic advances of mangiferin against various pathological conditions in liver diseases",
"DOI": "10.5455/jabet.2025.11",
"figures": [
{
"figure": "https://jabet.bsmiab.org/media/article_images/2025/58/21/178-1734634003-Figure1.jpg",
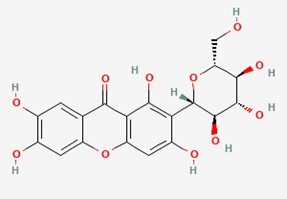
"caption": "Figure 1. Chemical structure of mangiferin (C19H18O11) [19].",
"featured": false
},
{
"figure": "https://jabet.bsmiab.org/media/article_images/2025/58/21/178-1734634003-Figure2.jpg",
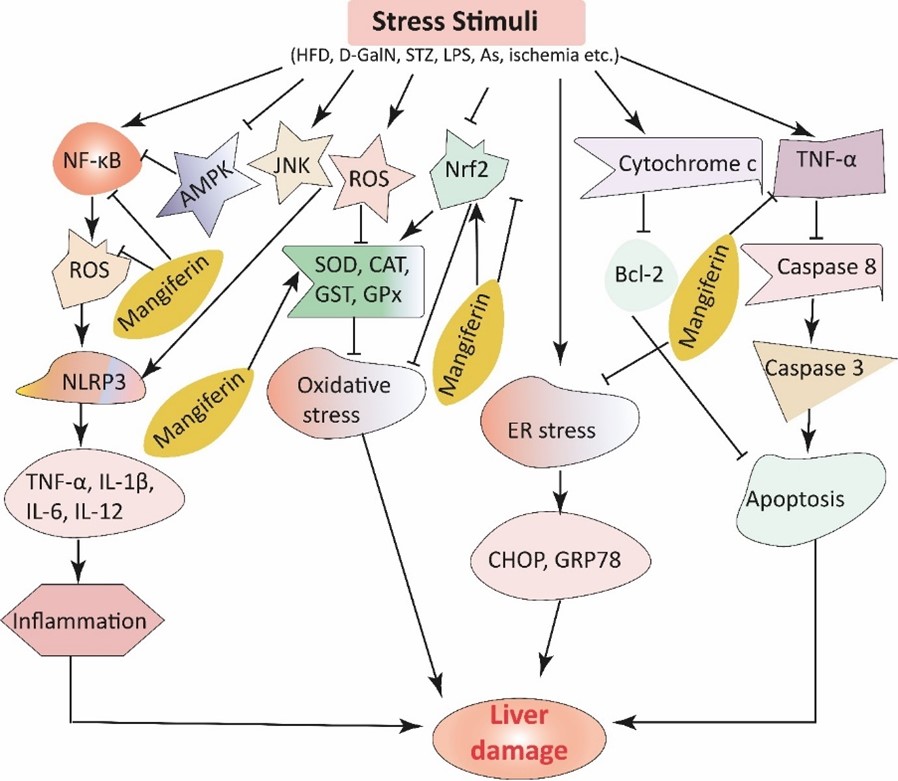
"caption": "Figure 2. Summary of the protective mechanisms of mangiferin against liver disease. Stress stimuli such as HFD, D-GalN, STZ, LPS, As, and ischemia trigger the generation of ROS, which reduce the levels of several antioxidant enzymes (SOD, CAT, GST, GPx) and hence cause oxidative stress, ultimately resulting in liver diseases. Mangiferin intercepts oxidative stress by increasing the level of antioxidant enzymes. In addition, these stimuli also trigger inflammatory cascades via the activation of the NF-қB pathway. Nevertheless, mangiferin blocks inflammatory cascades via the suppression of ROS and the NF-қB pathway. The production of cytochrome C decreases the expression of Bcl-2, thus decreasing apoptosis. Mangiferin also inhibits ER stress by suppressing CHOP and GRP78. Furthermore, after the activation of TNF-α, it helps to activate caspase compounds, resulting in apoptosis, and mangiferin inhibits this apoptosis in the liver.",
"featured": true
}
]
},
{
"id": 299,
"slug": "178-1714120555-tracing-mitochondrial-dysfunction-pathways-in-type-2-diabetes-the-promise-of-mitochondria-targeted-therapeutics",
"type": "review_article",
"manuscript_id": "178-1714120555",
"published": "2024-07-04",
"journal_reference": "J Adv Biotechnol Exp Ther. 2024; 7(3): 530-545",
"academic_editor": "Md Jamal Uddin, PhD; ABEx Bio-Research Center, Dhaka, Bangladesh",
"cite_info": "Amin T, Jerin N, et al. Tracing mitochondrial dysfunction pathways in type 2 diabetes: The promise of mitochondria-targeted therapeutics. J Adv Biotechnol Exp Ther. 2024; 7(3): 530-545.",
"title": "Tracing mitochondrial dysfunction pathways in type 2 diabetes: The promise of mitochondria-targeted therapeutics",
"DOI": "10.5455/jabet.2024.d46",
"figures": [
{
"figure": "https://jabet.bsmiab.org/media/article_images/2024/35/04/178-1714120555-figure1.jpg",
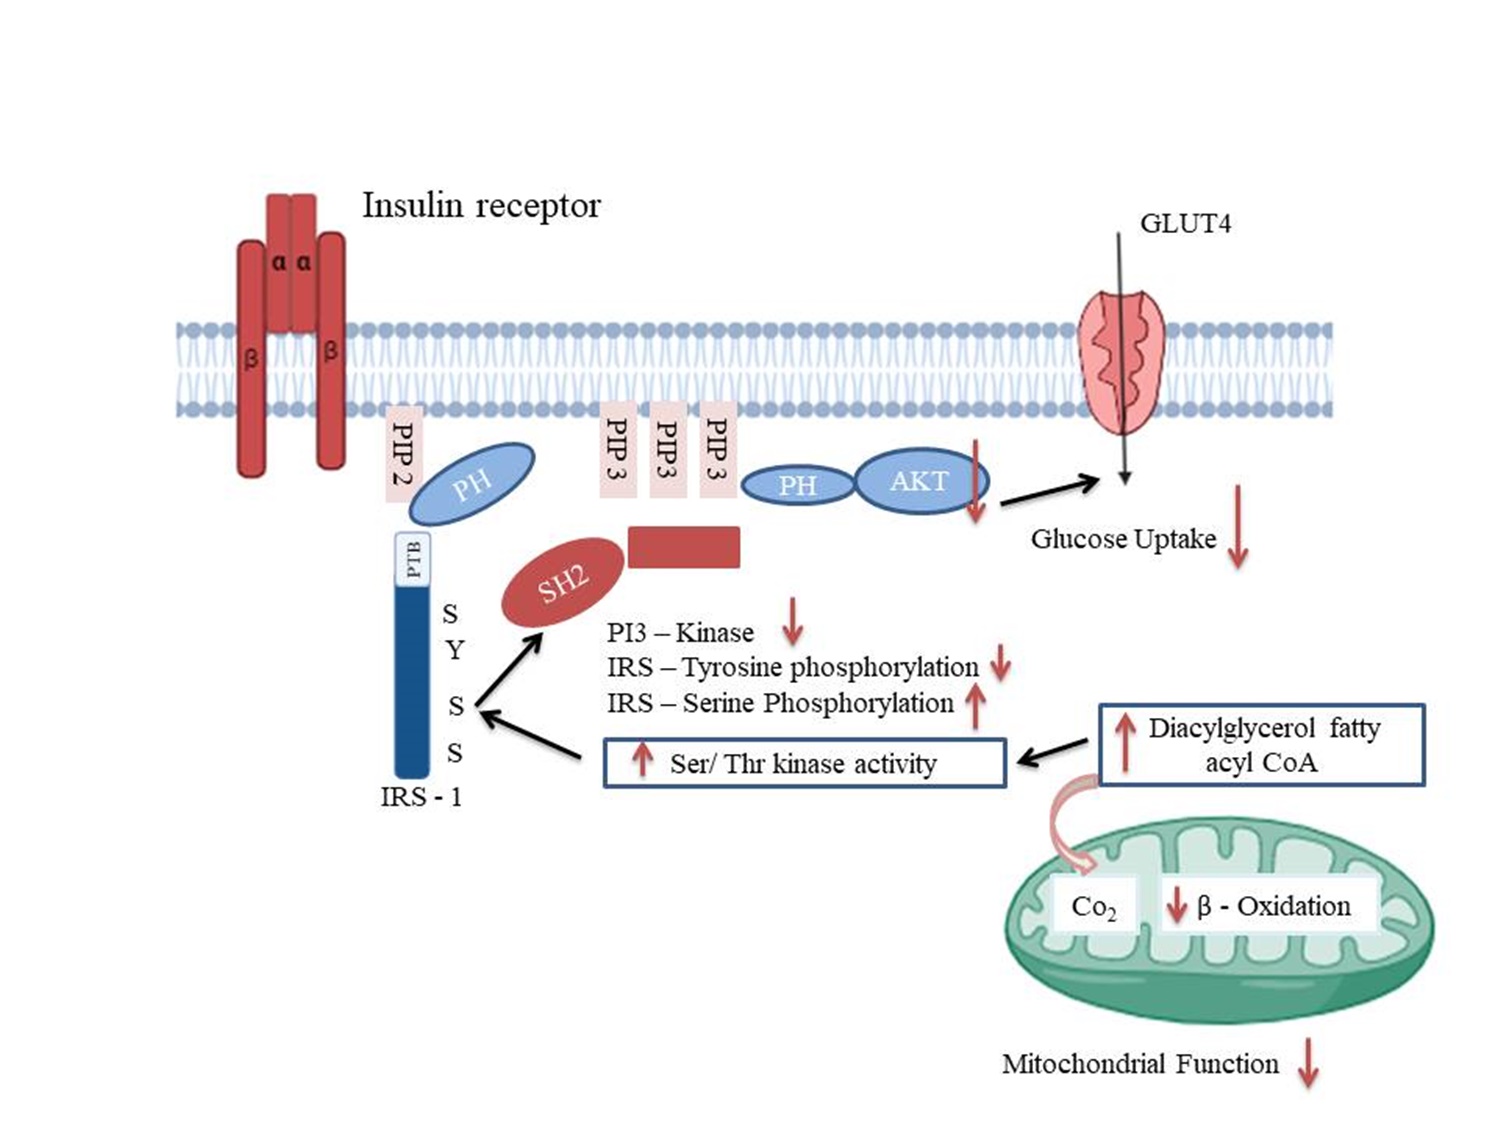
"caption": "Figure 1. Potential mechanism of how skeletal muscle develops insulin resistance resulting from mitochondrial dysfunction. According to the model, intracellular fatty acyl CoA and diacylglycerol levels rise when mitochondrial fatty acid oxidation is inhibited due to dysfunctional mitochondria or decreased mitochondrial composition. These compounds trigger the activation of new protein kinase C, which in turn triggers a cascade of serine kinases that increases the serine phosphorylation (pS) of insulin receptor substrate-1 (IRS-1). The activity of phosphatidyl inositol 3-kinase (PI 3-kinase) is inhibited by increased serine phosphorylation of IRS-1, which prevents IRS-1 tyrosine phosphorylation by the insulin receptor. The suppression of insulin-stimulated glucose transport is a consequence of such inhibition. PIP: phosphatidylinositol 3, 4, 5-trisphosphate; PTB: phosphotyrosine binding domain; PH: pleckstrin homology domain; SH2: SRC homology domain; GLUT 4: Glucose transporter type 4; IRS 1: insulin receptor substrate-1.",
"featured": false
},
{
"figure": "https://jabet.bsmiab.org/media/article_images/2024/35/04/178-1714120555-figure2.jpg",
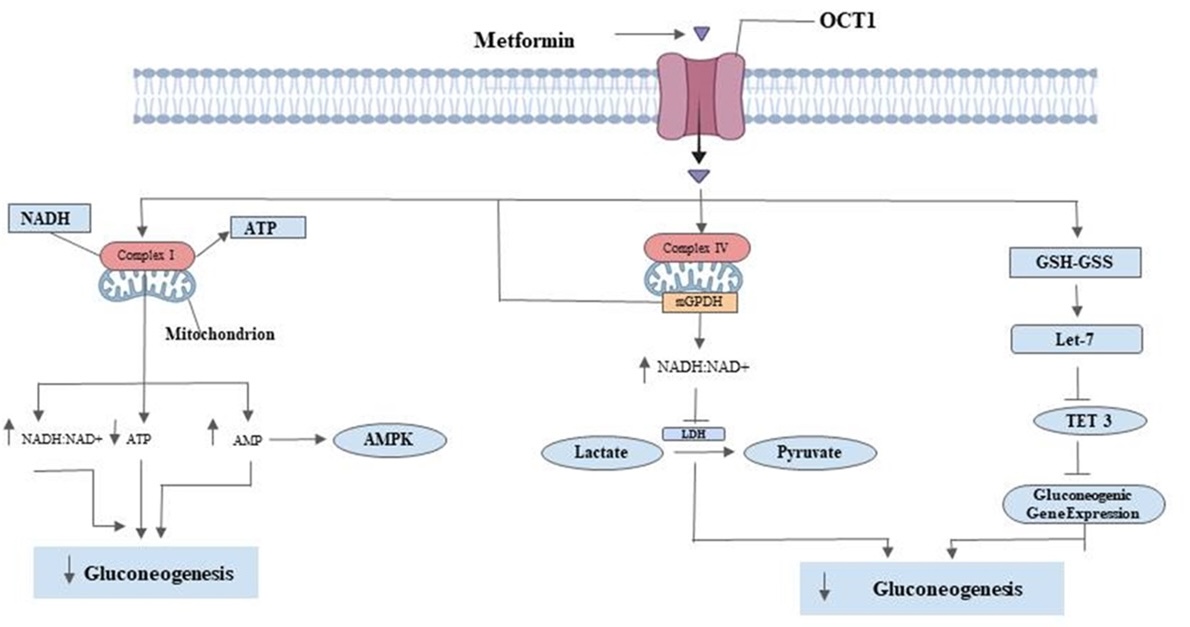
"caption": "Figure 2. Potential mechanism of mitochondria-targeted metabolic therapy through metformin-induced reduction of blood glucose level. Metformin inhibits mitochondrial respiratory chain complex I in the liver, causing a decrease in ATP synthesis and an increase in cellular levels of AMP. This decrease in hepatic gluconeogenic flux is ATP-dependent and inhibits enzymes involved in gluconeogenesis. Metformin also increases cellular redox potential and inhibits mitochondrial glycerol-3-phosphate dehydrogenase (mGPDH)-dependent and complex IV inhibition-dependent mechanisms. Metformin directly inhibits mGPDH, resulting in an increased cytosolic redox state and reduced gluconeogenesis activity. It also raises the hepatic redox state through an increase in the glutathione to oxidized glutathione ratio (GSH -GSS), inhibiting genes encoding enzymes involved in gluconeogenesis. LDH: lactate dehydrogenase; OCT1: organic transporter 1; TET3: Tet methylcytosine dioxygenase; AMPK: AMP-activated protein kinase.",
"featured": true
},
{
"figure": "https://jabet.bsmiab.org/media/article_images/2024/35/04/178-1714120555-figure3.jpg",
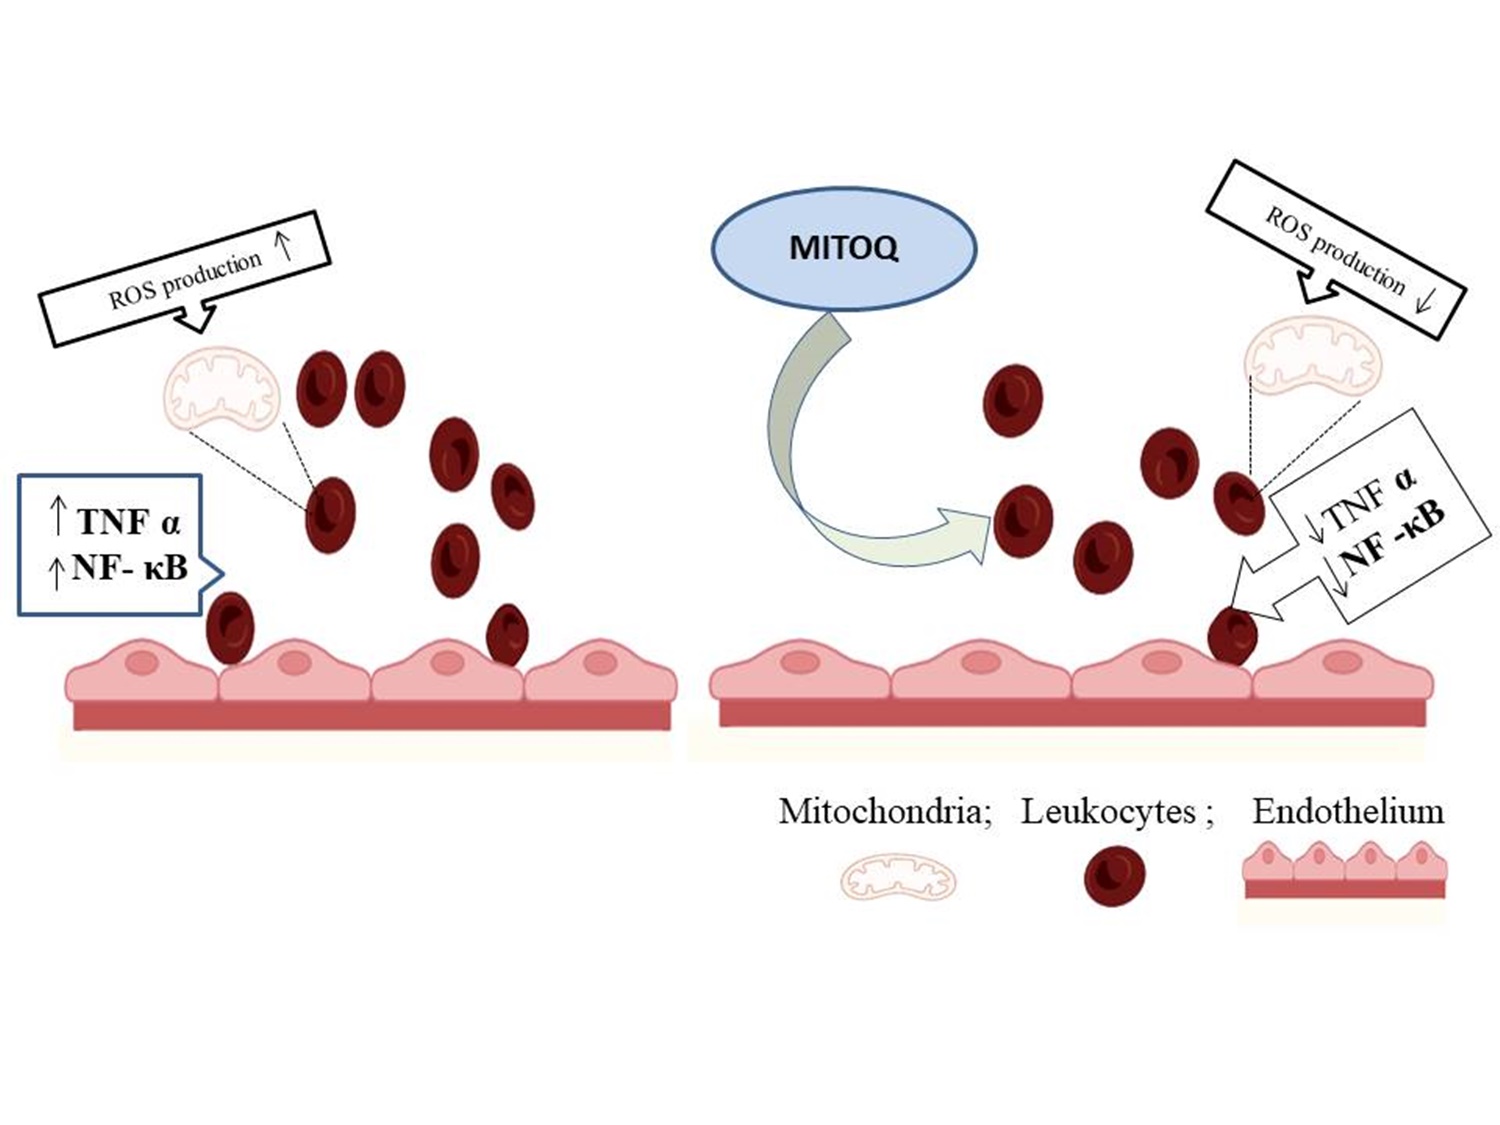
"caption": "Figure 3. Mitochondria-targeted antioxidants therapy. Leukocyte-endothelium interactions in T2D patients can be regulated by antioxidants that target the mitochondria, such as Mitoquinone (MitoQ). When diabetic leukocytes were exposed to MitoQ, their generation of ROS from mitochondria was decreased. Treatment with MitoQ decreased both TNFα and NFκB-p65, which had increased in T2D. ROS: Reactive Oxygen species; TNF α: Tumor necrosis factor α; NF-κB: nuclear factor kappa Beta; MitoQ: mitochondria-targeted ubiquinone.",
"featured": false
}
]
},
{
"id": 289,
"slug": "178-1709698463-impact-of-seaweed-on-growth-performance-sperm-quality-and-testicular-histomorphology-of-ram",
"type": "original_article",
"manuscript_id": "178-1709698463",
"published": "2024-05-11",
"journal_reference": "J Adv Biotechnol Exp Ther. 2024; 7(2): 420-432",
"academic_editor": "Hasan-Al-Faruque, PhD; University of Utah, USA",
"cite_info": "Hoque SAM, Selim ASM, et al. Impact of seaweed on growth performance, sperm quality, and testicular histomorphology of ram. J Adv Biotechnol Exp Ther. 2024; 7(2): 420-432",
"title": "Impact of seaweed on growth performance, sperm quality, and testicular histomorphology of ram",
"DOI": "10.5455/jabet.2024.d36",
"figures": [
{
"figure": "https://jabet.bsmiab.org/media/article_images/2024/07/13/178-1709698463-Figure1.jpg",
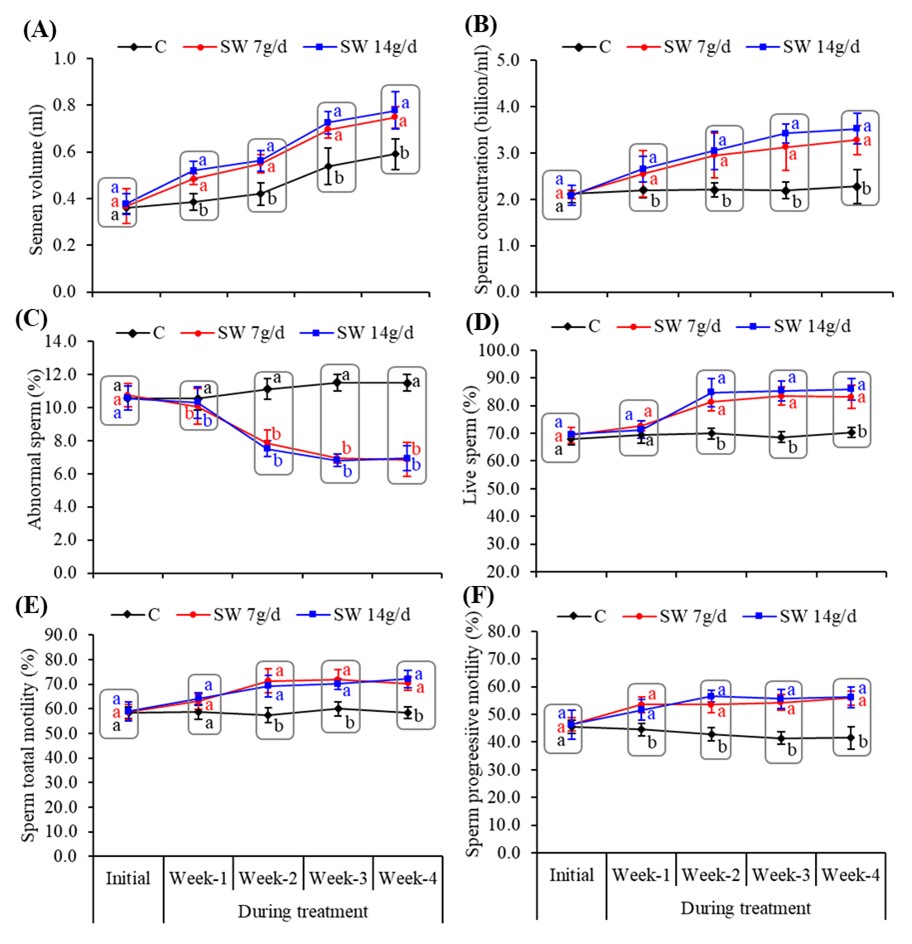
"caption": "Figure 1. The semen volume and sperm quality parameters of ram treated with or without seaweed. Where (A) indicates Semen volume, (B) Sperm concentration, (C) Percentage of abnormal sperm, (D) Percentage of live sperm, (E) Sperm total motility and (F) Sperm progressive motility. Values are Mean ± SD of five replicates. Different lowercase letters superscripts (a or b) in the same week or duration (rectangular boxes) indicates the significant (p<0.05) differences among the treatments. C – Control; SW 7g/d – Seaweed treated group (7g/d/head); SW 14g/d – Seaweed treated group (14g/d/head).",
"featured": false
},
{
"figure": "https://jabet.bsmiab.org/media/article_images/2024/07/13/178-1709698463-Figure2.jpg",
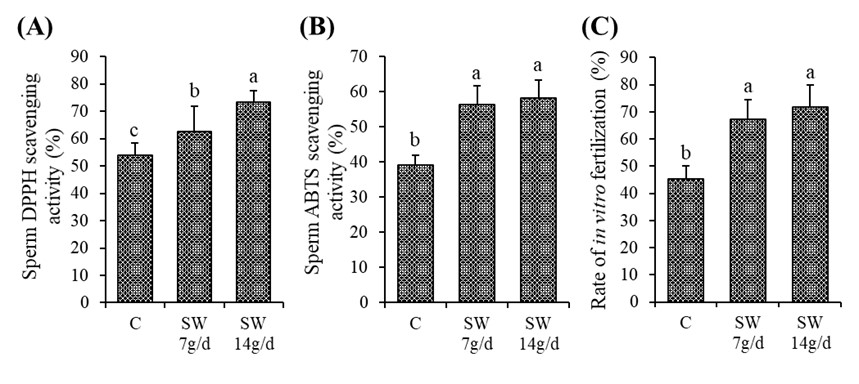
"caption": "Figure 2. The radical scavenging activity and fertilizing ability of sperm. Where (A) indicates sperm DPPH scavenging activity, (B) ABTS scavenging activity, and (C) Rate of In vitro fertilization. Values are Mean ± SD of five replicates. Different lowercase letters on the bar (a or b) indicate the significant (p<0.05) difference among the treatments. C – Control; SW 7g/d – Seaweed treated group (7g/d/head); SW 14g/d – Seaweed treated group (14g/d/head).",
"featured": false
},
{
"figure": "https://jabet.bsmiab.org/media/article_images/2024/07/13/178-1709698463-Figure3.jpg",
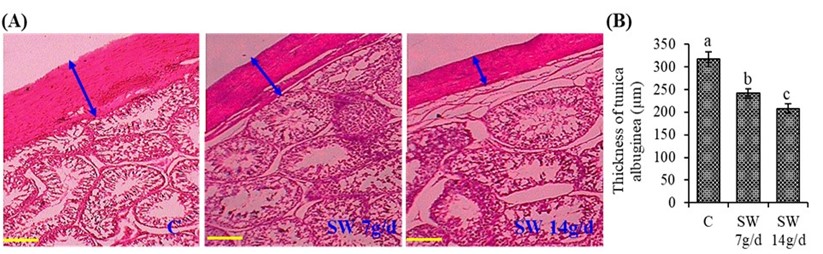
"caption": "Figure 3. The histological sections and the thickness of tunica albuginea of testis. Where (A) indicates testicular morphology showing the tunica albuginea, (B) the thickness of tunica albuginea. Values are Mean ± SD of five replicates of the average of both right and left testis. Different lowercase letters on the bar (a or b) indicate the significant (p<0.05) difference among the treatments. C – Control; SW 7g/d – Seaweed treated group (7g/d/head); SW 14g/d – Seaweed treated group (14g/d/head). Scale bar is 200 µm.",
"featured": false
},
{
"figure": "https://jabet.bsmiab.org/media/article_images/2024/17/02/178-1709698463-Figure4.jpg",
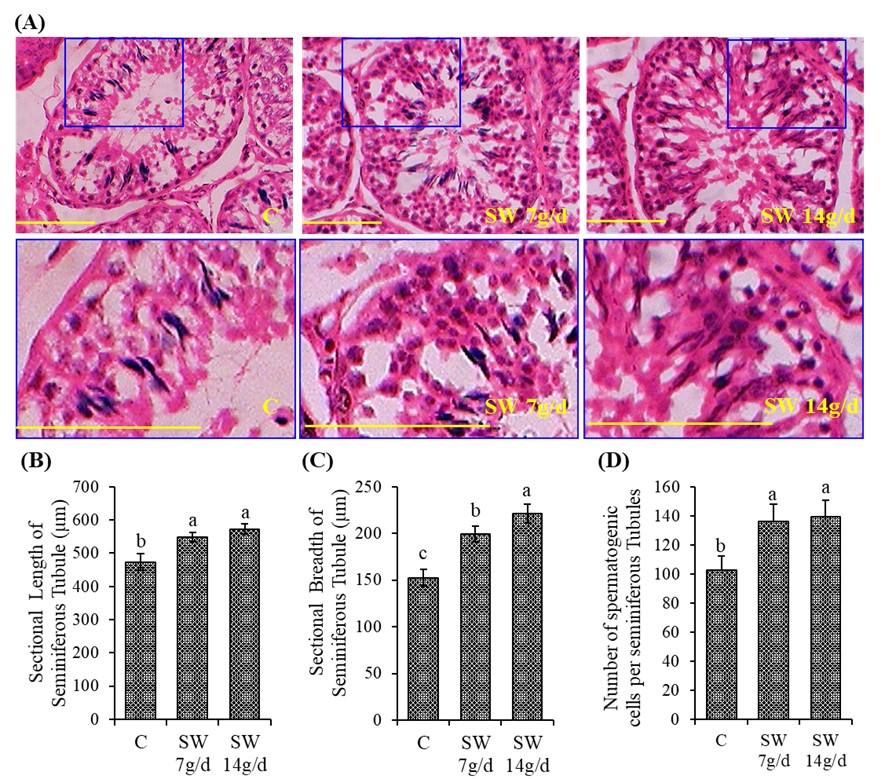
"caption": "Figure 4. The histological sections show the seminiferous tubules of testis. Where (A) indicates morphology of seminiferous tubules, (B) the length of seminiferous tubules, (C) the breadth of seminiferous tubules and (D) the number of spermatogenic cells in the seminiferous tubules. Values are Mean ± SD of five replicates of the average of both right and left testis. Different lowercase letters on the bar (a or b) indicate the significant (p<0.05) difference among the treatments. C – Control; SW 7g/d – Seaweed treated group (7g/d/head); SW 14g/d – Seaweed treated group (14g/d/head). The scale bar is 100 µm.",
"featured": true
}
]
},
{
"id": 263,
"slug": "178-1695566469-recent-advances-in-peptide-based-nanovaccines-for-re-emerging-and-emerging-infectious-diseases",
"type": "review_article",
"manuscript_id": "178-1695566469",
"published": "2023-11-10",
"journal_reference": "J Adv Biotechnol Exp Ther. 2024; 7(1):106-117",
"academic_editor": "Md Jamal Uddin, PhD; ABEx Bio-Research Center, Dhaka, Bangladesh",
"cite_info": "Orosco FL. Recent advances in peptide-based nanovaccines for re-emerging and emerging infectious diseases. J Adv Biotechnol Exp Ther. 2024; 7(1):106-117.",
"title": "Recent advances in peptide-based nanovaccines for re-emerging and emerging infectious diseases",
"DOI": "10.5455/jabet.2024.d10",
"figures": [
{
"figure": "https://jabet.bsmiab.org/media/article_images/2023/32/10/178-1695566469-Figure1.jpg",
"caption": "Figure 1. Activation of cellular and humoral immune responses by nanovaccines. The cellular and humoral immune responses to nanovaccines are initiated when the nanovaccine enters the epithelium to activate dendritic cells. Dendritic cells migrate to lymph nodes to prime T and B cell which will attack viruses and virus-infected cells.",
"featured": true
},
{
"figure": "https://jabet.bsmiab.org/media/article_images/2023/32/10/178-1695566469-Figure2.jpg",
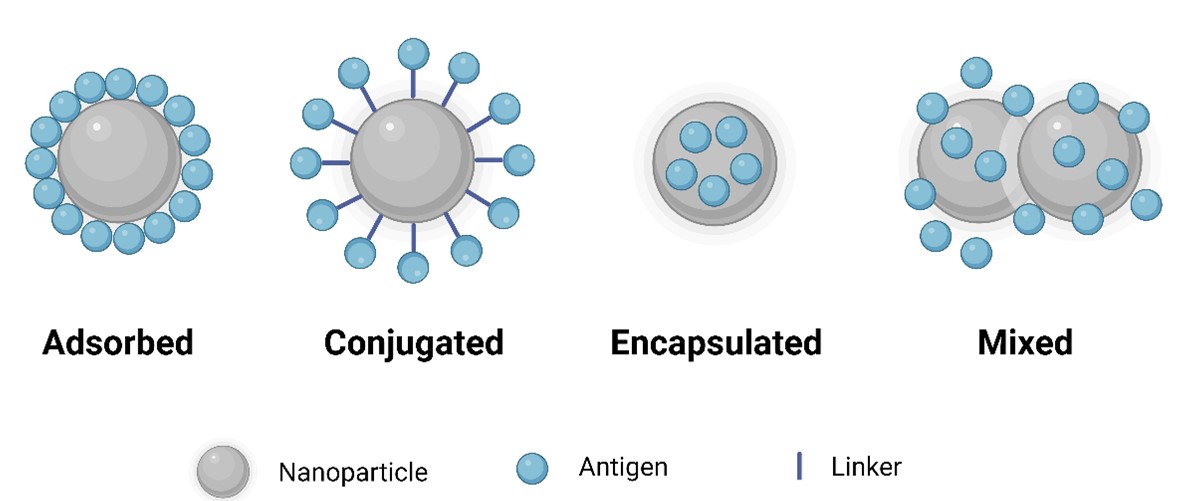
"caption": "Figure 2. Nanovaccines can be formulated by physical adsorption, chemical conjugation, encapsulation, or physical mixing of antigens with nanoparticles.",
"featured": false
},
{
"figure": "https://jabet.bsmiab.org/media/article_images/2023/32/10/178-1695566469-Figure3.jpg",
"caption": "Figure 3. Types of nanovaccines. The different types of nannovaccines used for viral infections include vaccines conjugated to polymeric, liposome, and inorganic nanoparticles.",
"featured": false
}
]
},
{
"id": 238,
"slug": "178-1677590380-restoration-of-hepatorenal-dysfunction-and-injury-by-zinc-and-folic-acid-combination-in-bisphenol-a-intoxicated-mice",
"type": "original_article",
"manuscript_id": "178-1677590380",
"published": "2023-06-20",
"journal_reference": "J Adv Biotechnol Exp Ther. 2023; 6(3): 541-551.",
"academic_editor": "Hasan-Al-Faruque, PhD; University of Utah, USA",
"cite_info": "Mustari A, Alam M, et al. Restoration of hepatorenal dysfunction and injury by zinc and folic acid combination in bisphenol A-intoxicated mice . J Adv Biotechnol Exp Ther. 2023; 6(3): 541-551.",
"title": "Restoration of hepatorenal dysfunction and injury by zinc and folic acid combination in bisphenol A-intoxicated mice",
"DOI": "10.5455/jabet.2023.d147",
"figures": [
{
"figure": "https://jabet.bsmiab.org/media/article_images/2023/09/14/178-1677590380-Figure_1.jpg",
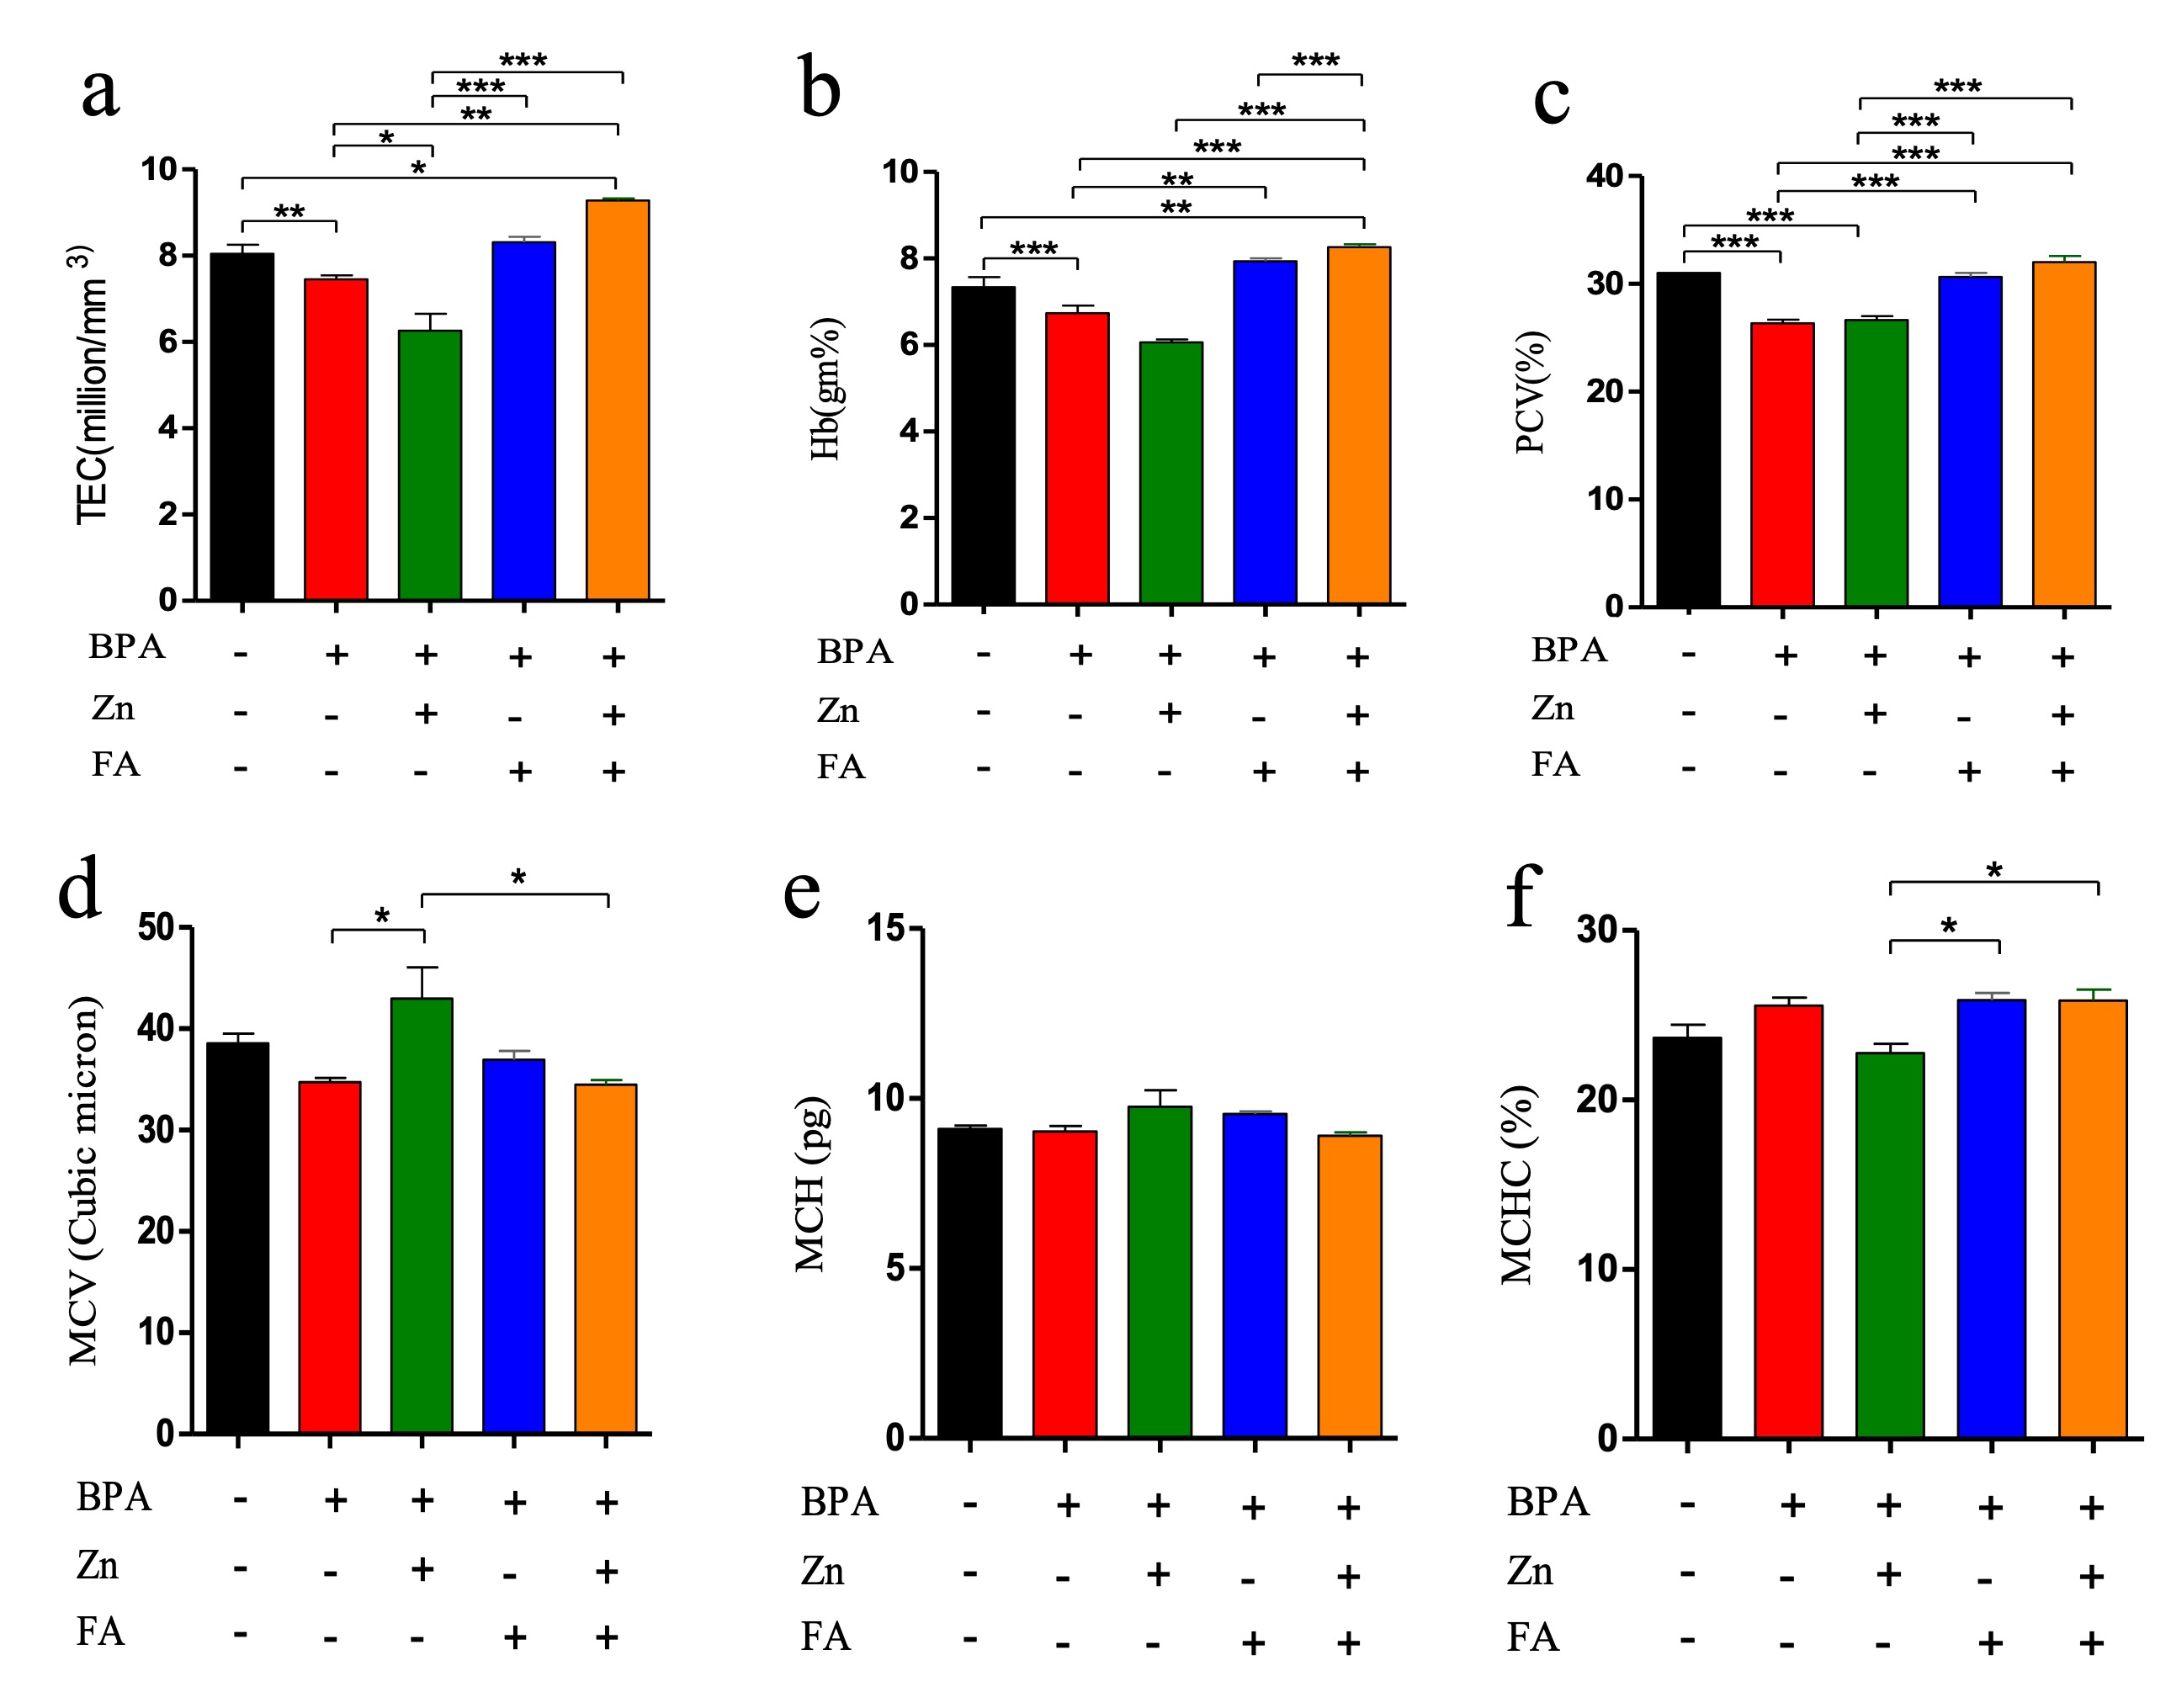
"caption": "Figure 1. Effects of Zn and FA supplementation on hematological parameters in BPA-exposed male mice. Mice were kept untreated (Group A) or treated with BPA (Group B), Zn (Group C), FA (Group D) or both Zn and FA (Group E) and the values of (a) TEC, (b) Hb, (c) PCV, (d) MCV, (e) MCH and (f) MCHC were measured. Data indicate mean ± SEM of 3 replicates. Each replicate contains pooled blood of five mice (n=5). One-way ANOVA with Bonferroni multiple comparison tests was performed. Here, ***=Statistically significant at 0.1% level (p≤ 0.001), **=Statistically significant at 1% level (p≤ 0.01), *= Statistically significant at 5% level (p ≤0.05).",
"featured": false
},
{
"figure": "https://jabet.bsmiab.org/media/article_images/2023/09/14/178-1677590380-Figure_2.jpg",
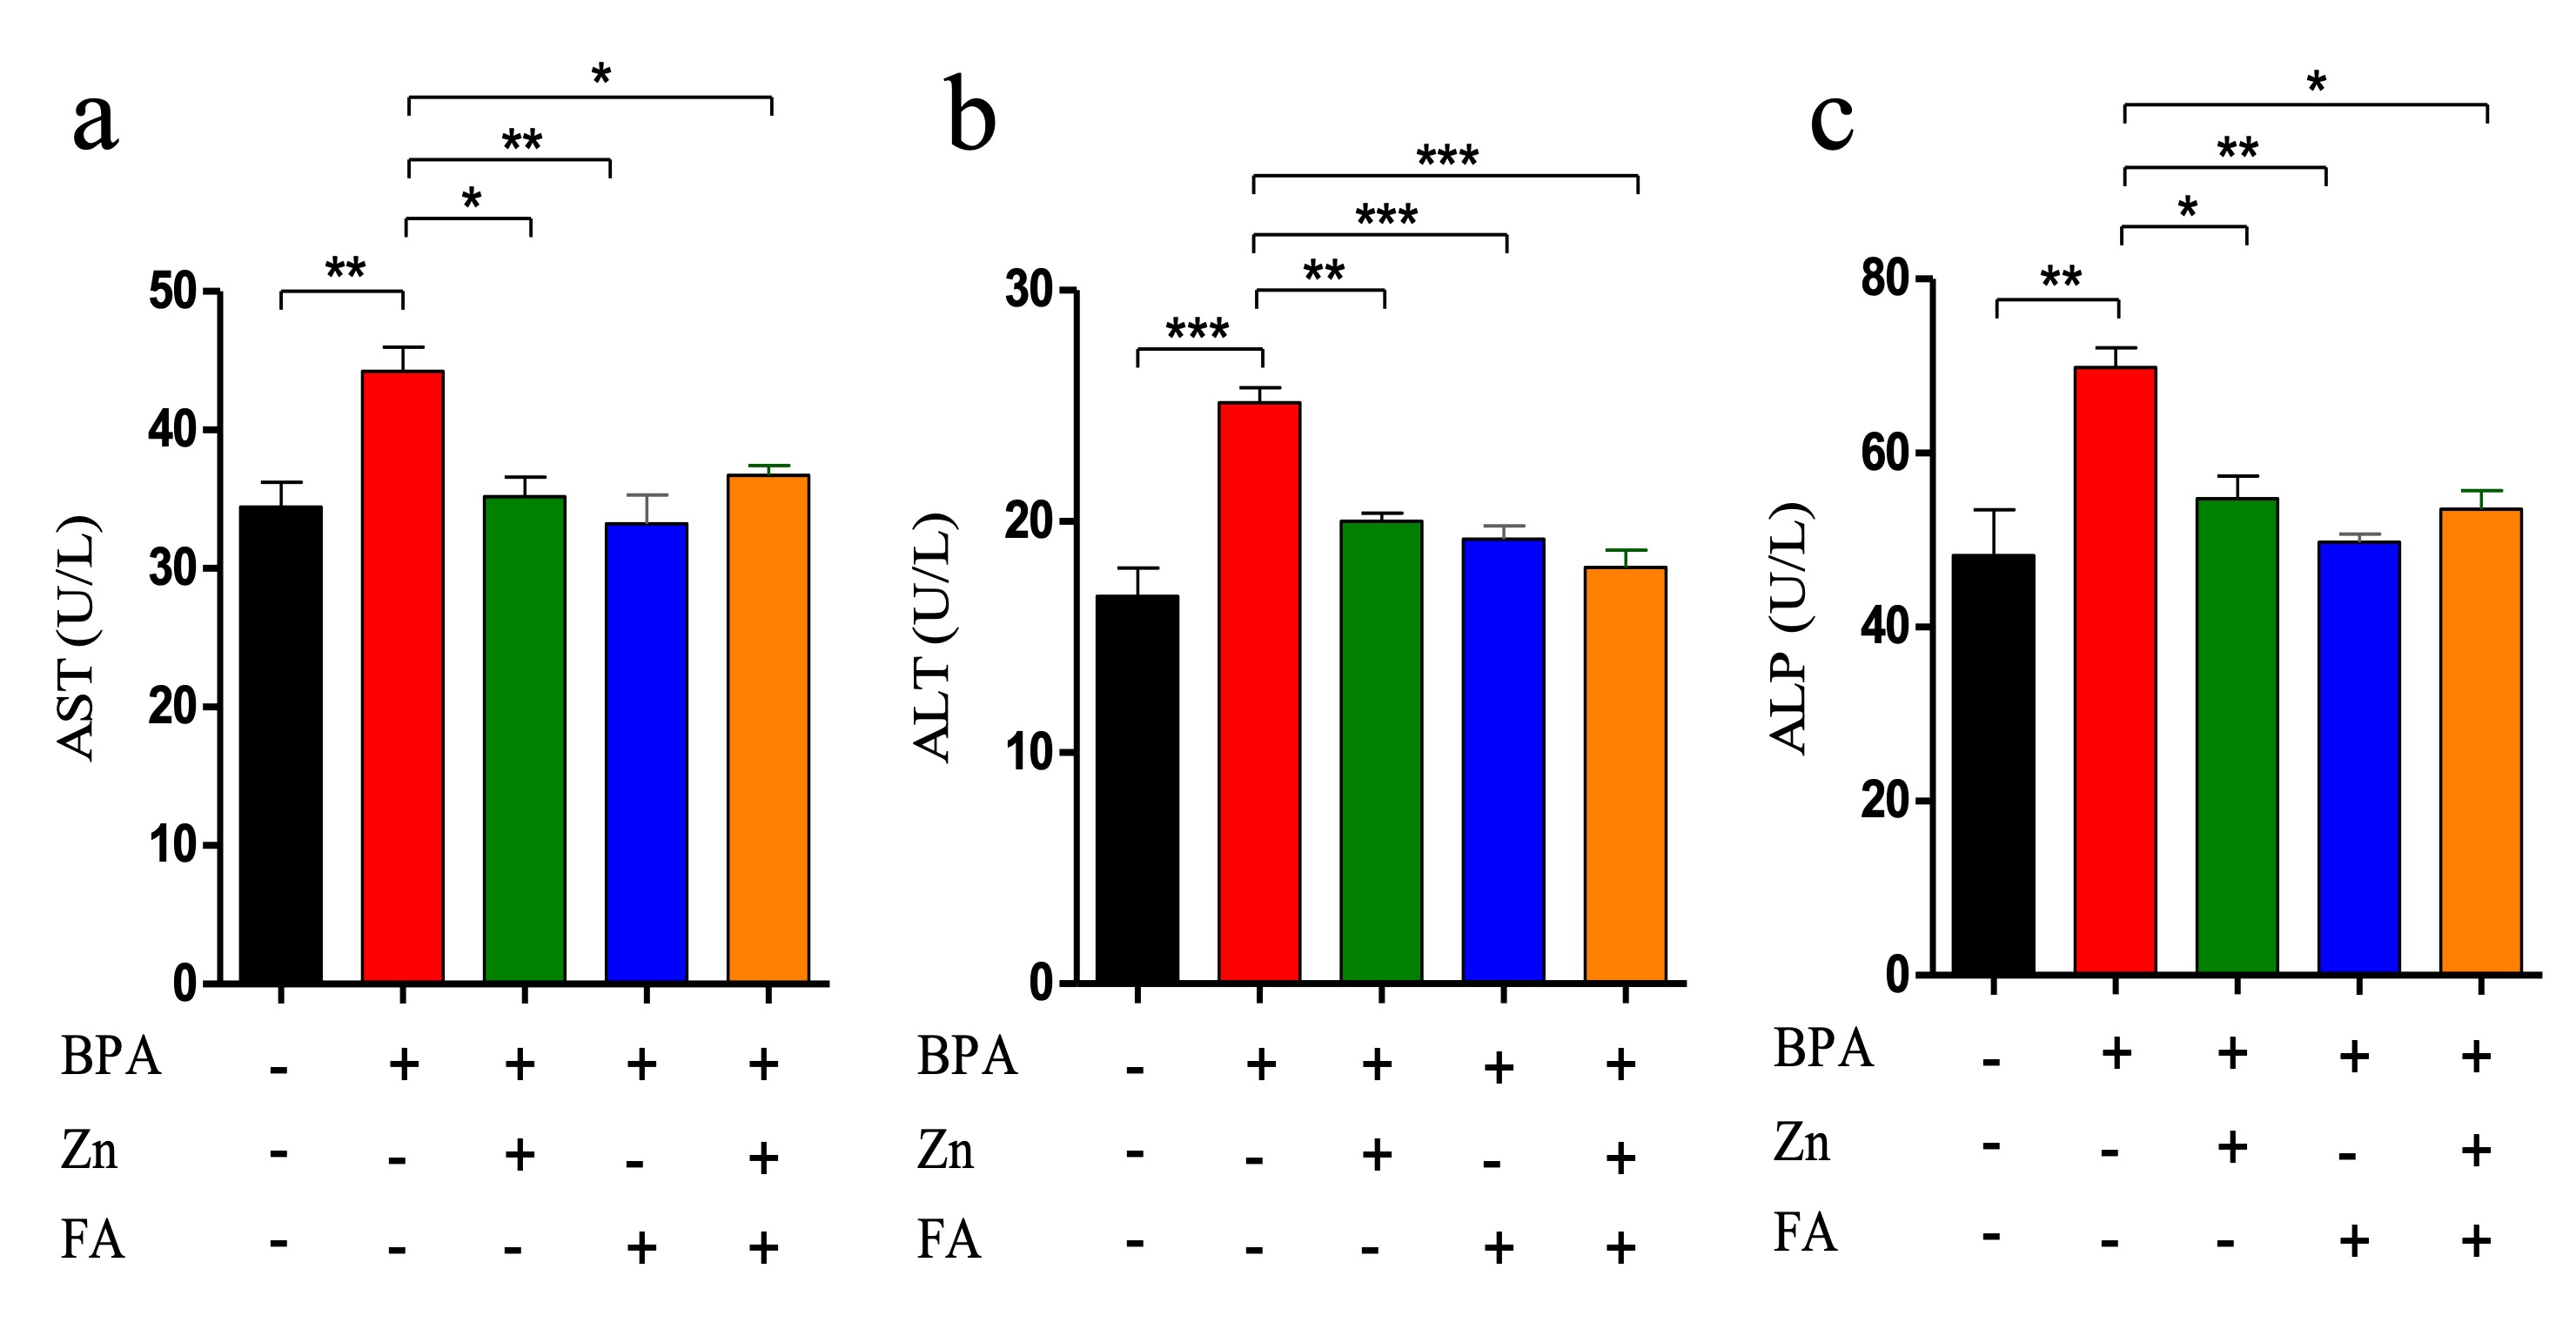
"caption": "Figure 2. Effects of Zn and FA supplementation on liver function biomarkers of BPA-exposed mice. Mice were kept untreated (Group A) or treated with BPA (Group B), Zn (Group C), FA (Group D) or both Zn and FA (Group E) and the values of (a) AST (b) ALT and (c) ALP were measured. Data indicate mean ± SEM of 3 replicates. Each replicate contains pooled sera of five mice (n=5). One-way ANOVA with Bonferroni multiple comparison tests was performed. Here, ***=Statistically significant at 0.1% level (p≤ 0.001), **=Statistically significant at 1% level (p≤ 0.01), *= Statistically significant at 5% level (p≤ 0.05).",
"featured": false
},
{
"figure": "https://jabet.bsmiab.org/media/article_images/2023/09/14/178-1677590380-Figure_3.jpg",
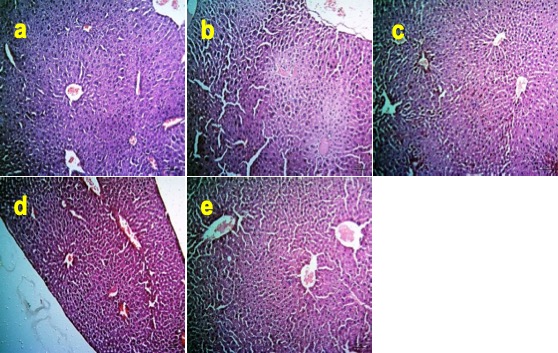
"caption": "Figure 3. Effects of Zn and FA supplementation on histoarchitecture of liver of BPA-exposed mice. (a) Section of liver of control mice (Group A) showing normal architecture. (b) Section of liver of BPA-exposed mice (Group B) showing severe degenerative and necrotic changes (DNC) of hepatocytes. Sections of the liver of mice fed with (c) Zn (Group C), (d) FA (Group D) and (e) both Zn and FA (Group E) show preservation of normal architecture of the hepatocytes in the liver. Haematoxylin and eosin stain, bar = 50 µm indicate magnification.",
"featured": true
},
{
"figure": "https://jabet.bsmiab.org/media/article_images/2023/09/14/178-1677590380-Figure_4.jpg",
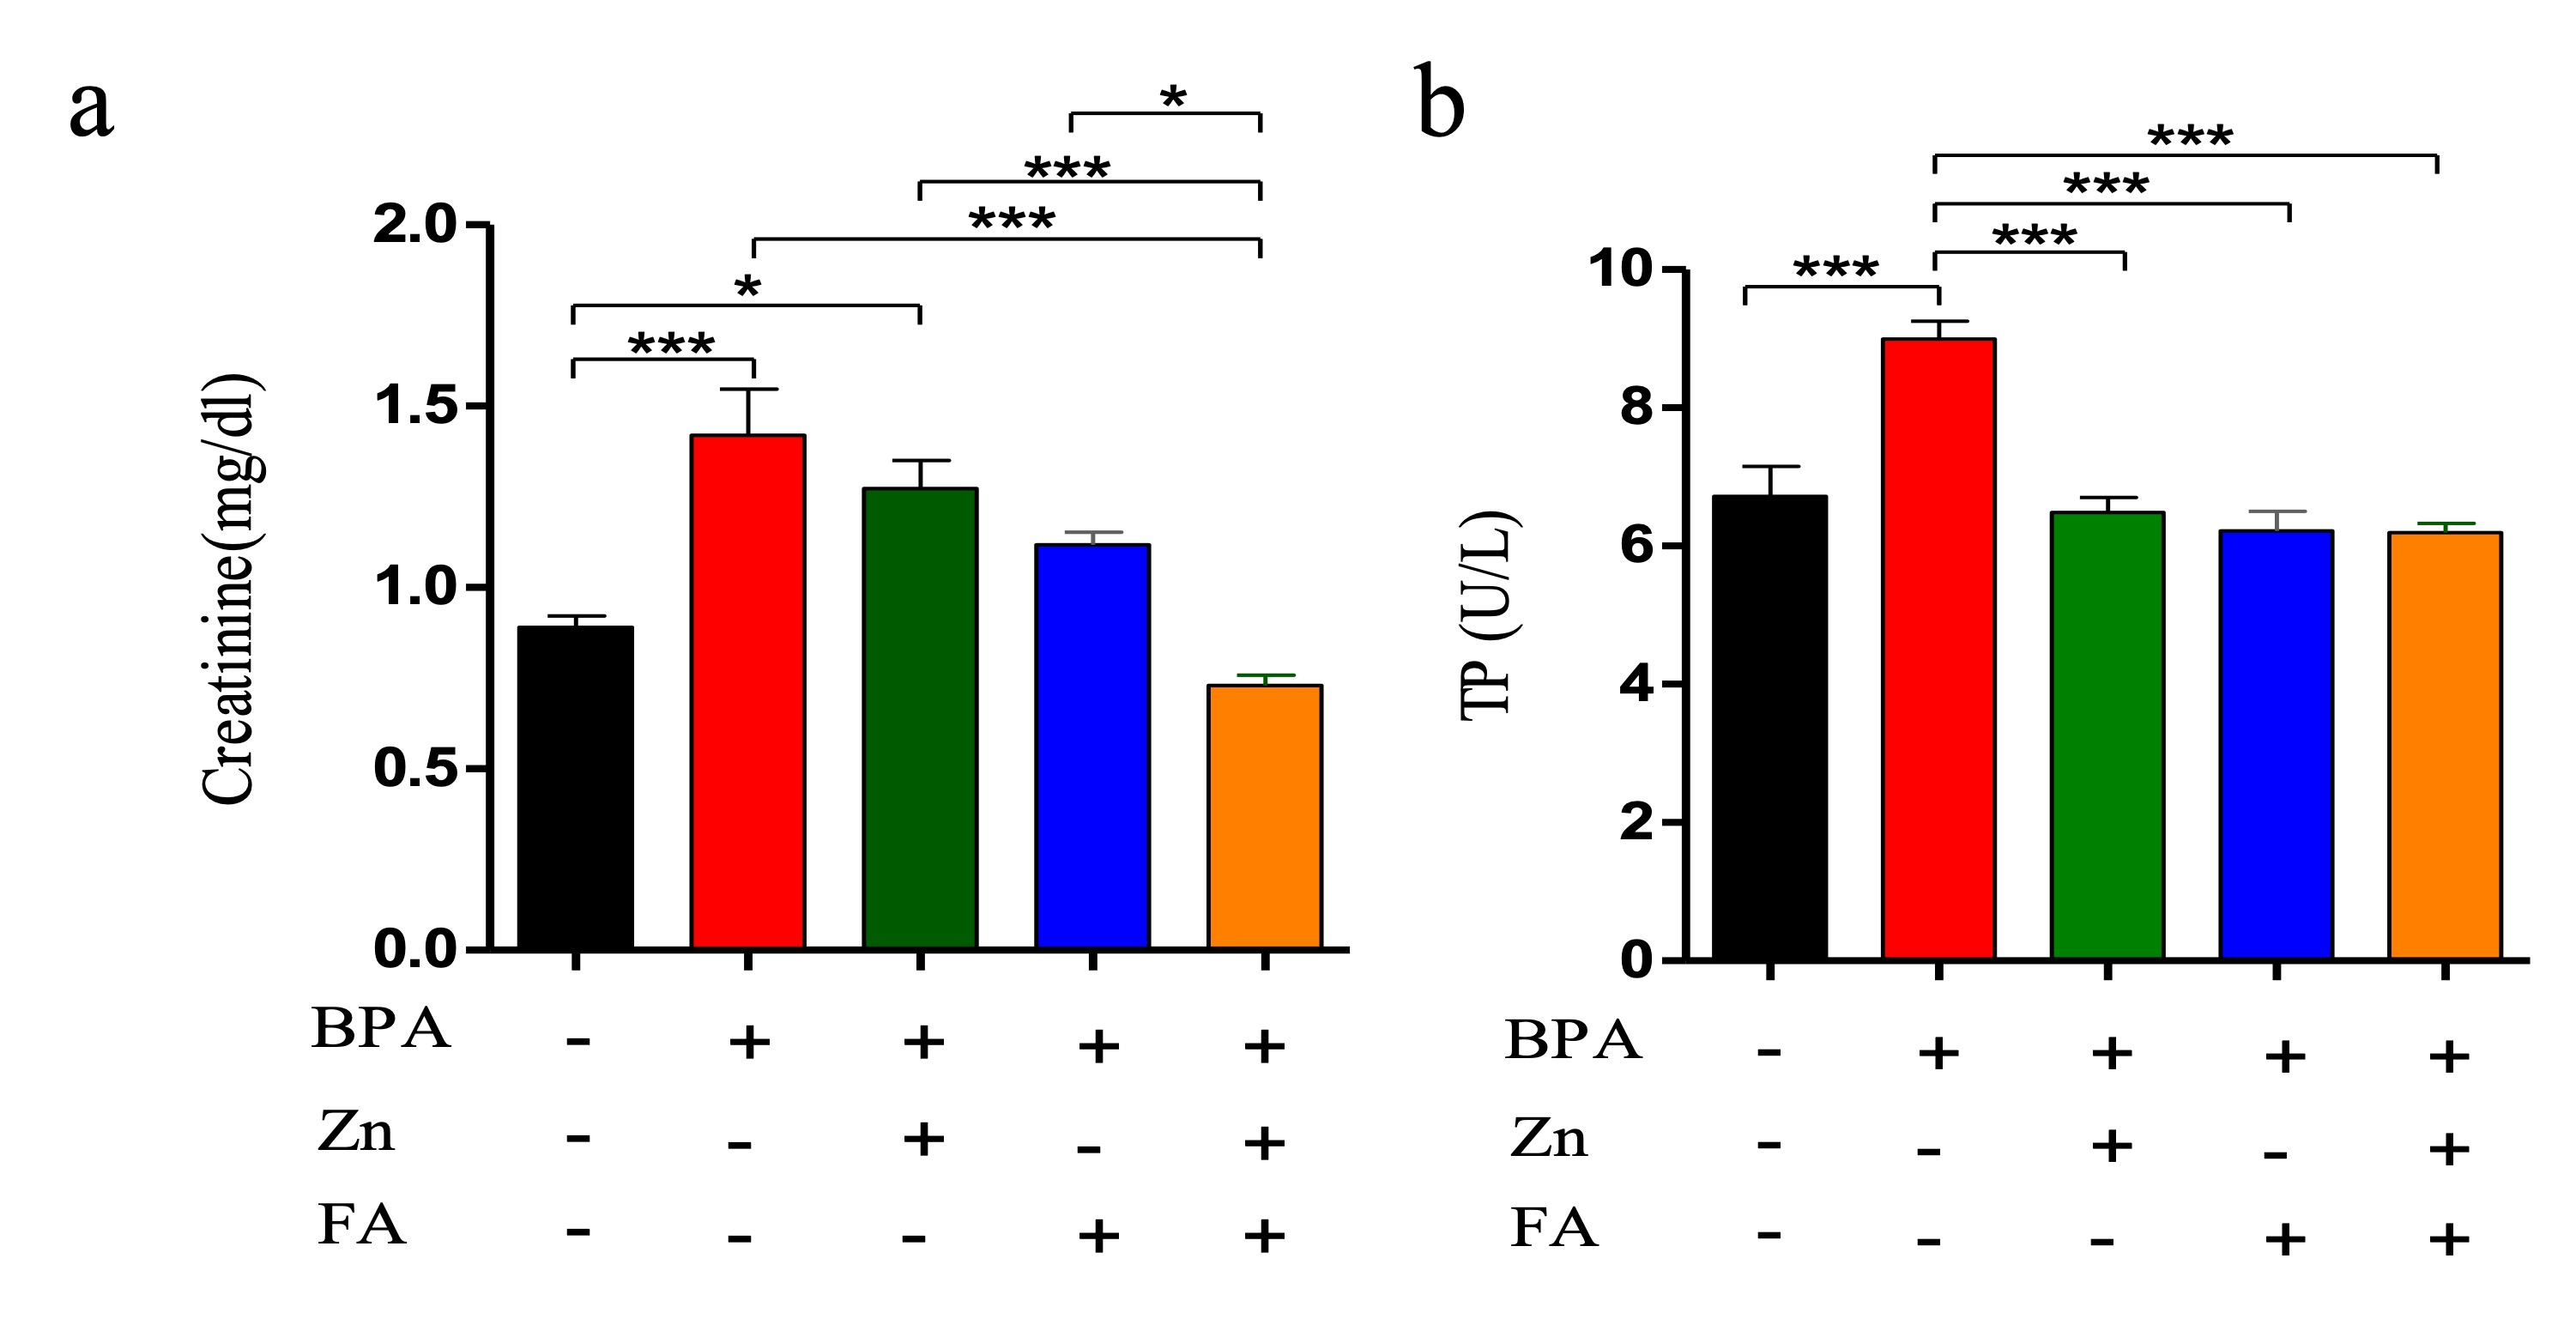
"caption": "Figure 4. Effects of Zn and FA supplementation on kidney function biomarkers of BPA-exposed mice. Mice were kept untreated (Group A) or treated with BPA (Group B), Zn (Group C), FA (Group D) or both Zn and FA (Group E) and the values of (a) serum creatinine and (b) Total protein (TP) were measured. Data indicate mean ± SEM of 3 replicates. Each replicate contains pooled sera of five mice (n=5). One-way ANOVA with Bonferroni multiple-comparison tests was performed. Here, ***=Statistically significant at 0.1% level (p≤ 0.001), **=Statistically significant at 1% level (p≤ 0.01), *= Statistically significant at 5% level (p≤ 0.05).",
"featured": false
},
{
"figure": "https://jabet.bsmiab.org/media/article_images/2023/09/14/178-1677590380-Figure_5.jpg",
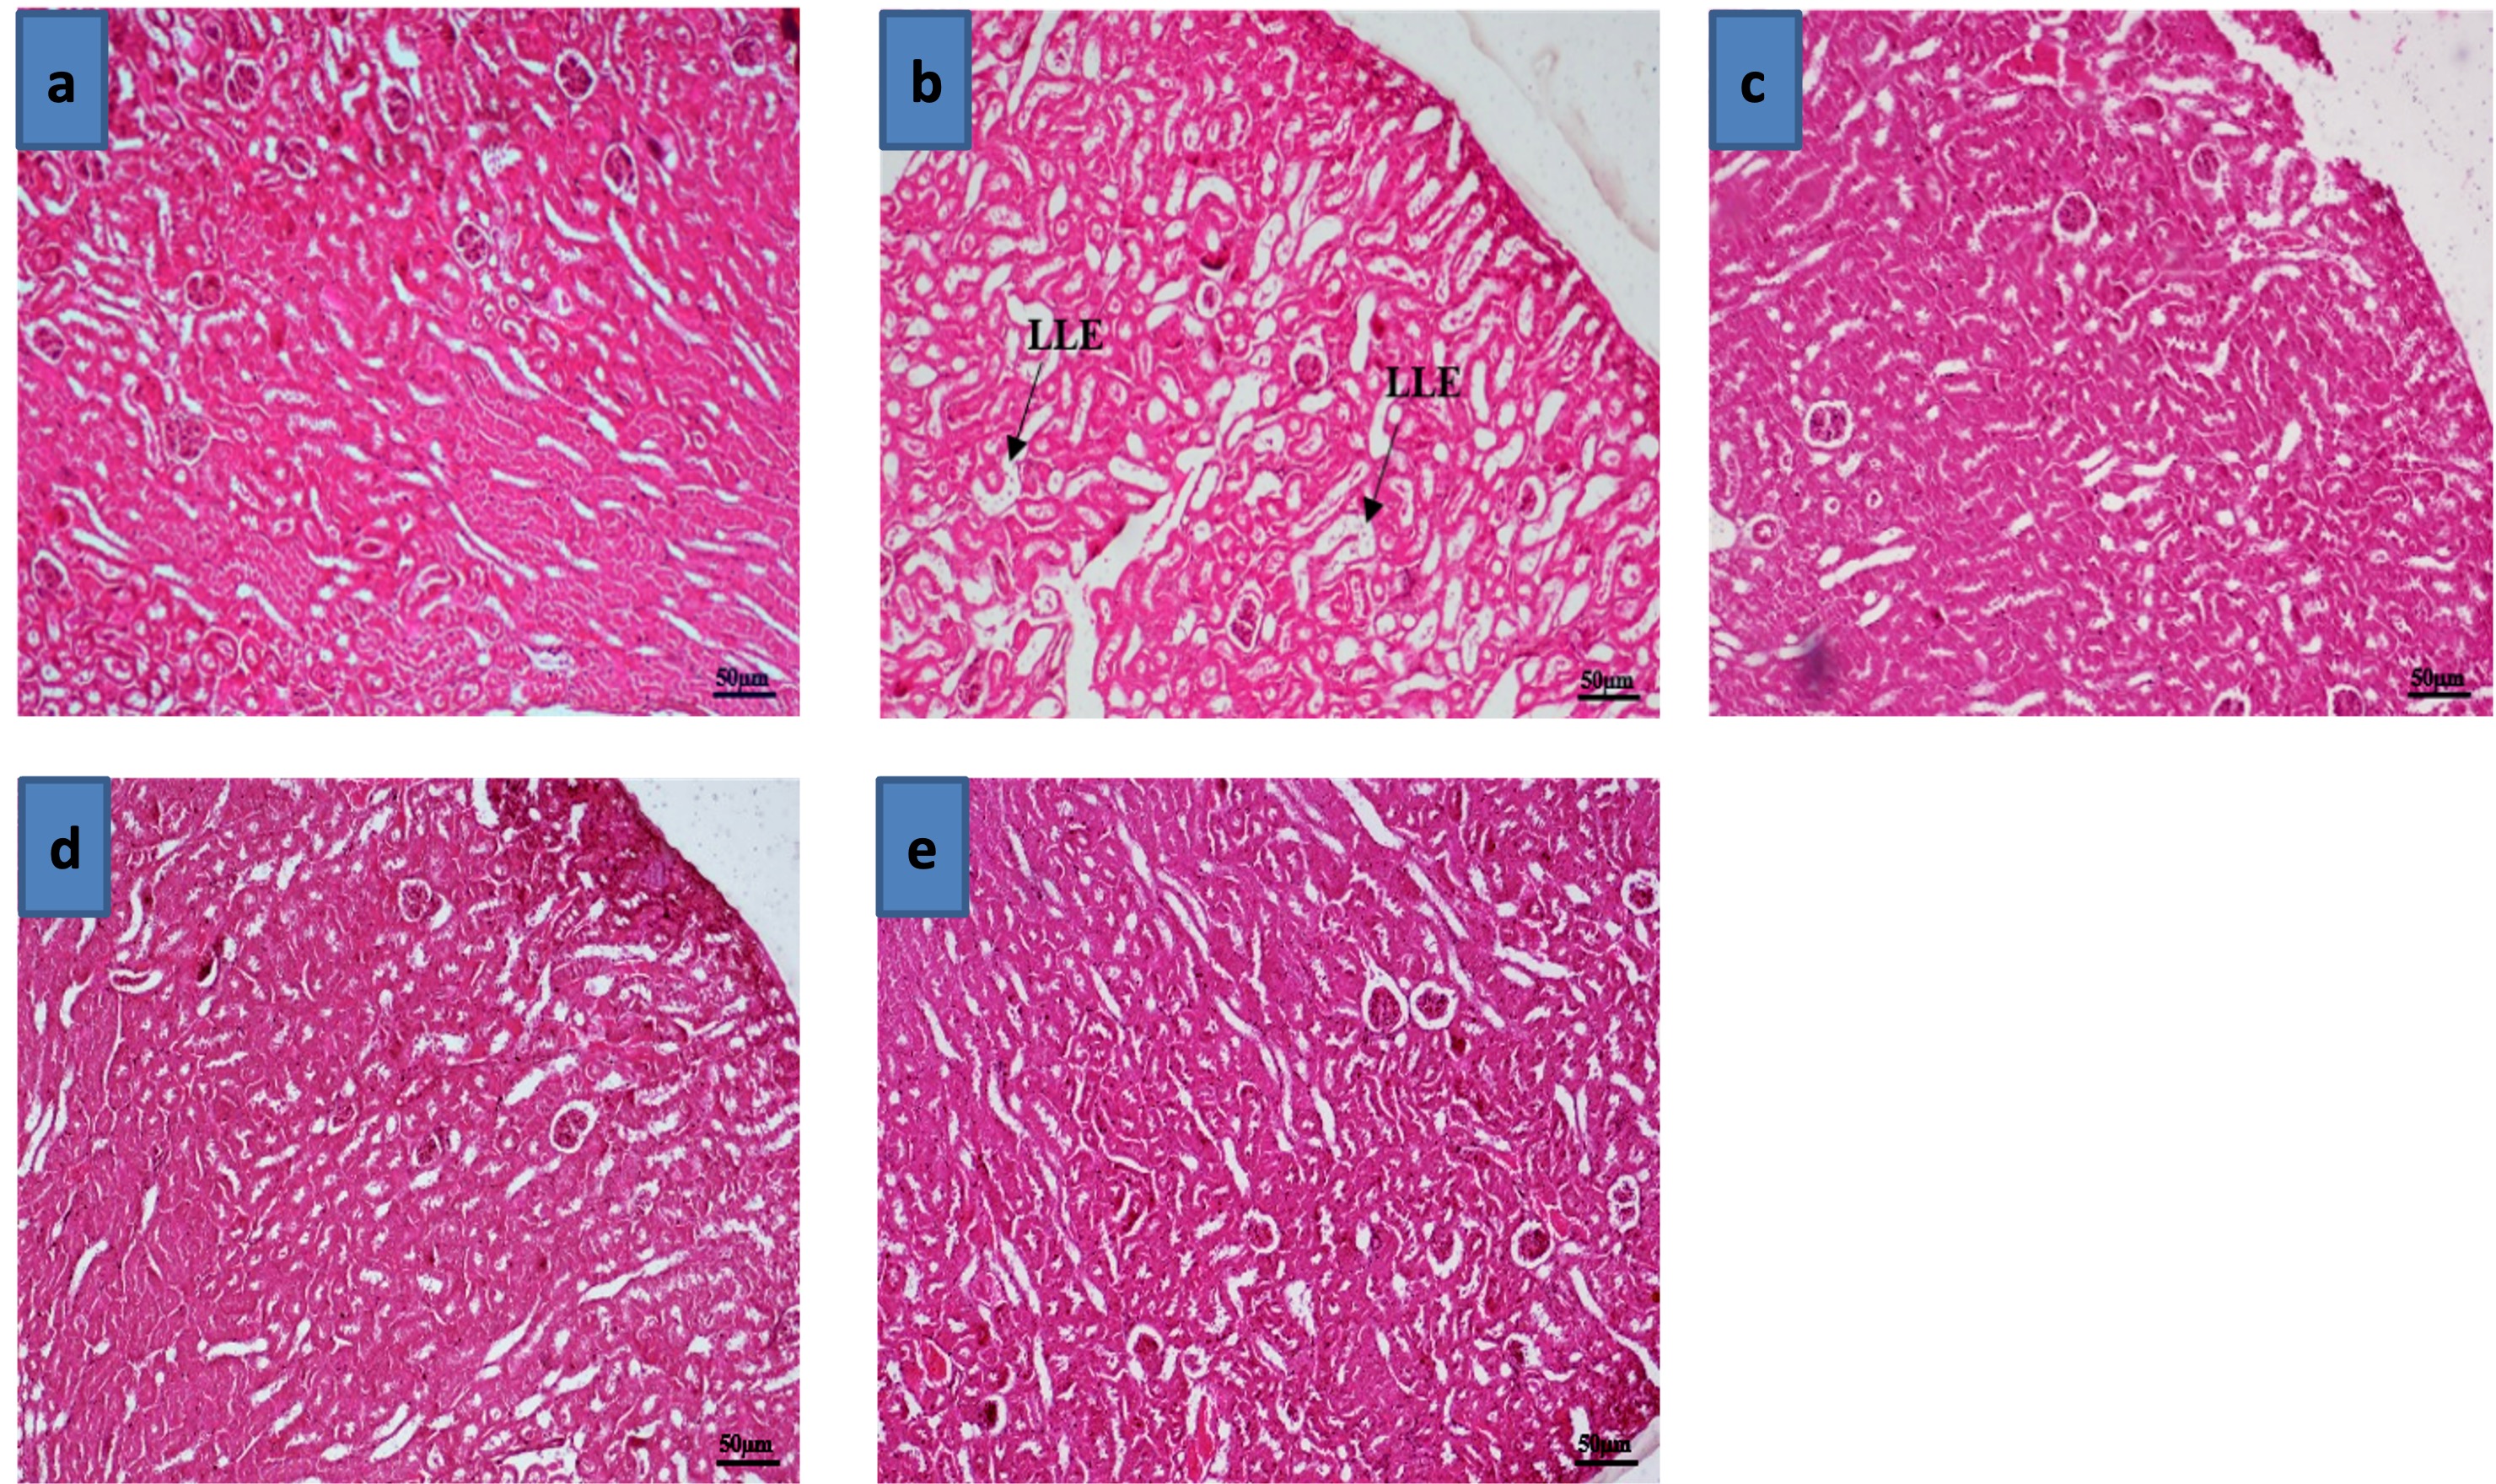
"caption": "Figure 5. Effects of Zn and FA supplementation on histoarchitecture of kidney of BPA-exposed mice. (a) Section of kidney of control mice (Group A) showing normal architecture. (b) Section of kidney of BPA-exposed mice (Group B) showing severe loss of lining epithelium (LLE) of the renal tubule. Sections of the kidney of mice fed with (c) Zn (Group C), (d) FA (Group D), and (e) both Zn and FA (Group E), show the preservation of the normal architecture of the kidney. Haematoxylin and eosin stain, bar = 50 µm indicate magnification.",
"featured": false
},
{
"figure": "https://jabet.bsmiab.org/media/article_images/2023/09/14/178-1677590380-Figure_6.jpg",
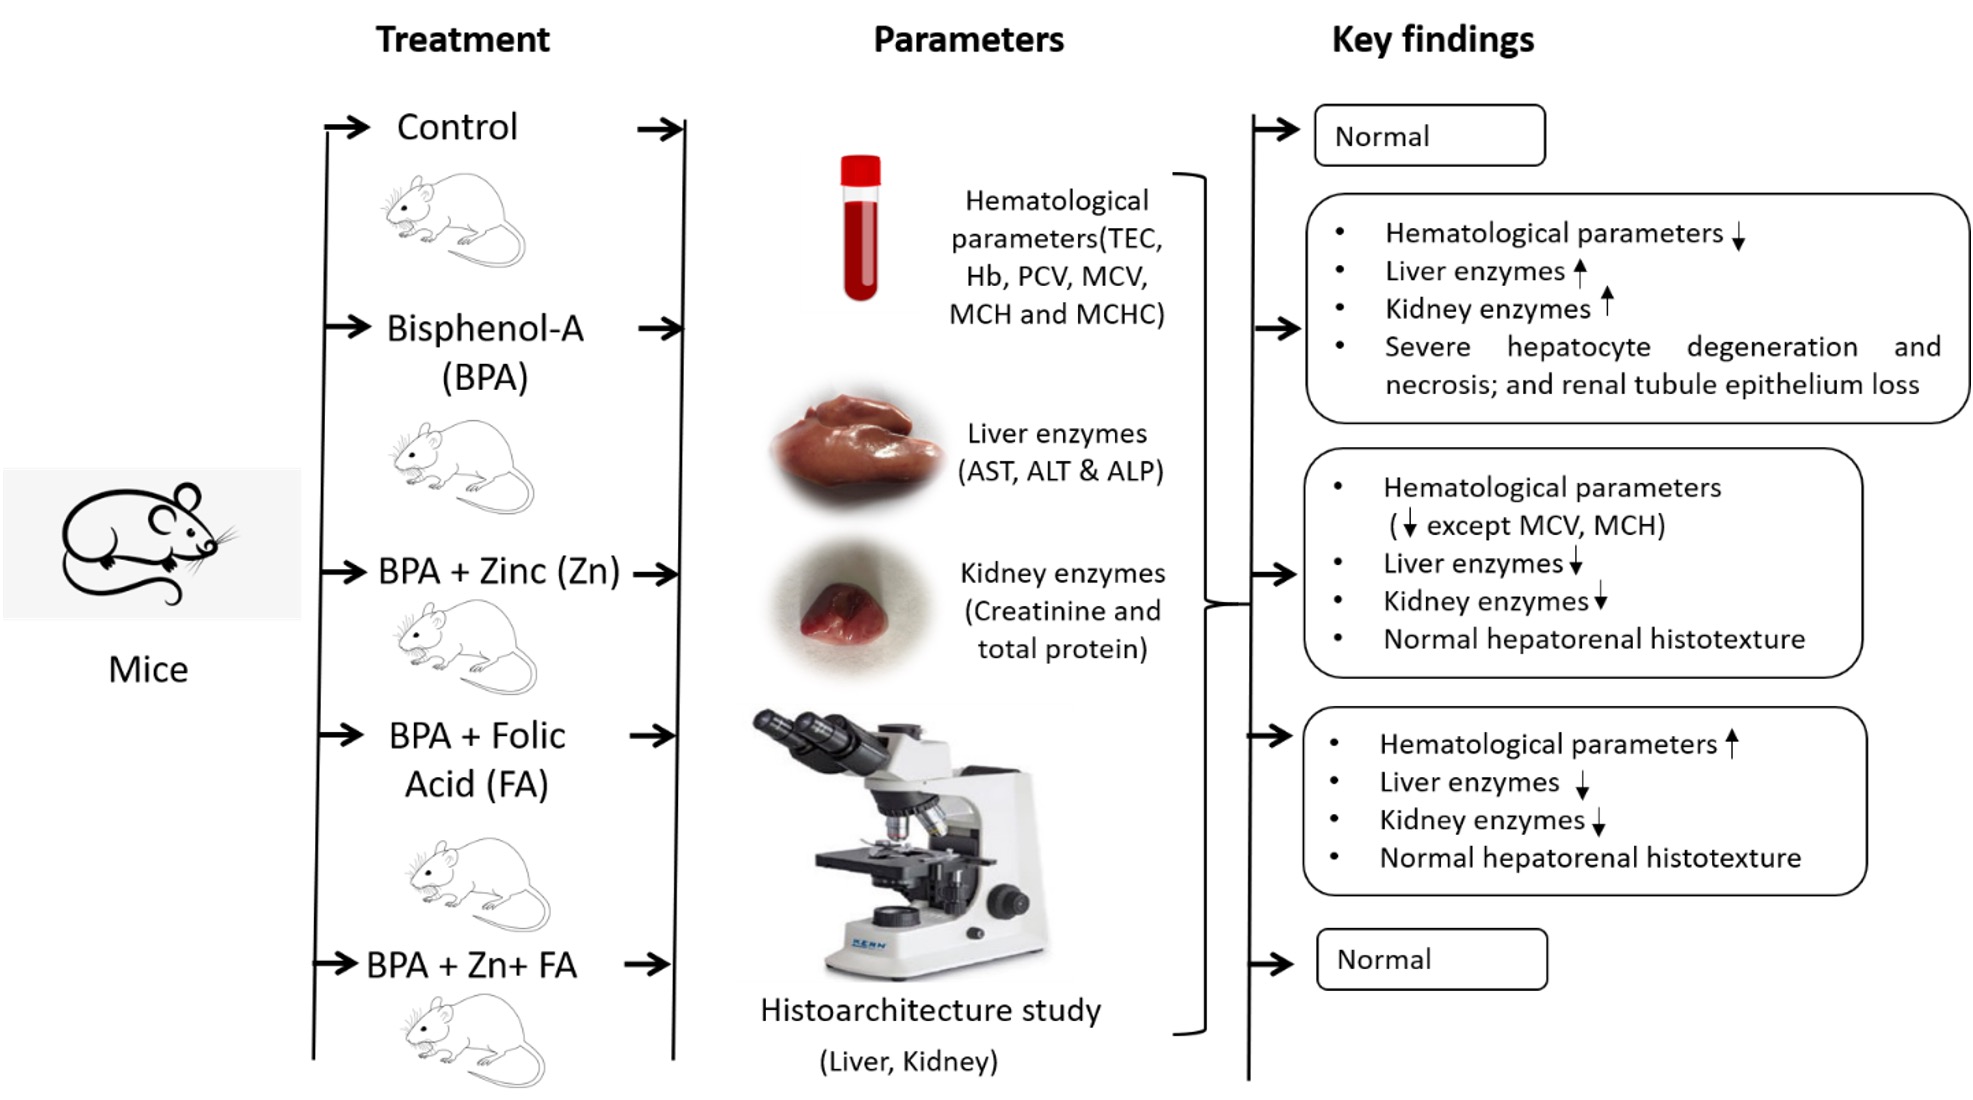
"caption": "Figure 6. Schematic diagram is showing the effects of Zn and FA supplementation on hematological parameters and hepatorenal functions in BPA-exposed mice. Mice exposed to BPA were kept untreated (control) or treated with Zn, FA or both Zn and FA.",
"featured": false
}
]
}
]