HTTP 200 OK
Allow: GET, HEAD, OPTIONS
Content-Type: application/json
Vary: Accept
{
"count": 319,
"next": "https://jabet.bsmiab.org/articles/?format=api&page=3",
"previous": "https://jabet.bsmiab.org/articles/?format=api",
"results": [
{
"id": 324,
"slug": "178-1724280161-a-combination-of-ursodeoxycholic-acid-and-allium-sativum-prevents-liver-cirrhosis-in-cholestatic-rats",
"featured": false,
"slider": false,
"issue": "Vol8 Issue1",
"type": "original_article",
"manuscript_id": "178-1724280161",
"recieved": "2024-08-21",
"revised": null,
"accepted": "2025-01-20",
"published": "2025-01-28",
"pdf_file": "https://jabet.bsmiab.org/media/pdf_file/2025/45/178-1724280161.pdf",
"title": "A combination of ursodeoxycholic acid and <span>Allium sativum</span> prevents liver cirrhosis in cholestatic rats",
"abstract": "<p>Cholestasis causes liver cirrhosis due to chronic total obstruction, in which accumulated bile acids induce liver inflammation and fibrosis. Inflammatory conditions are associated with hypoalbuminemia, and changes in albumin levels indicate the patient's clinical condition. <em>Allium sativum</em> has anti-inflammatory, antioxidant, and antifibrotic effects against various diseases. Further, ursodeoxycholic acid (UDCA) is one of the few available therapies for cirrhosis. Thus, this study aimed to assess the combination of <em>A. sativum</em> and UDCA as standard therapy in preventing liver cirrhosis and cholestasis. The current study was carried out with 35 male Sprague Dawley rats, which were randomly assigned into healthy, negative, and positive control groups, and three treatments of UDCA and graded doses of <em>A. sativum</em> extract. Biliary duct ligation was used for inducing cholestasis, and the treatment was given for 21 days. Liver cirrhosis was assessed based on Laennec grade by histopathological examination. Albumin levels are measured by examining blood serum. The combination of UDCA and <em>A. sativum</em> extract significantly reduced the degree of liver fibrosis and increased albumin levels in mice with cholestasis (p<0.05). There was no difference in the degree of liver fibrosis between the graded doses of <em>A. sativum</em>. Albumin levels were significantly correlated with the degree of liver fibrosis (p<0.05). In conclusion, the data suggest that <em>A. sativum</em> administration can be combined with UDCA to increase the hepatoprotective effect against cholestasis in rats.<strong> </strong></p>",
"journal_reference": "J Adv Biotechnol Exp Ther. 2025; 8(1): 192-199",
"academic_editor": "Md. Abdul Hannan, PhD; Bangladesh Agricultural University, Bangladesh",
"cite_info": "Adhuri MN, Susilaningsih N, et al. A combination of ursodeoxycholic acid and Allium sativum prevents liver cirrhosis in cholestatic rats. J Adv Biotechnol Exp Ther. 2025; 8(1): 192-199",
"keywords": [
"Liver",
"Cholestasis",
"Allium sativum",
"Cirrhosis",
"UDCA",
"Albumin"
],
"DOI": "10.5455/jabet.2025.16",
"sections": [
{
"section_number": 1,
"section_title": "INTRODUCTION",
"body": "<p>Cholestasis is a stagnation or a marked reduction in bile secretion and flow from the liver. The accumulation of bile acids that occurs due to obstruction in their flow induces liver injury through an inflammatory response from hepatocytes [<a href=\"#r-1\">1</a>]. Activation of nuclear factor- kappa B (NF-κB) mediates proinflammatory mediators such as tumor necrosis factor-α (TNF-α) and interleukin 6 (IL-6) leading to hepatocyte apoptosis, hepatic stellate cells (HSC) and Kupffer cells activation in mouse models [<a href=\"#r-2\">2</a>,<a href=\"#r-3\">3</a>]. This condition will activate apoptotic signals through the caspase cascade, causing hepatocyte damage, degeneration, necrosis, and replacement of liver parenchyma by fibrotic tissue and regenerative nodules, as well as loss of liver function, which triggers fibrosis and ultimately leads to cirrhosis [<a href=\"#r-4\">4</a>].</p>\r\n\r\n<p>Patients with cirrhosis have impaired hepatocellular function and decreased albumin synthesis [<a href=\"#r-5\">5</a>]. Inflammation increases capillary permeability and serum albumin release, causing expansion of the interstitial space and increasing the albumin volume of distribution. It also causes a shortening of the half-life of albumin and a decrease in the total mass of albumin [<a href=\"#r-5\">5</a>]. Thus, hypoalbuminemia reflects an inflammatory state, which interferes with an adequate response to chronic inflammatory disease, surgery, and chemotherapy and is associated with morbidity and mortality [<a href=\"#r-6\">6</a>]. Albumin has been shown as a major prognostic factor, a predictor of mortality, and a component of the Child-Pugh-Turcotte score, the most frequently used prognostic scoring for cirrhosis [<a href=\"#r-6\">6</a>].</p>\r\n\r\n<p>Ursodeoxycholic acid (UDCA) is one of the few available therapies for cirrhosis. Administration of UDCA increases the amount of non-toxic hydrophilic bile acids in the liver and functions as a choleretic agent, immunomodulatory, and protective agent for the hepatobiliary system [<a href=\"#r-7\">7</a>]. Although UDCA can protect the liver from damage caused by bile acids, several further studies on UDCA show that 35-40% of people with chronic liver disease do not respond to UDCA administration and have a poor prognosis [8,9]. Only a small number of patients (<10% of the total) have gallstone disease that can be treated with UDCA, and this therapy cannot prevent the recurrence of gallstones [<a href=\"#r-8\">8,9</a>]. Thus, further research is needed and encourages research to look for alternatives that can help increase the efficacy of UDCA.</p>\r\n\r\n<p><em>Allium sativum</em>, named garlic, has been used for a long time as a traditional medicine to reduce the risk of cardiovascular disease, aging, cancer, and diabetes. <em>A. sativum</em> has been shown to have an effect as a cytokine modulator, where its administration can inhibit the transcription factor NF-κB and proinflammatory cytokines such as TNF-α, transforming growth factor-beta 1 (TGF-β1), IL-1β, IL-6, monocyte chemoattractant protein-1 (MCP-1), matrix metallopeptidase 13 (MMP13) and IL-12 (p70) [<a href=\"#r-10\">10</a>]. <em>A. sativum</em> also has an antioxidant effect, obtained through the catalytic effect of hydroxyl radical compounds and hydrogen peroxide into non-oxidative compounds, and it can prevent microsomal lipid peroxidation. Research shows that <em>A. sativum</em> extract (ASE) can prevent liver fibrosis by reducing myofibroblasts through modulating HSC activation mechanisms, remodeling the extracellular matrix (ECM) by increasing its degradation, and regenerating liver tissue and function through the formation of hepatocytes [<a href=\"#r-11\">11</a>]. Considering the need for supplementation that can help to improve the hepatoprotective mechanism of UDCA, this study aimed to assess the combination of UDCA and ASE in preventing liver cirrhosis and decreasing albumin levels in cholestatic rats.</p>"
},
{
"section_number": 2,
"section_title": "MATERIALS AND METHODS",
"body": "<p><strong>Animal study</strong></p>\r\n\r\n<p>This study is approved for animal care, management, and experimental procedures by the Medical Research and Ethics Committee at Diponegoro University (109/EC-H/KEPK/FK-UNDIP/IX/2023). Thirty-six healthy male Sprague Dawley rats aged 2 months and weighing 150-200 g were included with no anatomical anomaly or damage to the liver. All of the rats were caged individually and acclimated for 7 days with a standard diet and drink. Surgery and intervention procedure allocation were assigned to each rat randomly using a randomized set of numbers. Cholestasis was induced using the bile duct ligation (BDL) technique involving a laparotomy procedure. 18 mg of cefotaxime (Indofarma, Jakarta, Indonesia) was given as a prophylaxis antibiotic, and 0.5 ml ketamine hydrochloride (Dexa Medica, Cikarang, Indonesia) as an anesthetic via intramuscular injections. Under sterile conditions, a midline laparotomy was performed, and the common bile duct was ligated with a 4-0 silk (DemeTECH, Miami Lakes, FL, USA). Sham-operated rats underwent the same surgical procedure except for BDL. Seven mg of oral Ibuprofen (Pharos, Semarang, Indonesia) was given every 8 h for 3 days to alleviate postoperative pain.</p>\r\n\r\n<p>The rats were randomly assigned into 6 groups including sham, BDL, BDL+UDCA, BDL+UDCA+3.6mg ASE, BDL+UDCA+7.2mg ASE, and BDL+UDCA+14.4mg ASE, with each group include 6 rats. Standard diet and drink were given by the same pattern. UDCA (Dexa Medica, Cikarang, Indonesia) powder was administered orally at a dose of 13.5 mg /day based on conversion from the therapeutic dose used in humans [<a href=\"#r-12\">12</a>]. ASE was extracted from garlic (Materia Medica, Batu, Indonesia) using the maceration method with 70% ethanol solution and administered orally based on the allocated treatment [<a href=\"#r-13\">13</a>].<sup> </sup>All treatments were given continuously by the laboratory caretaker for 21 days.</p>\r\n\r\n<p><strong> </strong></p>\r\n\r\n<p><strong>Biochemical and histopathological analysis</strong></p>\r\n\r\n<p>Blood from the orbital vein of research animals was taken to check albumin levels on the 22<sup>nd</sup> day. The rats were then euthanized using ketamine hydrochloride (Dexa Medica, Cikarang, Indonesia). The liver tissue was taken and soaked in 10% formalin. The paraffin blocks were cut and stained using Masson's trichrome (MT). MT staining is commonly used to examine the degree of liver cirrhosis because MT staining provides a better illustration of early or late-stage cirrhosis compared to Hematoxylin-Eosin (HE) staining. The degree of liver cirrhosis will be determined using Laennec's scoring system by an independent pathologist. This system divides the degree of fibrosis and cirrhosis into grade 0 (no fibrosis), grade 1 (minimal fibrosis), grade 2 (mild fibrosis), grade 3 (moderate fibrosis), grade 4A (cirrhosis, mild definite or probable), 4B (moderate cirrhosis), and 4C (severe cirrhosis).</p>\r\n\r\n<p> </p>\r\n\r\n<p><strong>Statistical analysis</strong></p>\r\n\r\n<p>Statistical analysis was performed using the IBM SPSS® 27.0 (New York, Manhattan). Data were expressed as means ± SD. The normality test was conducted using the Shapiro-Wilk test. Statistical comparisons were conducted using the Kruskal Wallis and Mann-Whitney test for cirrhosis degree analysis, while one-way ANOVA and Post Hoc were used for albumin level analysis. A Spearman’s correlation test was used to assess the correlation between the degree of cirrhosis and albumin level. A p-value of < 0.05 was considered significant.</p>"
},
{
"section_number": 3,
"section_title": "RESULTS",
"body": "<p>All rats (n = 36) received the allocated treatment completely until termination and were included in the final analysis. The subject’s pre- and post-intervention weight showed a comparable body weight between the groups.</p>\r\n\r\n<p><strong> </strong></p>\r\n\r\n<p><strong>Effect of UDCA and <em>A. sativum</em></strong><strong> extract on liver cirrhosis in cholestatic rats</strong></p>\r\n\r\n<p><a href=\"#Table-1\">Table 1</a> shows that the results among Sham, BDL, and BDL+UDCA groups were significantly different, indicating that the BDL procedure results in a higher degree of cirrhosis, and administering UDCA reduced the severity. The difference between the BDL and intervention groups was significant, suggesting that the combination of UDCA and ASE decreased the degree of cirrhosis. However, data found that the results among BDL+UDCA+3.6mg ASE, BDL+UDCA+7.2mg ASE, and BDL+UDCA+14.4mg ASE were not comparable, suggesting that the graded dose doesn’t have any significant effect on the degree of cirrhosis (<a href=\"#figure1\">Figure 1</a> and <a href=\"#Table-2\">Table 2</a>).</p>\r\n\r\n<div id=\"figure1\">\r\n<figure class=\"image\"><img alt=\"\" height=\"605\" src=\"/media/article_images/2025/35/30/178-1724280161-Figure1.jpg\" width=\"500\" />\r\n<figcaption><strong>Figure 1.</strong> Microscopic evaluation of liver cirrhosis degree with 40x magnification. A) grade 0 (no fibrosis); B) grade 1 (minimal fibrosis); C) grade 2 (mild fibrosis); D) grade 3 (moderate fibrosis); E) grade 4A (cirrhosis, mild definite or probable); F) 4B (moderate cirrhosis); The appearance of septa (arrowhead).</figcaption>\r\n</figure>\r\n\r\n<p> </p>\r\n</div>\r\n\r\n<p style=\"text-align:center\"><strong>Table 1. </strong>Degree of liver cirrhosis between groups using the Kruskal-Wallis test.</p>\r\n\r\n<div id=\"Table-1\">\r\n<p style=\"text-align:center\"><a href=\"https://jabet.bsmiab.org/table/178-1724280161-table1/\">Table-1</a></p>\r\n</div>\r\n\r\n<p><strong> </strong></p>\r\n\r\n<p style=\"text-align:center\"><strong>Table</strong><strong> 2</strong><strong>. </strong>Degree of liver cirrhosis using Mann Witney test.</p>\r\n\r\n<div id=\"Table-2\">\r\n<p style=\"text-align:center\"><a href=\"https://jabet.bsmiab.org/table/178-1724280161-table2/\">Table-2</a></p>\r\n</div>\r\n\r\n<p> </p>\r\n\r\n<p><strong>Effect of UDCA and A. sativum extract on albumin level in cholestatic rats</strong></p>\r\n\r\n<p>A comparison of albumin levels among the groups showed a significant difference, indicating that the BDL group had significantly decreased albumin levels and experienced higher liver injury. UDCA and ASE administration significantly improved the albumin levels in cholestatic rats, compared to administrating only UDCA (<a href=\"#figure2\">Figure 2</a>).</p>\r\n\r\n<div id=\"figure2\">\r\n<figure class=\"image\"><img alt=\"\" height=\"407\" src=\"/media/article_images/2025/35/30/178-1724280161-Figure2.jpg\" width=\"500\" />\r\n<figcaption><strong>Figure 2. </strong>Effect of UDCA and <em>A. sativum </em>extract on albumin level. Results are expressed as median, interquartile range, maximum, and minimum values. Designations: p < 0.05 vs * BDL; <sup>#</sup> BDL vs others.</figcaption>\r\n</figure>\r\n\r\n<p> </p>\r\n</div>\r\n\r\n<p><strong>Correlation between degree of liver cirrhosis and albumin level in cholestatic rats</strong></p>\r\n\r\n<p>The correlation of the degree of liver cirrhosis and albumin levels using Spearman's correlation test shows a p-value <0.001 and a correlation coefficient of -0.925, indicating that the degree of liver cirrhosis is correlated with albumin levels, with the direction and strength of the correlation being very strongly negative (<a href=\"#Table-3\">Table 3</a>).</p>\r\n\r\n<p style=\"text-align:center\"><strong>Table</strong><strong> 3</strong><strong>. </strong>Correlation between degree of liver cirrhosis and albumin level.</p>\r\n\r\n<div id=\"Table-3\">\r\n<p style=\"text-align:center\"><a href=\"https://jabet.bsmiab.org/table/178-1724280161-table3/\">Table-3</a></p>\r\n</div>"
},
{
"section_number": 4,
"section_title": "DISCUSSION",
"body": "<p>The administration of UDCA and ASE in this study proved to improve the degree of liver cirrhosis, as shown by the significant difference between the treatment and negative control groups. The combination also resulted in a better degree of liver cirrhosis than UDCA alone, indicating the beneficial role of combining ASE with UDCA. However, a comparison of the treatment groups showed that there were no significant differences between the 3 graded doses of ASE used, indicating that there was no dose-dependent effect of this combination on the degree of cirrhosis. The smallest dose of ASE at 3.6 mg produced similar levels of improvement in the degree of liver cirrhosis if compared with a larger dose.</p>\r\n\r\n<p>According to a study, ASE has an anti-fibrotic effect due to its antioxidant property, which was confirmed in liver cirrhosis induced by carbon tetrachloride (CCl4) [<a href=\"#r-14\">14</a>]. The mechanisms underlying liver cirrhosis focus on increased synthesis of the extracellular matrix or decreased degradation, where excessive deposition of this matrix will alter the structure and function of the organ [<a href=\"#r-14\">14</a>]. The organosulfur components of garlic are known to have chemical properties that work by competitive inhibition of tissue transglutaminase, hence the expression and transduction of enzyme genes involved in the progression of cirrhosis will be reduced [<a href=\"#r-15\">15</a>].<sup> </sup>Histopathology studies also confirmed that <em>A. sativum </em>has the ability to reduce myofibroblasts through modulation of HSC activation, initiate remodeling of the extracellular matrix through increased degradation, and enhance regeneration of liver tissue through the formation of hepatocytes [<a href=\"#r-16\">16</a>].</p>\r\n\r\n<p>Albumin level has previously been proven as a marker of liver damage. Analysis of the treatment group showed that administering graded doses of UDCA and ASE resulted in improved albumin levels, with the administration of ASE at a dose of 14.4 mg found to increase albumin levels to reach normal levels. This is in line with the finding of a hepatoprotective effect of ASE shown by the increased albumin levels in livers experiencing oxidative stress due to cisplatin [<a href=\"#r-17\">17</a>]. In addition, in vitro data indicated that this extract had strong antioxidant protection, which supports the notion that the ASE has a significant role in preventing liver damage [<a href=\"#r-18\">18</a>]. Panyod <em>et al.</em> confirmed that the use of allicin derived from ASE can reduce liver damage caused by alcoholic fatty liver disease in rat models. Activated Kupffer cells release reactive oxygen species (ROS) and pro-inflammatory cytokines such as TNF-α, IL-6, and IL-1β, which were reduced by ASE administration [<a href=\"#r-19\">19</a>].</p>\r\n\r\n<p>This research found a correlation between the degree of cirrhosis and albumin levels, where a lower degree of cirrhosis was correlated with higher albumin levels and vice versa. Albumin and bilirubin levels, as part of the albumin-bilirubin (ALBI) score, have been correlated with the degree of cirrhosis [<a href=\"#r-20\">20</a>]. The use of this score is based on the role of bilirubin and albumin as markers of liver function. In addition, among other markers from blood tests, albumin and platelets are the components that correlate most strongly with the degree of cirrhosis, where albumin levels will decrease as cirrhosis progresses [<a href=\"#r-21\">21</a>]. Thus, decreasing albumin levels are associated with increasing liver damage, characterized by increasingly advanced degrees of liver cirrhosis. Overall, UDCA and ASE significantly improved the degree of liver cirrhosis and albumin levels in cholestatic rats. The efficacy of UDCA and ASE increased using the greater dose of <em>A. sativum</em>. There is also a correlation between the decrease of cirrhosis degree with the increase of albumin levels in cholestatic rats.</p>\r\n\r\n<p>This study's advantages are assessing the success of choledochal duct ligation in inducing cholestasis and assessing the outcome of the intervention with direct visualization through histopathological examination of liver tissue biopsy samples. However, there are several limitations. This research was carried out in vivo using a test animal model, so there is a possibility that the results would have different effects if carried out on human subjects. This study only assessed the outcome of the intervention on day 22, so during the 21 days of intervention, there was no assessment of the progression of the therapeutic effects resulting from UDCA and ASE. We didn’t measure the laboratory markers of liver fibrosis and/or cirrhosis, hence further studies could evaluate the markers to help confirm the process. Finally, the current study didn’t conduct a phytochemical analysis to confirm the compositions of chemicals in the extract, with further studies needed to evaluate the components involved.</p>"
},
{
"section_number": 5,
"section_title": "ACKNOWLEDGMENTS",
"body": "<p>None.</p>"
},
{
"section_number": 6,
"section_title": "AUTHOR CONTRIBUTIONS",
"body": "<p>PA, NS, and SP conceptualized the study, performed the experiment, analyzed data, and interpreted the results. NM and TN contributed suggestions and checked the interpretation of the data. All authors reviewed and approved the final version of the manuscript.</p>"
},
{
"section_number": 7,
"section_title": "CONFLICTS OF INTEREST",
"body": "<p>There is no conflict of interest among the authors.</p>"
}
],
"figures": [
{
"figure": "https://jabet.bsmiab.org/media/article_images/2025/35/30/178-1724280161-Figure1.jpg",
"caption": "Figure 1. Microscopic evaluation of liver cirrhosis degree with 40x magnification. A) grade 0 (no fibrosis); B) grade 1 (minimal fibrosis); C) grade 2 (mild fibrosis); D) grade 3 (moderate fibrosis); E) grade 4A (cirrhosis, mild definite or probable); F) 4B (moderate cirrhosis); The appearance of septa (arrowhead).",
"featured": true
},
{
"figure": "https://jabet.bsmiab.org/media/article_images/2025/35/30/178-1724280161-Figure2.jpg",
"caption": "Figure 2. Effect of UDCA and A. sativum extract on albumin level. Results are expressed as median, interquartile range, maximum, and minimum values. Designations: p < 0.05 vs * BDL; # BDL vs others.",
"featured": false
}
],
"authors": [
{
"id": 1616,
"affiliation": [
{
"affiliation": "Biomedical Science Postgraduate Program, Faculty of Medicine, Diponegoro University, Semarang, Indonesia"
}
],
"first_name": "Pratama Nurmalik",
"family_name": "Adhuri",
"email": "pratama.adhuri@gmail.com",
"author_order": 1,
"ORCID": null,
"corresponding": true,
"co_first_author": false,
"co_author": false,
"corresponding_author_info": "Pratama Nurmalik Adhuri, Biomedical Science Postgraduate Program, Faculty of Medicine, Diponegoro University, Semarang, Indonesia. Email: pratama.adhuri@gmail.com",
"article": 324
},
{
"id": 1617,
"affiliation": [
{
"affiliation": "Department of Histology, Faculty of Medicine, Diponegoro University, Semarang, Indonesia"
}
],
"first_name": "Neni",
"family_name": "Susilaningsih",
"email": null,
"author_order": 2,
"ORCID": null,
"corresponding": false,
"co_first_author": false,
"co_author": false,
"corresponding_author_info": "",
"article": 324
},
{
"id": 1618,
"affiliation": [
{
"affiliation": "Department of Digestive Surgery, Faculty of Medicine, Diponegoro University, Semarang, Indonesia"
}
],
"first_name": "Sigit Adi",
"family_name": "Prasetyo",
"email": null,
"author_order": 3,
"ORCID": null,
"corresponding": false,
"co_first_author": false,
"co_author": false,
"corresponding_author_info": "",
"article": 324
},
{
"id": 1619,
"affiliation": [
{
"affiliation": "Department of Pharmacology, Faculty of Medicine, Diponegoro University, Semarang, Indonesia"
}
],
"first_name": "Nani",
"family_name": "Maharani",
"email": null,
"author_order": 4,
"ORCID": null,
"corresponding": false,
"co_first_author": false,
"co_author": false,
"corresponding_author_info": "",
"article": 324
},
{
"id": 1620,
"affiliation": [
{
"affiliation": "Department of Pharmacology, Faculty of Medicine, Diponegoro University, Semarang, Indonesia"
}
],
"first_name": "Trilaksana",
"family_name": "Nugroho",
"email": null,
"author_order": 5,
"ORCID": null,
"corresponding": false,
"co_first_author": false,
"co_author": false,
"corresponding_author_info": "",
"article": 324
}
],
"views": 505,
"downloads": 82,
"references": [
{
"id": 13482,
"serial_number": 1,
"pmc": null,
"reference": "Chen H, Ling W, et al. Jaundice revisited: recent advances in the diagnosis and treatment of inherited cholestatic liver diseases. J Biomed Sci. 2018;25:75.",
"DOI": null,
"article": 324
},
{
"id": 13483,
"serial_number": 2,
"pmc": null,
"reference": "Zhou WC, Zhang QB, et al. Pathogenesis of liver cirrhosis. World J Gastroenterol. 2014;20:7312–24.",
"DOI": null,
"article": 324
},
{
"id": 13484,
"serial_number": 3,
"pmc": null,
"reference": "Weiskirchen R, Tacke F. Cellular and molecular functions of hepatic stellate cells in inflammatory responses and liver immunology. Hepatobiliary Surg Nutr. 2014;3:344–63.",
"DOI": null,
"article": 324
},
{
"id": 13485,
"serial_number": 4,
"pmc": null,
"reference": "Puche JE, Saiman Y, et al. Hepatic stellate cells and liver fibrosis. Compr Physiol. 2013;3:1473–92.",
"DOI": null,
"article": 324
},
{
"id": 13486,
"serial_number": 5,
"pmc": null,
"reference": "Soeters PB, Wolfe RR, et al. Hypoalbuminemia: Pathogenesis and Clinical Significance. J Parenter Enter Nutr. 2019;43:181–93.",
"DOI": null,
"article": 324
},
{
"id": 13487,
"serial_number": 6,
"pmc": null,
"reference": "Carvalho JR, Machado VM. New Insights About Albumin and Liver Disease. Ann Hepatol. 2018;17:547-560.",
"DOI": null,
"article": 324
},
{
"id": 13488,
"serial_number": 7,
"pmc": null,
"reference": "Onofrio FQ, Hirschfield GM. The Pathophysiology of Cholestasis and Its Relevance to Clinical Practice. Clin Liver Dis. 2020;15:110–4.",
"DOI": null,
"article": 324
},
{
"id": 13489,
"serial_number": 8,
"pmc": null,
"reference": "Tsochatzis EA, Feudjo M, et al. Ursodeoxycholic acid improves bilirubin but not albumin in primary biliary cirrhosis: Further evidence for nonefficacy. Biomed Res Int. 2013;2013.",
"DOI": null,
"article": 324
},
{
"id": 13490,
"serial_number": 9,
"pmc": null,
"reference": "Guarino MPL, Cocca S, et al. Ursodeoxycholic acid therapy in gallbladder disease, a story not yet completed. World J Gastroenterol. 2013;19:5029–34.",
"DOI": null,
"article": 324
},
{
"id": 13491,
"serial_number": 10,
"pmc": null,
"reference": "You S, Nakanishi E, et al. Inhibitory effects and molecular mechanisms of garlic organosulfur compounds on the production of inflammatory mediators. Mol Nutr Food Res. 2013;57:2049–60.",
"DOI": null,
"article": 324
},
{
"id": 13492,
"serial_number": 11,
"pmc": null,
"reference": "D'Argenio G, Amoruso DC, et al. Garlic extract prevents CCl(4)-induced liver fibrosis in rats: The role of tissue transglutaminase. Dig Liver Dis. 2010;42:571-7.",
"DOI": null,
"article": 324
},
{
"id": 13493,
"serial_number": 12,
"pmc": null,
"reference": "Razori MV, Maidagan PM, et al. Anticholestatic mechanisms of ursodeoxycholic acid in lipopolysaccharide-induced cholestasis. Biochem Pharmacol. 2019;168:48-56.",
"DOI": null,
"article": 324
},
{
"id": 13494,
"serial_number": 13,
"pmc": null,
"reference": "Abubakar AR, Haque M. Preparation of Medicinal Plants: Basic Extraction and Fractionation Procedures for Experimental Purposes. J Pharm Bioallied Sci. 2020;12:1-10.",
"DOI": null,
"article": 324
},
{
"id": 13495,
"serial_number": 14,
"pmc": null,
"reference": "Qiu JF, Zhang ZQ, et al. Cystamine ameliorates liver fibrosis induced by carbon tetrachloride via inhibition of tissue transglutaminase. World J Gastroenterol. 2007;13:4328-32.",
"DOI": null,
"article": 324
},
{
"id": 13496,
"serial_number": 15,
"pmc": null,
"reference": "Ansary J, Forbes-Hernández TY, et al. Potential Health Benefit of Garlic Based on Human Intervention Studies: A Brief Overview. Antioxidants (Basel). 2020;9:619.",
"DOI": null,
"article": 324
},
{
"id": 13497,
"serial_number": 16,
"pmc": null,
"reference": "D'Argenio G, Mazzone G, et al. Garlic extract attenuating rat liver fibrosis by inhibiting TGF-β1. Clin Nutr. 2013;32:252-8.",
"DOI": null,
"article": 324
},
{
"id": 13498,
"serial_number": 17,
"pmc": null,
"reference": "Nasr AY. Protective effect of aged garlic extract against the oxidative stress induced by cisplatin on blood cells parameters and hepatic antioxidant enzymes in rats. Toxicol Rep. 2014;16:682-691.",
"DOI": null,
"article": 324
},
{
"id": 13499,
"serial_number": 18,
"pmc": null,
"reference": "Almatroodi SA, Anwar S, et al. Hepatoprotective Effects of Garlic Extract against Carbon Tetrachloride (CCl 4)-Induced Liver Injury via Modulation of Antioxidant, Anti-Inflammatory Activities and Hepatocyte Architecture. Applied Sciences. 2020;10:1-22.",
"DOI": null,
"article": 324
},
{
"id": 13500,
"serial_number": 19,
"pmc": null,
"reference": "Panyod S, Wu WK, et al. Diet Supplementation with Allicin Protects against Alcoholic Fatty Liver Disease in Mice by Improving Anti-inflammation and Antioxidative Functions. J Agric Food Chem. 2016;64:7104-7113.",
"DOI": null,
"article": 324
},
{
"id": 13501,
"serial_number": 20,
"pmc": null,
"reference": "Fujita K, Oura K, et al. Albumin-bilirubin score indicates liver fibrosis staging and prognosis in patients with chronic hepatitis C. Hepatol Res. 2019;49:731-742.",
"DOI": null,
"article": 324
},
{
"id": 13502,
"serial_number": 21,
"pmc": null,
"reference": "Fujita K, Yamasaki K, et al. Albumin platelet product as a novel score for liver fibrosis stage and prognosis. Sci Rep. 2021;11:5345.",
"DOI": null,
"article": 324
}
]
},
{
"id": 323,
"slug": "178-1725288444-role-of-cd117-and-mast-cells-in-periodontal-diseases-histological-and-immunohistochemical-study",
"featured": false,
"slider": false,
"issue": "Vol8 Issue1",
"type": "original_article",
"manuscript_id": "178-1725288444",
"recieved": "2024-09-02",
"revised": null,
"accepted": "2025-01-08",
"published": "2025-01-27",
"pdf_file": "https://jabet.bsmiab.org/media/pdf_file/2025/46/178-1725288444.pdf",
"title": "Role of CD117 and mast cells in periodontal diseases: Histological and immunohistochemical study",
"abstract": "<p>Mast cells are mobile secretory cells with a variety of biological tasks such as phagocytosis, processing of antigens, cytokine production, and the release of both newly formed and preexisting physiological mediators. This study aimed to investigate and establish the relationship between mast cells and various stages of periodontal diseases. A total of 36 soft tissue samples, 12 each of normal healthy periodontal, dental plaque periodontitis, and chronic periodontitis were selected. Samples were collected from patients with periodontal surgery in chronic periodontitis and plaque periodontitis. Samples were stained with 1% toluidine blue (TB), immunohistochemistry for CD117 expression, and observed under a light microscope for the presence of mast cells. All data were analyzed using SPSS. The mast cells were found to be highest in the chronic periodontitis group, followed by the dental plaque periodontitis group, as compared to the healthy periodontal group. The quantitative study of mast cells using TB staining showed statistically significant differences among the three groups. However, the results showed no statistically significant difference in the expression levels of CD117 in the plaque periodontitis and healthy periodontal group but showed a statistically significant difference between chronic periodontitis and healthy periodontal group. Thus, an increase in mast cells in human periodontal diseases suggests that these cells are crucial for developing chronic periodontitis.<strong> </strong></p>",
"journal_reference": "J Adv Biotechnol Exp Ther. 2025; 8(1): 182-191",
"academic_editor": "Md. Abdul Hannan, PhD; Bangladesh Agricultural University, Bangladesh",
"cite_info": "Khaphi FL, Hussein HA, et al. Role of CD117 and mast cells in periodontal diseases: Histological and immunohistochemical study. J Adv Biotechnol Exp Ther. 2025; 8(1): 182-191.",
"keywords": [
"Mast cells",
"Chronic periodontitis",
"CD117",
"Plaque periodontitis"
],
"DOI": "10.5455/jabet.2025.15",
"sections": [
{
"section_number": 1,
"section_title": "INTRODUCTION",
"body": "<p>Periodontitis is one of the most common chronic gum diseases, caused by bacterial infection and irritation of the supporting structures and tissues around the teeth [<a href=\"#r-1\">1</a>]. The symptoms of this disease include the gradual accumulation of dental plaque, which triggers an immune response and, ultimately, results in the destruction of the gums and the supporting bone tissues that hold the tooth. Halitosis is a symptom of periodontitis, which can also lead to other symptoms such as gum recession, bleeding gums, loss or shifting teeth, and, eventually dental loss [<a href=\"#r-1\">1</a>]. Inflammatory periodontal disease has been linked primarily to bacterial plaque as the etiological factor. However, in recent years, several studies have highlighted the function of the immune system, suggesting that bacterial antigens set off an immunopathological reaction and that the final course of the disease process depends on the host's response [<a href=\"#r-2\">2, 3</a>].</p>\r\n\r\n<p>In varying amounts, mast cells can be found in the periodontal tissues in healthy and inflamed gingival sites. When these cells are stimulated or active, mediators produced from mast cells are released through degranulation from the secretory granules [<a href=\"#r-4\">4</a>]. Mast cells originating in the bone marrow are immune cells residing in various tissues. They are characterized by their large, coarse, spherical appearance, prominent nuclei, and different cellular components like microvilli and ribosomes [<a href=\"#r-5\">5</a>]. Mast cells are involved in several processes, including host defense, tissue damage healing, allergic inflammation, and vascular regulation. In addition, controlling mast cell activity is essential for the treatment of many inflammatory diseases because of their substantial role in tissue damage and the spread of inflammatory responses [<a href=\"#r-6\">6</a>]. A variety of inflammatory cytokines secreted by mast cells can be detrimental to periodontal tissue. Mast cells have been linked to periodontal disease in numerous studies [<a href=\"#r-5\">5</a>]. Mediators are kept in secretory granules found in mast cells. As mast cells degranulate, mediators will be released. The periodontal tissue is destroyed as a result of these mediators. The results of a study indicate a connection between the severity of periodontal disease and the extent of mast cell degranulation [<a href=\"#r-6\">6</a>, <a href=\"#r-7\">7</a>].</p>\r\n\r\n<p>CD117 is a tyrosine kinase protein type‑3 (c‑kit) that functions as a receptor for the SCF (stem cell factor), which binds to the SCF to control cell proliferation, differentiation, chemotaxis, and apoptosis [<a href=\"#r-8\">8</a>]. Immunoglobulin E (IgE) has a high-affinity receptor called FcεRI. This receptor is crucial for the degranulation of mast cells. When SCF binds to the CD117 receptor, it increases FcεRI collection on the surface of the mast cells, which causes the mast cells to degranulation [<a href=\"#r-9\">9</a>]. CD117 can be beneficial for the identification of normal and tumor mast cells. Both normal mast cells and mast cell malignancies express CD117, and both have notable levels of CD117 expression [<a href=\"#r-10\">10</a>]. Fukuda <em>et al.</em> [<a href=\"#r-11\">11</a>] noted that humoral and natural mast cells expressed CD117. Therefore, this study aimed to quantify mast cells in healthy and periodontic groups and determine the correlation between these groups. Also, this study measures the CD117 expression level in the mast cells present in periodontal diseases.</p>"
},
{
"section_number": 2,
"section_title": "MATERIALS AND METHODS",
"body": "<p><strong>Study design</strong></p>\r\n\r\n<p>This study was performed in the Department of Periodontics in Dentistry College, University of Basrah, Iraq. The patients included in this study had no disease history, had not taken any drugs that would have affected periodontal tissues in the preceding two months, were not smokers, and did not have any special hormonal situations, such as pregnancy. Written informed consent was obtained, and the patient was informed of the treatment protocol before treatment implementation. The Institutional Ethical Committee Review Board in Dentistry College, University of Basrah, granted ethical approval (Ref.no BDC-1-02-23-9-1).</p>\r\n\r\n<p><strong> </strong></p>\r\n\r\n<p><strong>Sample collection and preparation of periodontal tissues</strong></p>\r\n\r\n<p>In this study, 36 cases were reported, including 12 instances of dental plaque periodontitis, 12 instances of progressive loss of periodontium in Chronic Periodontitis, and 12 cases of the clinically healthy periodontal group as a control. The classification rules for periodontal diseases and disorders set by the American Academy of Periodontology were followed [<a href=\"#r-12\">12</a>].</p>\r\n\r\n<p>Twelve periodontal healthy tissue samples were obtained from the extraction of teeth, usually premolars, for orthodontic therapy with no BOP (bleeding on probing). Twelve tissues with plaque periodontitis (PD (probing depth) < 3 mm and CAL (clinical attachment loss) < 1 mm with BOP). Twelve tissue samples with moderate-to-advanced chronic periodontitis (using BOP to PD and CAL more than 4 mm) as shown in <a href=\"#figure1\">Figure 1</a>.</p>\r\n\r\n<p>The tissue sample was collected from patients with periodontal surgery in a minor surgical operating room returning to the surgery unit. Some of the samples were taken from patients who required periodontal surgery as part of their periodontal treatment to remove the operculum over the third molar. Other patients donated a small piece of tissue after extraction. The surgery was performed by a single periodontist using an identical technique. Informed consent was obtained from the patients for the collection, preservation, and analysis of gingival tissues for the present study.</p>\r\n\r\n<div id=\"figure1\">\r\n<figure class=\"image\"><img alt=\"\" height=\"161\" src=\"/media/article_images/2025/32/30/178-1725288444-Figure1.jpg\" width=\"500\" />\r\n<figcaption><strong>Figure 1. </strong>Images of clinical cases (A) healthy periodontal group, (B) plaque periodontitis, and (C) chronic periodontitis group.Caption</figcaption>\r\n</figure>\r\n\r\n<p> </p>\r\n</div>\r\n\r\n<p><strong>Biopsies</strong></p>\r\n\r\n<p>Biopsies were obtained using a scalpel blade number 11 for excisional biopsy and were approximately 3x2 mm in size, taken from appropriate sites immediately after diagnosis. The specimens were promptly fixed in formalin (10%, Sigma–Aldrich Chemicals, St Louis, MO, USA) for further processing, followed by dehydration, clearing, and embedding in paraffin (Sigma–Aldrich Chemicals, St Louis, MO, USA) as described previously [<a href=\"#r-4\">4</a>].</p>\r\n\r\n<p><strong> </strong></p>\r\n\r\n<p><strong>Histological and staining procedure</strong></p>\r\n\r\n<p>Following standard tissue preparation, 5 μm thick tissue slices were acquired, deparaffinized, and rehydrated in distilled water (D.W.) before being stained with 1% Toluidine Blue (TB, Sigma–Aldrich Chemicals, St Louis, MO, USA) stain following the manufacturer's instructions. After carefully blotting the sections, they were dehydrated using progressively higher grades of ethanol, absolute alcohol, and xylene (Sigma–Aldrich Chemicals, St Louis, MO, USA). They were then mounted in DPX (Dibutylphthalate Polystyrene Xylene, Sigma–Aldrich Chemicals, St Louis, MO, USA) and examined under a light microscope. Mast cells were recognized by deep blue-purple staining [<a href=\"#r-13\">13</a>].</p>\r\n\r\n<p><strong> </strong></p>\r\n\r\n<p><strong>Quantitative analysis of mast cell using TB staining</strong></p>\r\n\r\n<p>The number of mast cells (positively stained) was counted in 10 successive high-power (objective ×64; tube factor ×1; eyepiece ×12.5; ×800) microscopic fields. It has been done to count the mast cells in the inflammatory cell infiltration of periodontally healthy tissue areas and diseased tissue. The mean ± SD of mast cell observations stained with TB was presented per millimeter. Additionally, a comparison of the number of mast cells/mm<sup>2</sup> in the groups with healthy and diseased periodontal tissues was done. After that, the mean value of mast cells was expressed. Data were statistically analyzed using SPSS (Statistical-Package for the Social-Sciences, version 18) for an ANOVA and a Student's t-test. <em>P</em> values below 0.05 were regarded as statistically significant.</p>\r\n\r\n<p> </p>\r\n\r\n<p><strong>Immunohistochemistry staining </strong></p>\r\n\r\n<p>The samples (gingival tissue) were initially sliced into 3 μm sections and prepared for Immunohistochemistry (IHC) staining. Following this, the tissues were deparaffinized in xylene and then hydrated with alcohol (80%, 90%, and 100%) for 30 min. The retrieval stage was carried out with a Tris-buffered saline (TBS, Sigma–Aldrich Chemicals, St Louis, MO, USA) solution (pH = 7.6). Next, running water was used to indirectly cool the jar that held the samples. After treating the microscopic slide with 10% H<sub>2</sub>O<sub>2</sub> (Junsei Chemical Co. Ltd., Tokyo, Japan) for 10 min, it was rinsed for 5 min under running water. Following this, the slide was incubated with blocking serum for 5 min and then shaken to remove excess serum. The first antibody, CD117 (Bio Genex, The Hague, the Netherlands), was applied for 50 min, and then the slide was rinsed with a TBS solution. Subsequently, a secondary antibody was used for 1 h, followed by another rinse with a TBS solution. Finally, the slide was treated with diammonium phosphate solution for 10 min and then washed with D.W. After using hematoxylin (Sisco Research Laboratories Pvt. Ltd., India) for 5 min, D.W. was utilized once again to wash. The slide was submerged in xylol for 2 min after being submerged in alcohol 100 for 1 min. Finally, a cytologic adhesive was used to mount the slides. To guarantee stain accuracy, positive control samples, such as tissue blocks from the stomach, were also supplied.</p>\r\n\r\n<p>After labeling with IHC, we counted the number of mast cells in 10 high-power fields at the highest density area (hot spot) using a Nikon optical microscope (Tokyo, Japan) at ×400 magnification. We determined the mast cell count for each field. We then selected the ten fields with the highest concentration of mast cells and noted the average mast cell count for each group.</p>\r\n\r\n<p><strong> </strong></p>\r\n\r\n<p><strong>Statistical analysis</strong></p>\r\n\r\n<p>Data statistical analysis was done using SPSS. The independent t-test was employed to compare the expression level of CD117 between the three study groups, taking into account the normal distribution of scores and percentages. It was determined that the obtained <em>P</em> < 0.05 was statistically significant.</p>"
},
{
"section_number": 3,
"section_title": "RESULTS",
"body": "<p><strong>Quantitative analysis and statistical evaluation of mast cells stained with TB</strong></p>\r\n\r\n<p>The presence of mast cells was observed in all study groups, including the healthy periodontal group, plaque periodontitis group, and chronic periodontitis group. Mast cells were quantitatively analyzed by counting their total number, and a qualitative analysis was conducted by counting the intact and degranulated mast cells in TB-stained sections. The mean total of mast cells (<a href=\"#table-1\">Table 1</a>) compared the mast cell quantification values between the periodontitis and periodontal health groups (<a href=\"#figure2\">Figure 2</a>A). The mean mast cell value was found to be 2.450 ± 0.375, 5.97 ± 0.499, and 11.35 ± 0.403 mast cells/ mm<sup>2</sup> in the healthy periodontal group, plaque periodontitis, and chronic periodontitis group, respectively. At <em>P</em> ≤ 0.05, there is a statistically significant difference among the healthy periodontal, plaque periodontitis, and chronic periodontitis groups. This result indicated a slightly significant difference between the plaque periodontitis group and the periodontally healthy group, but there is a highly significant difference between the healthy and chronic periodontitis groups.</p>\r\n\r\n<p>The tissue sections were stained with TB to identify mast cells. The mast cells appeared granular and deep blue-purple against a blue ortho-chromatic background (<a href=\"#figure3\">Figure 3</a>A-C). In the healthy periodontal group, only a few mast cells with undegranulation were observed (<a href=\"#figure3\">Figure 3</a>A). In the plaque periodontitis group, more mast cells with degranulation were observed (<a href=\"#figure3\">Figure 3</a>B). In the chronic periodontitis group, numerous mast cells with significant degranulation were observed (<a href=\"#figure3\">Figure 3</a>C).</p>\r\n\r\n<div id=\"figure2\">\r\n<figure class=\"image\"><img alt=\"\" height=\"183\" src=\"/media/article_images/2025/32/30/178-1725288444-Figure2.jpg\" width=\"500\" />\r\n<figcaption><strong>Figure 2. </strong>(A) Comparison of mean mast cell quantification among the study groups; and (B) The level of CD 117 expression among the study groups.</figcaption>\r\n</figure>\r\n\r\n<p> </p>\r\n</div>\r\n\r\n<div id=\"figure3\">\r\n<figure class=\"image\"><img alt=\"\" height=\"353\" src=\"/media/article_images/2025/32/30/178-1725288444-Figure3.jpg\" width=\"500\" />\r\n<figcaption><strong>Figure 3. </strong>Histological section of mast cells in: (A) healthy periodontal group, (B) plaque periodontitis group, and (C) chronic periodontitis group. TB stain, X 400.</figcaption>\r\n</figure>\r\n\r\n<p> </p>\r\n</div>\r\n\r\n<p style=\"text-align:center\"><strong>Table 1. </strong>Mean total number of mast cells among study groups.</p>\r\n\r\n<div id=\"Table-1\">\r\n<p style=\"text-align:center\"><a href=\"https://jabet.bsmiab.org/table/178-1725288444-table1/\">Table 1</a></p>\r\n</div>\r\n\r\n<p> </p>\r\n\r\n<p><strong>IHC outcomes </strong></p>\r\n\r\n<p>The average number of mast cells in each study group was recorded after counting the mast cells in each field and selecting the highest count of mast cells (<a href=\"#figure4\">Figure 4</a>A-C). The immuno-reactivity of the CD117 in mast cells in periapical granulomas and periapical cysts. The mean CD117 expression level in the healthy, plaque periodontitis and chronic periodontitis was 11.35± 0.430, 11.36± 0.462, and 16.33±0.353 mast cells/mm<sup>2</sup>, respectively (<a href=\"#Table-2\">Table 2</a> and <a href=\"#figure2\">Figure 2</a>B). The results showed a statistically significant difference between healthy and chronic periodontitis groups, with no statistically significant difference between healthy and plaque periodontitis groups at <em>P</em> < 0.05.</p>\r\n\r\n<div id=\"figure4\">\r\n<figure class=\"image\"><img alt=\"\" height=\"347\" src=\"/media/article_images/2025/32/30/178-1725288444-Figure4.jpg\" width=\"500\" />\r\n<figcaption><strong>Figure 4. </strong>The mast cells contained in: (A) healthy periodontal group, (B) plaque periodontitis group, and (C) chronic periodontitis group (IHC, X400).</figcaption>\r\n</figure>\r\n\r\n<p><strong><img alt=\"\" src=\"figure4\" /></strong></p>\r\n</div>\r\n\r\n<p style=\"text-align:center\"><strong>Table 2. </strong>CD117 expression levels in the healthy periodontal group, plaque periodontitis, and chronic periodontitis.</p>\r\n\r\n<div id=\"Table-2\">\r\n<p style=\"text-align:center\"><a href=\"https://jabet.bsmiab.org/table/178-1725288444-table2/\">Table 2</a></p>\r\n</div>"
},
{
"section_number": 4,
"section_title": "DISCUSSION",
"body": "<p>Gingival tissue has the highest number of mast cells; their density does not seem to be influenced by systemic drugs (antivirals). However, it is sensitive to physical factors such as metal ions or laser radiation (low-intensity) [<a href=\"#r-14\">14</a>, <a href=\"#r-15\">15</a>]. Thus, mast cells are adaptable, adjusting their functions based on the surrounding micro-environment instead of systemic pharmacological treatments [<a href=\"#r-16\">16</a>]. After partially differentiating in the bone marrow from pluripotent hematopoietic cells, they travel through the bloodstream to complete their differentiation in specific microenvironments within peripheral mucosal or connective tissues [<a href=\"#r-14\">14, 15</a>]. Mast cells are dispersed sub- and intraepithelial, as well as throughout the gingival connective tissue, frequently close to endothelial cells. Mast cells are seen in greater quantity in gingiva which is both inflammatory and healing [<a href=\"#r-17\">17</a>]. Mast cells can be thin and elongated like fibroblasts, or they can be round, oval, or spindle-shaped with plenty of cytoplasm. The nuclei of mast cells are spherical to oval in shape, and the cytoplasm is heavily packed with granules that are bright red. They can be stained using either TB dye or Giemsa stain. Each mast cell typically contains between 80 and 300 granules, densely packed with biologically active mediators such as proteases, histamine, growth factors, and cytokines [<a href=\"#r-18\">18</a>].</p>\r\n\r\n<p>Mast cells may undergo explosive de-granulation and then reassemble their granules, or they may release individual granules when activated in a process called 'piecemeal degranulation [<a href=\"#r-12\">12</a>, <a href=\"#r-18\">18</a>]. After the process of degranulation, large numbers of mast cell mediators are released into the extracellular environment, affecting the endothelial cells [<a href=\"#r-19\">19</a>, <a href=\"#r-20\">20</a>]. In this study, we found the possibility of rapidly increased numbers of mast cells at sites of tissues with chronic periodontal infections, indicating high cellular activity at these sites. This finding agreed with studies reported by Lagdive <em>et al.</em> [<a href=\"#r-4\">4</a>], Agrawal <em>et al.</em> [<a href=\"#r-21\">21</a>], Fattahi <em>et al.</em> [<a href=\"#r-22\">22</a>], and Batista <em>et al. </em>[<a href=\"#r-23\">23</a>]. Additionally, a slightly significant increase in plaque periodontitis tissue compared to the healthy periodontal group may be attributed to either a higher rate of degranulation or migration of mast cells [<a href=\"#r-24\">24</a>]. Migratory potential is directly related to the mast cell growth factor. This factor is not modified by degranulation of the mast cell, and this explains the accumulation of large numbers of mast cells close to or in the epithelial tissue in inflamed conditions as reported by Walsh <em>et al.</em> [<a href=\"#r-25\">25</a>] and Korkmaz <em>et al.</em> [<a href=\"#r-26\">26</a>]. The findings of this study indicate that mast cell counts might be linked to periodontitis. Numerous authors have demonstrated that periodontitis causes an increase in mast cell density [<a href=\"#r-27\">27</a>], while others reported that periodontal inflammation causes a decrease in mast cell density [<a href=\"#r-28\">28</a>]. These conflicting findings may be attributed to the dynamic nature of the periodontal disease, characterized by varying growth and activity stages, or due to various levels of inflammation in the analyzed specimens. However, mast cells contribute to inflammation and host defense in gingival tissues, regardless of mast cell density in periodontitis [<a href=\"#r-7\">7</a>]. This discovery serves as our basis for demonstrating the involvement of mast cells in the chronic breakdown of periodontal tissue. There are reinforcing factors, and histamine is one of them; it is a biological and biochemical factor that works on the tissue barrier, deteriorates it, brings about edema, and aids cellular infiltration [<a href=\"#r-29\">29</a>]. Furthermore, mast cells are acknowledged to comprise the majority of the body's histamine. In addition, mast cells express the strongest levels of matrix metalloproteinases (MMPs) 1, 2, 8, 9, and 13. MMPs play a crucial role in degrading the main components in the extracellular matrix [<a href=\"#r-30\">30-32</a>]. Future research should concentrate on the regulatory mechanisms that influence mast cell behavior in gingival tissues, including their interactions with physical and chemical stimuli, to clarify their potential as therapeutic targets in managing periodontal disease.</p>\r\n\r\n<p>Latent collagenase can partake in tissue destruction in periodontitis, which can be activated by tryptase besides that tryptase can break down the third component of collagen. Furthermore, it has been indicated that tryptase activity is confined to mast cell granules. Mast cells appear to be competent in introducing antigens to T cells. The activation of T-cells leads to activating mast cells through cytokine release and degranulation [<a href=\"#r-33\">33</a>]. This study established that the number of mast cells will be increased in inflamed areas as compared to healthy periodontal. This suggests significant changes in the localization and migration of mast cells during the development of periodontal disease, which may need to be more strictly considered [<a href=\"#r-28\">28</a>]. However, still up for debate whether mast cells have a role in the destructive events and defensive mechanism as responder and effector cells in severe inflammation, or as potential functional populations in periodontal lesions [<a href=\"#r-17\">17</a>].</p>\r\n\r\n<p>For CD117 marker expression levels in the mast cells, the results showed study no significant variance between the healthy and the plaque periodontitis with a significant variance between the healthy and chronic periodontitis groups. This is incompatible with the results of the study by Gemmell <em>et al.</em> [<a href=\"#r-34\">34</a>], Mazreah <em>et al.</em> [<a href=\"#r-10\">10</a>], Vahabi <em>et al.</em> [<a href=\"#r-35\">35</a>], and Huang <em>et al.</em> [7]. There are contradictory findings in other studies for example, some studies have found that mast cells play a key role in the development of periodontitis, and other studies have shown no significant difference between chronic periodontitis and healthy periodontitis [<a href=\"#r-30\">30</a>, <a href=\"#r-32\">32</a>]. This finding may be attributed to variations in tissue processing, sample handling, methodological approaches, and population heterogeneity. Additionally, hypoxic stress and cytokine profiles (IL-1 and TNF-α) play a crucial role in modulating mast cell behavior, especially the expression of CD117 levels. Consequently, mast cells interact with other immune and stromal cells, adapting their functions to the local tissue environment and affecting on expression level of CD117 in chronic periodontitis [<a href=\"#r-36\">36</a>]. These findings highlight the need for further research to clarify the regulatory mechanisms underlying CD117 expression in chronic periodontitis. Such studies could enhance our understanding of its role in disease pathogenesis and its potential as a therapeutic target. Researching biologics or pharmacological agents that can modulate mast cell activity is necessary, especially those targeting CD117 or other mast cell receptors that help regulate their proliferation and activation.</p>\r\n\r\n<p>Malcolm <em>et al.</em> [<a href=\"#r-37\">37</a>] found a direct link between the decline in periodontal tissue deterioration and the decrease in mast cell count. Additionally, Agrawal <em>et al.</em> [<a href=\"#r-21\">21</a>] investigated the correlation between the various stages of periodontal disease and the presence of mast cells. This suggests the role of these cells in the development and degradation of periodontal disease. However, further research with larger sample sizes and novel techniques is required to find suitable therapies to overcome the development of periodontal disease, understand its mechanism, and its correlation with mast cells. Moreover, the current study encountered challenges in selecting the most effective method for counting mast cells and securing a substantial number of samples and difficulty in encouraging non-cooperative patients to participate.</p>"
},
{
"section_number": 5,
"section_title": "CONCLUSIONS",
"body": "<p>The study confirmed the correlation between the presence of a high number of mast cells with periodontal disease compared to the healthy periodontal group. Chronic periodontitis sites showed increased mast cell numbers compared to healthy and plaque periodontitis sites. The results also suggest a significant variance in the expression level of CD117 between the healthy and chronic periodontitis groups with no significant variance between healthy and plaque periodontitis. Further research is required to better understand the immunological dynamics and cellular interactions of the disease to provide a better understanding of how periodontitis develops and potential treatment approaches. To obtain more definitive and trustworthy results, cell DNA analysis and assessment of particular mediators released from mast cells should be carried out in further research.</p>"
},
{
"section_number": 6,
"section_title": "ACKNOWLEDGMENTS",
"body": "<p>Not applicable.</p>"
},
{
"section_number": 7,
"section_title": "AUTHOR CONTRIBUTIONS",
"body": "<p>FLK and HAH designed the outlines, drafted the manuscript, and wrote the initial draft of the manuscript. OFH and FLK performed the experiments and analyzed the data. HJJ and ZKS reviewed the manuscript. All authors read and approved the final version of the manuscript.</p>"
},
{
"section_number": 8,
"section_title": "CONFLICTS OF INTEREST",
"body": "<p>There is no conflict of interest among the authors.</p>"
}
],
"figures": [
{
"figure": "https://jabet.bsmiab.org/media/article_images/2025/32/30/178-1725288444-Figure1.jpg",
"caption": "Figure 1. Images of clinical cases (A) healthy periodontal group, (B) plaque periodontitis, and (C) chronic periodontitis group.",
"featured": false
},
{
"figure": "https://jabet.bsmiab.org/media/article_images/2025/32/30/178-1725288444-Figure2.jpg",
"caption": "Figure 2. (A) Comparison of mean mast cell quantification among the study groups; and (B) The level of CD 117 expression among the study groups.",
"featured": false
},
{
"figure": "https://jabet.bsmiab.org/media/article_images/2025/32/30/178-1725288444-Figure3.jpg",
"caption": "Figure 3. Histological section of mast cells in: (A) healthy periodontal group, (B) plaque periodontitis group, and (C) chronic periodontitis group. TB stain, X 400.",
"featured": false
},
{
"figure": "https://jabet.bsmiab.org/media/article_images/2025/32/30/178-1725288444-Figure4.jpg",
"caption": "Figure 4. The mast cells contained in: (A) healthy periodontal group, (B) plaque periodontitis group, and (C) chronic periodontitis group (IHC, X400).",
"featured": true
}
],
"authors": [
{
"id": 1611,
"affiliation": [
{
"affiliation": "University of Basrah, College of Dentistry, Basrah city 61001, Iraq"
}
],
"first_name": "Fatin L.",
"family_name": "Khaphi",
"email": null,
"author_order": 1,
"ORCID": null,
"corresponding": false,
"co_first_author": false,
"co_author": false,
"corresponding_author_info": "",
"article": 323
},
{
"id": 1612,
"affiliation": [
{
"affiliation": "University of Basrah, College of Dentistry, Basrah city 61001, Iraq"
}
],
"first_name": "Hanaa Ali",
"family_name": "Hussein",
"email": "hanaazahraa85@gmail.com",
"author_order": 2,
"ORCID": "https://orcid.org/0000-0003-2848-5540",
"corresponding": true,
"co_first_author": false,
"co_author": false,
"corresponding_author_info": "Hanaa Ali Hussein, PhD\r\nUniversity of Basrah, College of Dentistry, Basrah city 61001, Iraq. Email: hanaazahraa85@gmail.com",
"article": 323
},
{
"id": 1613,
"affiliation": [
{
"affiliation": "University of Basrah, College of Dentistry, Basrah city 61001, Iraq"
}
],
"first_name": "Oula Fouad",
"family_name": "Hameed",
"email": null,
"author_order": 3,
"ORCID": null,
"corresponding": false,
"co_first_author": false,
"co_author": false,
"corresponding_author_info": "",
"article": 323
},
{
"id": 1614,
"affiliation": [
{
"affiliation": "University of Basrah, College of Dentistry, Basrah city 61001, Iraq"
}
],
"first_name": "Huda Jassem",
"family_name": "Jebur",
"email": null,
"author_order": 4,
"ORCID": null,
"corresponding": false,
"co_first_author": false,
"co_author": false,
"corresponding_author_info": "",
"article": 323
},
{
"id": 1615,
"affiliation": [
{
"affiliation": "University of Basrah, College of Dentistry, Basrah city 61001, Iraq"
}
],
"first_name": "Zahra Kadhum",
"family_name": "Saeed",
"email": null,
"author_order": 5,
"ORCID": null,
"corresponding": false,
"co_first_author": false,
"co_author": false,
"corresponding_author_info": "",
"article": 323
}
],
"views": 396,
"downloads": 61,
"references": [
{
"id": 13445,
"serial_number": 1,
"pmc": null,
"reference": "Ray RR. Periodontitis: An oral disease with severe consequences. Applied biochemistry and biotechnology. 2023;195:17-32.",
"DOI": null,
"article": 323
},
{
"id": 13446,
"serial_number": 2,
"pmc": null,
"reference": "Eltas A, Uslu MÖ. Evaluation of oral health-related quality-of-life in patients with generalized aggressive periodontitis. Acta Odontologica Scandinavica. 2013;71:547-52.",
"DOI": null,
"article": 323
},
{
"id": 13447,
"serial_number": 3,
"pmc": null,
"reference": "Lazar V, Ditu L-M, et al. Impact of dental plaque biofilms in periodontal disease: Management and future therapy. Periodontitis: A Useful Reference; Arjunan, P, Ed; InTech Open: London, UK. 2017:11-42.",
"DOI": null,
"article": 323
},
{
"id": 13448,
"serial_number": 4,
"pmc": null,
"reference": "Lagdive SS, Lagdive SB, et al. Correlation of mast cells in periodontal diseases. Journal of Indian Society of Periodontology. 2013;17:63-7.",
"DOI": null,
"article": 323
},
{
"id": 13449,
"serial_number": 5,
"pmc": null,
"reference": "Savita S, Ambica RK, et al. Quantification of mast cells in periodontal diseases: A comparative study. Journal of Pharmaceutical and Biomedical Sciences. 2015;5:919-23.",
"DOI": null,
"article": 323
},
{
"id": 13450,
"serial_number": 6,
"pmc": null,
"reference": "Dileepan KN, Raveendran VV, et al. Mast cell-mediated immune regulation in health and disease. Frontiers in Medicine. 2023;10:1213320.",
"DOI": null,
"article": 323
},
{
"id": 13451,
"serial_number": 7,
"pmc": null,
"reference": "Huang S, Lu F, et al. Mast cell degranulation in human periodontitis. Journal of Periodontology. 2013;84:248-55.",
"DOI": null,
"article": 323
},
{
"id": 13452,
"serial_number": 8,
"pmc": null,
"reference": "Mitchell SG, Bunting ST, et al. A variant c‐kit mutation, d816h, fundamental to the sequential development of an ovarian mixed germ cell tumor and systemic mastocytosis with chronic myelomonocytic leukemia. Pediatric blood & cancer. 2017;64:e26282.",
"DOI": null,
"article": 323
},
{
"id": 13453,
"serial_number": 9,
"pmc": null,
"reference": "Yamazaki S, Nakano N, et al. The transcription factor ehf is involved in tgf-β–induced suppression of fcεri and c-kit expression and fcεri-mediated activation in mast cells. The Journal of Immunology. 2015;195:3427-35.",
"DOI": null,
"article": 323
},
{
"id": 13454,
"serial_number": 10,
"pmc": null,
"reference": "Mazreah SA, Shahsavari M, et al. Immunohistochemical evaluation of cd117 in mast cell of aggressive periodontitis. Journal of Indian Society of Periodontology. 2020;24:216-20.",
"DOI": null,
"article": 323
},
{
"id": 13455,
"serial_number": 11,
"pmc": null,
"reference": "Fukuda T, Kamishima T, et al. Expression of the c‐kit gene product in normal and neoplastic mast cells but not in neoplastic basophil/mast cell precursors from chronic myelogenous leukaemia. The Journal of pathology. 1995;177:139-46.",
"DOI": null,
"article": 323
},
{
"id": 13456,
"serial_number": 12,
"pmc": null,
"reference": "Armitage GC. Development of a classification system for periodontal diseases and conditions. Annals of periodontology. 1999;4:1-6.",
"DOI": null,
"article": 323
},
{
"id": 13457,
"serial_number": 13,
"pmc": null,
"reference": "de Campos Vidal B, Mello MLS. Toluidine blue staining for cell and tissue biology applications. Acta histochemica. 2019;121:101-12.",
"DOI": null,
"article": 323
},
{
"id": 13458,
"serial_number": 14,
"pmc": null,
"reference": "Paul J, D’lima JP, et al. Histological evaluation of epithelial thickness, microvasculature and number of mast cells in the gingiva of smokers and non-smokers with chronic periodonti-tis. Journal of Clinical and Diagnostic Research. 2017;11:18-21.",
"DOI": null,
"article": 323
},
{
"id": 13459,
"serial_number": 15,
"pmc": null,
"reference": "Subramani T, Rathnavelu V, et al. Influence of mast cells in drug‐induced gingival overgrowth. Mediators of inflammation. 2013;2013:275172.",
"DOI": null,
"article": 323
},
{
"id": 13460,
"serial_number": 16,
"pmc": null,
"reference": "Frisancho-Kiss S. Fine-tuning mast cells is essential for the maintenance and regulation of the systemic and immune homeostasis. Journal of Integrative Medicine. 2021;10:60-74.",
"DOI": null,
"article": 323
},
{
"id": 13461,
"serial_number": 17,
"pmc": null,
"reference": "Steinsvoll S, Helgeland K, et al. Mast cells–a role in periodontal diseases? Journal of clinical periodontology. 2004;31:413-9.",
"DOI": null,
"article": 323
},
{
"id": 13462,
"serial_number": 18,
"pmc": null,
"reference": "Elieh Ali Komi D, Wöhrl S, et al. Mast cell biology at molecular level: A comprehensive review. Clinical reviews in allergy & immunology. 2020;58:342-65.",
"DOI": null,
"article": 323
},
{
"id": 13463,
"serial_number": 19,
"pmc": null,
"reference": "Moon T, St Laurent C, et al. Advances in mast cell biology: New understanding of heterogeneity and function. Mucosal immunology. 2010;3:111-28.",
"DOI": null,
"article": 323
},
{
"id": 13464,
"serial_number": 20,
"pmc": null,
"reference": "Paivandy A. Induction of mast cell apoptosis via granule permeabilization: A novel approach to target mast cells: Acta Universitatis Upsaliensis; 2020.",
"DOI": null,
"article": 323
},
{
"id": 13465,
"serial_number": 21,
"pmc": null,
"reference": "Agrawal R, Gupta J, et al. Correlation of mast cells in different stages of human periodontal diseases: Pilot study. Journal of Oral and Maxillofacial Pathology. 2016;20:91-5.",
"DOI": null,
"article": 323
},
{
"id": 13466,
"serial_number": 22,
"pmc": null,
"reference": "Fattahi S, Sadighi M, et al. Comparison of mast cell counts between the patients with moderate and severe periodontitis. Journal of Advanced Periodontology & Implant Dentistry. 2019;11:34.",
"DOI": null,
"article": 323
},
{
"id": 13467,
"serial_number": 23,
"pmc": null,
"reference": "Batista A, Rodini CdO, et al. Quantification of mast cells in different stages of human periodontal disease. Oral diseases. 2005;11:249-54.",
"DOI": null,
"article": 323
},
{
"id": 13468,
"serial_number": 24,
"pmc": null,
"reference": "Yang B-G, Kim A-R, et al. Degranulation of mast cells as a target for drug development. Cells. 2023;12:1506.",
"DOI": null,
"article": 323
},
{
"id": 13469,
"serial_number": 25,
"pmc": null,
"reference": "Walsh LJ. Mast cells and oral inflammation. Critical reviews in oral biology & medicine. 2003;14:188-98.",
"DOI": null,
"article": 323
},
{
"id": 13470,
"serial_number": 26,
"pmc": null,
"reference": "Korkmaz Y, Plomann M, et al. Dental pulp inflammation initiates the occurrence of mast cells expressing the α1 and β1 subunits of soluble guanylyl cyclase. International journal of molecular sciences. 2023;24:901.",
"DOI": null,
"article": 323
},
{
"id": 13471,
"serial_number": 27,
"pmc": null,
"reference": "Page RC, Eke PI. Case definitions for use in population‐based surveillance of periodontitis. Journal of periodontology. 2007;78:1387-99.",
"DOI": null,
"article": 323
},
{
"id": 13472,
"serial_number": 28,
"pmc": null,
"reference": "Beyens M, Toscano A, et al. Diagnostic significance of tryptase for suspected mast cell disorders. Diagnostics. 2023;13:3662.",
"DOI": null,
"article": 323
},
{
"id": 13473,
"serial_number": 29,
"pmc": null,
"reference": "Thangam EB, Jemima EA, et al. The role of histamine and histamine receptors in mast cell-mediated allergy and inflammation: The hunt for new therapeutic targets. Frontiers in immunology. 2018;9:1873.",
"DOI": null,
"article": 323
},
{
"id": 13474,
"serial_number": 30,
"pmc": null,
"reference": "Muluk NB, Arikan O, et al. Expressions of mmp2, mmp9, and timp-1 in the inflammatory cells of nasal polyps: Granulocytes, monocytes, and mast cells. European Review for Medical & Pharmacological Sciences. 2023;27.",
"DOI": null,
"article": 323
},
{
"id": 13475,
"serial_number": 31,
"pmc": null,
"reference": "Naesse E, Schreurs O, et al. Matrix metalloproteinases and their inhibitors in gingival mast cells in persons with and without human immunodeficiency virus infection. Journal of periodontal research. 2003;38:575-82.",
"DOI": null,
"article": 323
},
{
"id": 13476,
"serial_number": 32,
"pmc": null,
"reference": "Wang G, Fan W-T, et al. Expression of matrix metalloproteinase-8 and matrix metalloproteinase-13 in mast cells of human periapical lesions. International Journal of Clinical and Experimental Pathology. 2018;11:2530.",
"DOI": null,
"article": 323
},
{
"id": 13477,
"serial_number": 33,
"pmc": null,
"reference": "Cairns JA, Walls AF. Mast cell tryptase stimulates the synthesis of type i collagen in human lung fibroblasts. The Journal of clinical investigation. 1997;99:1313-21.",
"DOI": null,
"article": 323
},
{
"id": 13478,
"serial_number": 34,
"pmc": null,
"reference": "Gemmell E, Carter C, et al. Mast cells in human periodontal disease. Journal of dental research. 2004;83:384-7.",
"DOI": null,
"article": 323
},
{
"id": 13479,
"serial_number": 35,
"pmc": null,
"reference": "Vahabi S, Rezazadeh F, et al. Relationship between mast cell counts and different types of periodontitis. Journal of Advanced Periodontology & Implant Dentistry. 2010;2:56-60.",
"DOI": null,
"article": 323
},
{
"id": 13480,
"serial_number": 36,
"pmc": null,
"reference": "Neurath N, Kesting M. Cytokines in gingivitis and periodontitis: From pathogenesis to therapeutic targets. Frontiers in Immunology. 2024;15:1435054.",
"DOI": null,
"article": 323
},
{
"id": 13481,
"serial_number": 37,
"pmc": null,
"reference": "Malcolm J, Millington O, et al. Mast cells contribute to porphyromonas gingivalis–induced bone loss. Journal of dental research. 2016;95:704-10.",
"DOI": null,
"article": 323
}
]
},
{
"id": 322,
"slug": "178-1729709059-prevalence-and-consequences-of-bovine-subclinical-mastitis-in-hill-tract-areas-of-the-chattogram-division-bangladesh",
"featured": false,
"slider": false,
"issue": "Vol8 Issue1",
"type": "original_article",
"manuscript_id": "178-1729709059",
"recieved": "2024-10-23",
"revised": null,
"accepted": "2025-01-19",
"published": "2025-01-26",
"pdf_file": "https://jabet.bsmiab.org/media/pdf_file/2025/08/178-1729709059.pdf",
"title": "Prevalence and consequences of bovine subclinical mastitis in hill tract areas of the Chattogram division, Bangladesh",
"abstract": "<p>Mastitis is a common problem in Bangladeshi dairy cattle production. This study investigated the prevalence of subclinical mastitis (SCM), its impact on milk production and reproduction, and the resultant economic losses among dairy farms in the Chattogram division, Bangladesh. A cross-sectional study evaluated 161 farms, collecting 4,048 quarter milk samples from 1,012 cows to conduct a primary screening for SCM using the California mastitis test (CMT). Additional surveys were conducted on SCM-positive farms and animals to explore production and economic impacts. The prevalence of SCM at the farm level was 76.8% (43/56) in Chattogram and 69.5% (73/105) in Cox’s Bazar. At the quarter level, the prevalence of SCM was found to be 32.29% (1307/4048; 95% CI: 30.9-33.8), while at the animal level, it was 41.3% (418/1012; 95% CI: 38.3-44.4). Crossbred cows exhibited a higher susceptibility to SCM at 47.2%, compared to indigenous breeds (31.2%). SCM significantly (<em>p</em><0.05) altered milk's physicochemical properties, reducing fat, protein, and mineral content and negatively affecting milk quality, and market value along with some key reproductive parameters, particularly in Crossbred and Holstein Friesian cows. The economic losses due to SCM are substantial, primarily driven by decreased milk production and increased treatment costs. Crossbred and Holstein Friesian cows suffer the most significant financial losses from their higher milk production and treatment expenses. In conclusion, this study provided valuable insights for policymakers, veterinarians, and farmers, to adopt effective SCM control measures to improve the productivity of the dairy industry in Bangladesh.</p>",
"journal_reference": "J Adv Biotechnol Exp Ther. 2025; 8(1): 163-181",
"academic_editor": "Md. Abdul Hannan, PhD; Bangladesh Agricultural University, Bangladesh",
"cite_info": "Mia MP, Hossain H, et al. Prevalence and consequences of bovine subclinical mastitis in hill tract areas of the Chattogram division, Bangladesh. J Adv Biotechnol Exp Ther. 2025; 8(1): 163-181.",
"keywords": [
"Prevalence",
"Mastitis",
"Reproductive parameters",
"SCM",
"Milk constituents",
"Bovine"
],
"DOI": "10.5455/jabet.2025.14",
"sections": [
{
"section_number": 1,
"section_title": "INTRODUCTION",
"body": "<p>Dairy cattle production is vital to the global agricultural economy, providing essential nutrition and supporting millions of livelihoods. This industry stimulates economic activity in related sectors [<a href=\"#r-1\">1</a>]. However, a significant threat to maximizing profits in milk production is mastitis, a prevalent disease in dairy cattle worldwide [<a href=\"#r-2\">2</a>]. Mastitis, mammary gland inflammation, is one of the most common and costly diseases affecting dairy cattle worldwide [<a href=\"#r-3\">3</a>]. It can be caused by a variety of pathogens, including bacteria, fungi, and viruses [<a href=\"#r-4\">4</a>], leading to significant economic losses due to reduced milk yield, altered milk composition, increased veterinary costs, and premature culling of affected animals [<a href=\"#r-5\">5,6</a>].</p>\r\n\r\n<p>Mastitis represents a widespread problem in Bangladesh dairy cattle farming, manifesting in clinical (CM) and subclinical (SCM) forms, each markedly affecting the dairy sector. CM is identified by overt symptoms, including udder inflammation, erythema, increased temperature, pain, and alterations in milk appearance. SCM, however, is more common and economically damaging, occurring 15-40 times more frequently than CM [<a href=\"#r-4\">4</a>,<a href=\"#r-7\">7–9</a>]. This disease condition is asymptomatic but can be identified by increased somatic cell counts (SCC) in the milk, signifying an ongoing inflammatory response [<a href=\"#r-10\">10</a>]. The prevalence of mastitis, particularly SCM, varies significantly across different regions and herd management practices, yet it consistently challenges dairy producers worldwide [<a href=\"#r-11\">11</a>]. Often undetected without routine screening, SCM represents a considerable covert threat due to its chronic nature and detrimental effects on milk quality and yield [<a href=\"#r-11\">11</a>].</p>\r\n\r\n<p>The etiology of SCM is multifaceted, involving microbial virulence and load, treatment protocols, micro-environmental conditions, host characteristics, milking practices, potential vectors, immune response, and nutritional status [<a href=\"#r-12\">12</a>]. Additionally, injuries to the teats or the udder, resulting from physical, chemical, or thermal factors, can also lead to SCM. Animals with SCM may act as reservoirs of infection, posing a risk to other herd members. In tropical climates, dairy animals experience a higher incidence of SCM due to environmental conditions that favor the proliferation of pathogenic microorganisms responsible for the disease [<a href=\"#r-13\">13,14</a>]. SCM significantly affected reproductive parameters, including days open, calving intervals, service per conception, and conception rates. It primarily extended the duration of these parameters, leading to substantial economic losses for farmers [<a href=\"#r-15\">15</a>]. SCM contributes to approximately two-thirds of the total economic losses in milk production [<a href=\"#r-13\">13</a>]. Consequently, the routine application of on-site diagnostic tests is highly advantageous for the timely detection and management of SCM [<a href=\"#r-16\">16</a>]. However, SCM imposes significant economic burdens on dairy farms through direct and indirect costs. Direct costs include expenditures for veterinary services, diagnostic testing, drugs, and labor, with treatment-related expenses such as veterinary visits ($50 per visit), medications ($100-$200 per case), and labor ($10-$20 per case), along with milk disposal losses due to antibiotic residues ($20-$50 per treatment) [<a href=\"#r-17\">17,18</a>]. Indirect costs involve a 15-20% reduction in milk yield, resulting in an approximate annual loss of $110 per cow, and the prolonged effects of SCM, which incur additional costs of $200-$300 annually per cow [19,20]. Moreover, severe SCM can lead to early culling, imposing significant replacement costs of $1,200-$2,000 per cow, further impacting herd productivity [<a href=\"#r-18\">18</a>].</p>\r\n\r\n<p>Apart from the substantial economic losses associated with SCM, it has serious zoonotic potential and has been associated with the increasing development and the rapid emergence of multi-drug resistance strains globally [<a href=\"#r-21\">21,22</a>]. The lack of proper identification of the causative agents of mastitis has contributed to the indiscriminate use of antibiotics, which accelerates the development and spread of MDR strains [<a href=\"#r-23\">23</a>]. The dissemination of MDR pathogens can occur through multiple pathways, including poor hygiene practices, inadequate management, and transmission via milkers. Infected animals’ shed resistant pathogens into their environment, contaminating milking equipment, bedding, and other surfaces, thereby increasing the risk of infection transmission within the herd [<a href=\"#r-24\">24</a>]. Consequently, cases of antimicrobial-resistant SCM pose challenges in effective treatment, as these bacteria may not respond to standard antibiotic therapies, resulting in prolonged infections, decreased milk production, and economic losses for dairy farmers [<a href=\"#r-25\">25</a>]. Therefore, prompt identification of SCM is crucial to address this issue effectively.</p>\r\n\r\n<p>Despite its widespread presence and significant economic repercussions, a substantial gap exists in understanding mastitis prevalence, its effects on production, and its economic impacts in specific regions, particularly in developing countries like Bangladesh. The Chattogram division, a key area for dairy farming, needs comprehensive economic surveys assessing losses from SCM and changes in milk quality. Moreover, the status of SCM and its qualitative effects on milk remains poorly studied in this region. This study aimed to fill these knowledge gaps by thoroughly investigating SCM prevalence, its impact on milk production and quality, and the resultant economic losses among dairy farmers in Chattogram and Cox Bazar districts. This understanding is critical for developing targeted mastitis management strategies suited to local conditions, ultimately enhancing the financial viability and sustainability of dairy farming in the area.</p>"
},
{
"section_number": 2,
"section_title": "MATERIALS AND METHODS",
"body": "<p><strong>Ethical consideration</strong></p>\r\n\r\n<p>The study protocol was reviewed and approved by the Animal Experimentation and Ethics Committee (AEEC) of Sylhet Agricultural University under protocol number AUP#2022037.</p>\r\n\r\n<p> </p>\r\n\r\n<p><strong>Experimental design and location </strong></p>\r\n\r\n<p>The study was conducted in the hill tract areas of the Chattogram division, Bangladesh. The selected upazilas included Patia, Chandanaish, Satkania, and Lohagara from the Chattogram district, as well as Chakoria, Moheshkhali, Ramu, Ukhia, Teknaf, and Cox’s Bazar Sadar from the Cox’s Bazar district (<a href=\"#figure1\">Figure 1</a>). The geographical coordinates of the study area are 22°20′06″N to 91°49′57″E (Chattogram) and 21°25′38″N to 92°00′18″E (Cox’s Bazar). The study population required to estimate prevalence was calculated using an equation delineated by Naser <em>et al. </em>and Rahman<em> et al.</em> [<a href=\"#r-26\">26,27</a>].</p>\r\n\r\n<p><img alt=\"\" height=\"37\" src=\"https://jabet.bsmiab.org/media/ck_uploads/2025/01/28/image-20250128154554-1.png\" width=\"185\" /></p>\r\n\r\n<p>Where n = Desired sample size, Z = 1.96 for a 95% confidence interval, and P<sub>exp</sub> = 0.3595 (35.95%). Expected prevalence was considered from previously published work at Chattogram [<a href=\"#r-28\">28</a>]; d = 0.05, Desired absolute precision (5%).</p>\r\n\r\n<p>Based on the reference prevalence, the minimum required sample size was calculated to be 353.8. However, this study included 1,012 cows. From June to December 2023, a cross-sectional study was conducted on 161 dairy farms, where 4,048 quarter milk samples were collected for primary screening of SCM using the California Mastitis Test (CMT). The study included farms with varying herd sizes and management practices that had experienced cases of SCM in their cattle and met the inclusion criteria.</p>\r\n\r\n<div id=\"figure1\">\r\n<figure class=\"image\"><img alt=\"\" height=\"375\" src=\"/media/article_images/2025/36/28/178-1729709059-Figure1.jpg\" width=\"500\" />\r\n<figcaption><strong>Figure 1.</strong> The study area map shows the selected district and sub-district of the experiment. The map was created using ArcMap 10.8.</figcaption>\r\n</figure>\r\n</div>\r\n\r\n<p> </p>\r\n\r\n<p><strong>Disease screening using CMT</strong></p>\r\n\r\n<p>The initial selection of cows involved a screening process using the CMT, following the manufacturer’s instructions. Approximately 2 ml of milk was aseptically collected from each udder quarter, following the guidelines of the NMC protocols [<a href=\"#r-29\">29</a>], and placed onto a CMT paddle. According to the manufacturer’s instructions, an equivalent quantity of CMT reagent (Weizur CMT Test Kit, Gujarat, India) was applied to each well of the paddle. The "Eight-Not" method was applied gently for 15 seconds to achieve a homogeneous mixture. The resulting reaction was assessed using eye estimation, focusing on the formation of gel considering SCM positive and graded based on gel formation. The grading system ranged from negative (Grade 0), where no change in viscosity occurred and the milk remained liquid, to strong (Grade 3+), which was characterized by a very thick consistency and pronounced gel formation. Intermediate grades, such as slight thickening with no gel formation (Graded as Trace), noticeable thickening with slight coagulation (Grade 1+), and thick consistency with pronounced gel formation (Grade 2+), indicated varying levels of thickening and gel formation/ coagulation of SCM positive milk [<a href=\"#r-30\">30,31</a>]. A total of 1012 dairy cows were screened for detection of SCM. Among them 547 cows were Crossbred, 112 were Holstein Friesian and 353 were Indigenous.</p>\r\n\r\n<p> </p>\r\n\r\n<p><strong>Chemical analysis of milk sample</strong></p>\r\n\r\n<p>The milk samples, collected by standard guidelines and under aseptic conditions, were transported to the laboratory. The chemical composition analysis of the milk, including parameters such as fat, protein, lactose, solids not fat (SNF), and mineral percentage, was conducted using an auto-milk analyzer through Near Infrared Spectroscopy using DA 7250 NIR Analyzer (PerkinElmer, Inc., Shelton, USA). All the chemical analyses of milk constituents (Physical properties, Chemical constituents such as: Calcium, Phosphorus, Sodium, Potassium, Albumin, Immunoglobulin, α-lactalbumin, β-lactoglobulin and Pre-albumin) and sample preparations were fully followed by the methods described by Gonçalves <em>et al.</em> [<a href=\"#r-32\">32</a>].</p>\r\n\r\n<p> </p>\r\n\r\n<p><strong>Data collection</strong></p>\r\n\r\n<p>Each selected farm underwent a comprehensive assessment which involved a detailed evaluation of the farm management practices, herd composition, and health status of the cattle. Observations were made regarding the housing, feeding, and milking practices to understand the potential risk for SCM. Structured interviews were conducted with the farm owners or managers using a pre-tested questionnaire (Supplementary File). The questionnaire was designed to gather detailed information on the following aspects: Demographic information (Gender, Age, Education, Farmer type) of the farm owner; Farm management practices; History and prevalence of SCM in the herd; Treatment and control measures for SCM; Economic losses attributed to SCM.</p>\r\n\r\n<p>The reproductive data was obtained from the farms' record-keeping repositories. For reproductive data analysis, a minimum of 10 SCM-positive cows and 10 healthy cows from each breed were randomly selected. The animals were chosen from the farms included in this study, ensuring that all selected cows had a minimum of two parties. The interviews were conducted in the local language, and the responses were recorded for subsequent analysis.</p>\r\n\r\n<p> </p>\r\n\r\n<p><strong>Assessment of production and economic loss </strong></p>\r\n\r\n<p>Our Research involved a meticulous process of evaluating cows diagnosed with SCM and an equal number of SCM-negative. A total of 836 cows were assessed, with a focus on comparing production loss, length of lactation, and average daily milk production. The cows were selected randomly irrespective of their age and breed, but mostly Crossbred, Indigenous (Deshi), and Holstein Friesian (HF) were observed. This thorough approach ensures the reliability and accuracy of our findings. The effects on production were measured using the following equations:</p>\r\n\r\n<ul>\r\n\t<li>Loss of milk production per day due to SCM = Average milk production/day (Normal healthy cow) – Average milk production/day (SCM positive cow)</li>\r\n\t<li>Production loss/Lactation (TK) = Loss of Production/Lactation × Unit price (Avg.) of Milk</li>\r\n</ul>\r\n\r\n<p>Economic losses due to SCM were assessed, and the benefits of early diagnosis and treatment were determined through data collection on various economic attributes. To quantify the economic losses associated with SCM, data were gathered on the following parameters: the average price of milk per liter (TK), average loss of milk per day (liter), average days of suffering due to SCM, average days of treatment, treatment cost per day (TK), veterinarian consultation fee (TK), recurrence rate of SCM (Follow up process), decreased value of each recurrence rate (TK), and milk disposal due to antibiotic residues. The collected data were analyzed to estimate the direct and indirect economic losses per farm. The overall economic losses were calculated using a modified version of Jingar's formula [<a href=\"#r-33\">33</a>]:</p>\r\n\r\n<ul>\r\n\t<li>Overall loss of Production during sufferings of SCM (TK) = Average price of milk per liter (TK) × Average loss of milk per day (liter) × Average days of suffering due to SCM</li>\r\n\t<li>Overall Medication expenditure (TK) = (Average days of treatment × Treatment cost per day (TK)) + Veterinarian consultation fee (TK)</li>\r\n\t<li>Loss of value/ Cow = Recurrence rate × Average number of quarters affected/SCM affected cow × Decreased value of recurrence (TK). [Recurrence rate = Number of quarters resulted in recurrent/Number of quarters affected]</li>\r\n\t<li>Total Expenditure/Cow during SCM (TK) = (Overall loss of Production during sufferings of SCM (TK) + Overall Medication expenditure (TK) + Loss of value/ Cow + Early diagnostic test fees). [Early diagnostic test fee (1000 TK/Cow) includes Test evaluation fees, Reagent fee, Labor cost, Transportation of evaluator, etc.]</li>\r\n</ul>\r\n\r\n<p>Finally, the benefits of early diagnosis and treatment of SCM were assessed through the following formula:</p>\r\n\r\n<ul>\r\n\t<li>Benefits from each cow per lactation = (Production loss/Cow/Lactation (TK) during undetected and untreated - Grand total Expenditure/Cow during Detected and Treated)</li>\r\n</ul>\r\n\r\n<p><strong> </strong></p>\r\n\r\n<p><strong>Statistical analysis</strong></p>\r\n\r\n<p>The data were entered into a statistical software package for analysis. Descriptive statistics were used to summarize the farm characteristics and management practices. The economic losses were calculated by aggregating the costs. The results were presented in terms of mean losses per farm and the overall economic benefits on the study population. The chi-square goodness of fit test was employed for the socio-demographic profile of the farmer, farm, and also animals. An independent sample t-test was conducted to compare the milk constituents of apparently healthy and SCM-affected cows, as well as to analyze the reproductive data between these two groups. <em>P</em> value <0.05 was considered as the level of significance. All the data were analyzed using SPSS version 26 software (IBM SPSS statistics 26). Finally, the data of milk constituents were visualized using GraphPad Prism 8.4.</p>"
},
{
"section_number": 3,
"section_title": "RESULTS",
"body": "<p><strong>Socio-demographic characteristics of farm owners</strong></p>\r\n\r\n<p>The socio-demographic characteristics of the 116 farm owners who participated in the cross-sectional survey on the economic and production effects of SCM in Chattogram and Cox’s Bazar districts, Bangladesh, were presented in <a href=\"#Table-1\">Table 1</a>. The demographic profile included variables such as gender, age, education level, and type of farming operation.</p>\r\n\r\n<p>The majority of participants were male, comprising 81.9% (95% CI: 73.7-88.4%) of the total sample, with 34 males from Chattogram (CTG) and 61 from Cox’s Bazar (CB). Female participants accounted for 18.1% (95% CI: 11.6-26.3%) of the sample, with nine from CTG and twelve from CB. The age of farm owners varied significantly <em>(P</em> < 0.001). The largest age group was 46-60 years, comprising 48.3% (95% CI: 38.9-57.7%) of the total participants, with five from CTG and fifty-one from CB. The 31-45 age group represented 31.9% (95% CI: 23.5-41.2%), with 23 from CTG and 14 from CB. Participants aged 61 years and above constituted 10.3% (95% CI: 5.5-17.4%), with seven from CTG and five from CB. The youngest group, 15-30 years old, made up 9.5% (95% CI: 4.8-16.3%) of the sample.</p>\r\n\r\n<p>The education levels of the farm owners also varied significantly (<em>P</em> = 0.029). The majority had higher secondary education, accounting for 52.6% (95% CI: 43.6-61.9%) of the sample, with 18 from CTG and 43 from CB. Those with graduation or higher education comprised 31.0% (95% CI: 22.8-40.3%), with 15 from CTG and 21 from CB. Farm owners with secondary education made up 10.3% (95% CI: 5.5-17.4%), with 4 from CTG and 8 from CB. The least educated group with primary education represented 6.0% (95% CI: 2.5-12.0%), with six from CTG and one from CB.</p>\r\n\r\n<p>Regarding the type of farming operation, significant differences were observed (<em>P </em>< 0.001). Medium-sized farms (11-30 cows) were the most common, representing 48.3% (95% CI: 38.9-57.7%) of the total, with 32 from CTG and 24 from CB. Small farms (less than ten cows) comprised 44.0% (95% CI: 34.8-53.5%) of the sample, with eight from CTG and 43 from CB. Large farms (above 30 cows) were the least common, comprising 7.8% (95% CI: 3.6-14.2%) of the participants.</p>\r\n\r\n<p style=\"text-align:center\"><strong>Table 1.</strong> Socio-demographic characteristics of farm owners.</p>\r\n\r\n<div id=\"Table-1\">\r\n<p style=\"text-align:center\"><a href=\"https://jabet.bsmiab.org/table/178-1729709059-table1/\">Table-1</a></p>\r\n</div>\r\n\r\n<p> </p>\r\n\r\n<p><strong>Prevalence of SCM</strong></p>\r\n\r\n<p>The prevalence of SCM was assessed at both farm and animal levels, as detailed in <a href=\"#Table-2\">Tables 2</a> and <a href=\"#Table-3\">3</a>. In the Chattogram district, the overall SCM prevalence in cattle was 76.8% (43/56, 95% CI: 63.6-87.0). The highest prevalence was observed in Chandanaish at 82.4%, while the lowest was in Satkania at 72.2%. In the Cox’s Bazar district, SCM prevalence was slightly lower at 69.5% (73/105, 95% CI: 59.8-78.1). The highest prevalence in this district was recorded in Cox’s Bazar Upazila at 82.4%, with the lowest in Chokoria Upazila at 55.6%. Farm management practices significantly influenced SCM prevalence <em>(p</em><0.001). Fully intensive management systems had a significantly higher prevalence of 84.5% (87/103), while semi-intensive systems showed a lower incidence of 47.7% (21/44). Regarding flooring types, SCM prevalence was highest on concrete floors at 86.5% (32/37), and lowest on cemented floors at 66.7% (78/117).</p>\r\n\r\n<p>At the quarter level, the prevalence of SCM was found to be 32.29% (1307/4048; 95% CI: 30.9-33.8), while at the animal level, it was 41.3% (418/1012; 95% CI: 38.3-44.4). In farm/herd level the prevalence was 72.05% (116/161; 95% CI: 64.4-78.8). The prevalence of SCM varied significantly across different animal-level characteristics (<a href=\"#Table-3\">Table 3</a>). Among age groups, the highest prevalence was observed in cows aged 5–8 years 44.9% (282/627), while the lowest was 29.9% (44/147) in those aged above 8 years (<em>p</em>=0.002). Crossbred cows had a higher prevalence of 47.2% (258/547), while indigenous cows showed a prevalence of 31.2% (110/353). For lactation stages, SCM prevalence was highest in the late stage (58.1%; 198/341) and lowest in the early stage (28.0%; 107/382) (<em>p</em><0.001). Parity also influenced SCM prevalence, with multiparous cows showing a higher prevalence (43.7%; 351/803) compared to primiparous cows (32.1%; 67/209) (<em>p</em>=0.003).</p>\r\n\r\n<p style=\"text-align:center\"><strong>Table 2.</strong> Prevalence of SCM on farm-level characteristics.</p>\r\n\r\n<div id=\"Table-2\">\r\n<p style=\"text-align:center\"><a href=\"https://jabet.bsmiab.org/table/178-1729709059-table2/\">Table 2</a></p>\r\n</div>\r\n\r\n<p> </p>\r\n\r\n<p style=\"text-align:center\"><strong>Table 3.</strong> Prevalence of SCM on some animal-level characteristics.</p>\r\n\r\n<div id=\"Table-3\">\r\n<p style=\"text-align:center\"><a href=\"https://jabet.bsmiab.org/table/178-1729709059-table3/\">Table-3</a></p>\r\n</div>\r\n\r\n<p> </p>\r\n\r\n<p><strong>CMT grading of SCM-positive samples</strong></p>\r\n\r\n<p>The CMT results for SCM-positive milk samples are presented in <a href=\"#Table-4\">Table 4</a> and <a href=\"#figure2\">Figure 2</a>. The majority of samples (67.74%) were graded as negative, showing no viscosity changes. A small percentage showed trace thickening (5.16%) or noticeable thickening with some gel formation (10.30%). More severe grades were also observed, with 9.31% in Grade 2 and 7.51% in Grade 3, indicating increasingly thick consistency and strong gel formation (<a href=\"#figure2\">Figure 2</a>B).</p>\r\n\r\n<p>The frequency of SCM-positive quarters revealed that all four quarters were identified in 162 animals, while only one quarter was affected in 29 animals. The majority of SCM-positive cases involved three affected quarters, totaling 176 animals, as shown in <a href=\"#figure2\">Figure 2</a>A.</p>\r\n\r\n<div id=\"figure2\">\r\n<figure class=\"image\"><img alt=\"\" height=\"291\" src=\"/media/article_images/2025/36/28/178-1729709059-Figure2.jpg\" width=\"500\" />\r\n<figcaption><strong>Figure 2. </strong>A) Frequency of SCM on CMT positive quarters. Ns: Non-significant, <em>*P</em><0.05, <em>**P</em><0.01, <em>***P</em><0.001. B) SCM positive results on the basis of CMT grading.</figcaption>\r\n</figure>\r\n\r\n<p> </p>\r\n</div>\r\n\r\n<p style=\"text-align:center\"><strong>Table 4. </strong>CMT results grading of SCM positive samples.</p>\r\n\r\n<div id=\"Table-4\">\r\n<p style=\"text-align:center\"><a href=\"https://jabet.bsmiab.org/table/178-1729709059-table4/\">Table-4</a></p>\r\n</div>\r\n\r\n<p> </p>\r\n\r\n<p><strong>Effect of SCM on physical and chemical properties of milk </strong></p>\r\n\r\n<p>The physicochemical properties of milk change significantly due to the effects of SCM in cattle. The chemical components (Fat, SNF, Lactose, Protein, and Minerals) and the protein factions (Immunoglobulin, α-lactalbumin, β-lactoglobulin, albumin and Pre-albumin) and minerals (Calcium, Phosphorous, Sodium, and Potassium) had shown significant deteriorations due to the effects of SCM (<a href=\"#figure3\">Figure 3</a>).</p>\r\n\r\n<p>The physical properties of milk from healthy cows showed slight alterations due to SCM (<a href=\"#figure3\">Figure 3</a>A). While pH and freezing point remained relatively stable, significant variations were observed in density, specific gravity, and acidity (%). The density of milk significantly increased (<em>p</em><0.01) from 30.6 in normal milk to 38.5 in SCM milk. Similarly, the specific gravity was higher in SCM milk than normal milk (1.02 vs 1.04). Additionally, overall milk acidity (%) saw a significant increase (<em>p<</em>0.05) in SCM milk (0.20 vs 0.35).</p>\r\n\r\n<p>SCM significantly alters the chemical components of milk (<a href=\"#figure3\">Figure 3</a>B). The fat (%) significantly (<em>p</em><0.01) reduced from 3.4 to 2.9. All other components like Solid not fat (8.2), lactose (4.7), and minerals (0.57) were reduced due to the effect of SCM in cows. The impact of SCM on the mineral and albumin content in milk results in significant alterations compared to normal milk (<a href=\"#figure3\">Figure 3</a>C). The calcium in the normal milk of cows was reduced from 125.7 mg/dl to 92.0 mg/dl while a cow was affected in SCM. Notably, there was a marked decrease (<em>p</em><0.001) in the phosphorus level, with SCM milk showing 24.5 mg/dl compared to 31.3 mg/dl in normal milk. Conversely, the sodium content in SCM milk rises substantially, registering at 90.5 mg/dl versus 53.4 mg/dl in normal milk. Potassium levels exhibit a slight decrease in SCM milk (150.8 mg/dl) compared to normal milk (163.1 mg/dl). Immunoglobulin levels increase dramatically from 7.4 to 26.1, indicating a higher immune response. α-lactalbumin levels decreased from 28.1 to 22.1, and β-lactoglobulin levels also dropped significantly from 54.7 to 34.2, reflecting disruptions in protein synthesis. Albumin content rises from 6.8 to 15.7, signaling inflammation and tissue damage. Finally, the pre-albumin levels slightly decreased from 0.16 to 0.12 (<a href=\"#figure3\">Figure 3</a>D).</p>\r\n\r\n<div id=\"figure3\">\r\n<figure class=\"image\"><img alt=\"\" height=\"442\" src=\"/media/article_images/2025/36/28/178-1729709059-Figure3.jpg\" width=\"500\" />\r\n<figcaption><strong>Figure 3</strong>. Comparative assessment (Normal vs SCM milk) of milk due to the effects of SCM. A) Changes of physical properties of milk due to SCM compared with normal healthy milk. B) Changes of chemical properties of milk due to SCM. C) Minerals and albumin. D) Level of protein fractions. [ns: non-significant, *<em>p<</em>0.05, **<em>p<</em>0.01, ***<em>p<</em>0.001, Independent sample t-test]</figcaption>\r\n</figure>\r\n\r\n<p> </p>\r\n</div>\r\n\r\n<p><strong>Consequence of SCM on reproductive parameters </strong></p>\r\n\r\n<p>The comparative assessment of reproductive parameters between apparently healthy (AH) cows and SCM-positive cows across different breeds was explained in detail in <a href=\"#Table-5\">Table 5</a>.</p>\r\n\r\n<p>The calving interval was significantly higher in SCM-positive cows (414.5 days) compared to AH cows (398.8 days) for Crossbred and Holstein Friesian breeds (<em>P</em> < 0.01), but no significant difference was observed in Indigenous breeds (<em>P</em> = 0.16). Similarly, days open were significantly longer in SCM-positive cows of Crossbred and Holstein Friesian breeds (<em>P</em> < 0.01), while Indigenous breeds showed no significant difference. Service per conception did not differ significantly (<em>P</em> > 0.05) between AH and SCM-positive cows across all breeds. However, conception rates were significantly reduced in SCM-positive Holstein Friesian cows (<em>P</em> = 0.04), with no significant differences in Crossbred or Indigenous cows.</p>\r\n\r\n<p style=\"text-align:center\"><strong>Table 5.</strong> Comparative assessment of reproductive parameters between AH and SCM-positive cows across different breeds.</p>\r\n\r\n<div id=\"Table-5\">\r\n<p style=\"text-align:center\"><a href=\"https://jabet.bsmiab.org/table/178-1729709059-table5/\">Table-5</a></p>\r\n</div>\r\n\r\n<p> </p>\r\n\r\n<p><strong>Effect of SCM on production loss in different breeds of cattle</strong></p>\r\n\r\n<p><em>Lactation length and production of crossbred cows</em></p>\r\n\r\n<p>SCM significantly impacts milk production across different cattle breeds, leading to substantial economic losses in per-laboration. In crossbred cows, the average lactation period for healthy cows was 236.7 days, but this decreased to 228.9 days in SCM-positive cows, resulting in a loss of 7.8 days. Additionally, milk production per day drops from 9.2 liters in healthy cows to 7.3 liters in SCM-positive cows. Consequently, the overall production per lactation falls from 2177.6 liters to 1670.9 liters, amounting to a production loss of 506.7 liters and a financial loss of 44,893.6 TK ($ 382.17) per lactation (<a href=\"#Table-6\">Table 6</a>).</p>\r\n\r\n<p style=\"text-align:center\"><strong>Table 6.</strong> Production effects of SCM among the different breeds of cows in Chattogram and Cox’s Bazar district of Bangladesh.</p>\r\n\r\n<div id=\"Table-6\">\r\n<p style=\"text-align:center\"><a href=\"https://jabet.bsmiab.org/table/178-1729709059-table6/\">Table-6</a></p>\r\n</div>\r\n\r\n<p> </p>\r\n\r\n<p><em>Lactation length and production of Holstein Friesian cows</em></p>\r\n\r\n<p>For Holstein Friesian cows, the average lactation period decreases from 301.9 days in healthy cows to 296.1 days in SCM-positive cows, resulting in a loss of 5.8 days in undetected cows per lactation. Their milk production drops significantly from 22.5 liters per day in healthy cows to 18.3 liters in SCM-positive cows, causing a daily loss of 4.2 liters. This results in a decrease in overall production per lactation from 6792.8 liters to 5418.6 liters, with a production loss of 1374.2 liters and a financial loss of 121,754.1 TK ($ 1036.46) per lactation (<a href=\"#Table-6\">Table 6</a>).</p>\r\n\r\n<p> </p>\r\n\r\n<p><em>Lactation length and production of Indigenous cows</em></p>\r\n\r\n<p>In indigenous cows, the average lactation period for healthy cows was 209.3 days which decreases to 205.8 days in SCM-positive cows, leading to a loss of 3.5 days per lactation. Daily milk production drops slightly from 2.6 liters in healthy cows to 2.3 liters in SCM-positive cows, resulting in a daily loss of 0.3 liters. Overall production per lactation decreases from 544.2 liters to 473.3 liters, with a production loss of 70.9 liters and a financial loss of 6,281.7 TK ($ 53.47) per lactation (<a href=\"#Table-6\">Table 6</a>).</p>\r\n\r\n<p><em> </em></p>\r\n\r\n<p><em>Economic losses due to SCM in dairy cows</em></p>\r\n\r\n<p>The economic losses incurred due to SCM in dairy cows in Chattogram and Cox’s Bazar districts can be substantial, affecting milk production, treatment costs, and overall cow health. This analysis examines the economic parameters contributing to the total loss and highlights the benefits of early detection and treatment of SCM (<a href=\"#Table-7\">Table 7</a>).</p>\r\n\r\n<p style=\"text-align:center\"><strong>Table 7.</strong> Loss of economic indices (Due to SCM) in dairy cows of Chattogram and Cox’s Bazar.</p>\r\n\r\n<div id=\"Table-7\">\r\n<p style=\"text-align:center\"><a href=\"https://jabet.bsmiab.org/table/178-1729709059-table7/\">Table-7</a></p>\r\n</div>\r\n\r\n<p> </p>\r\n\r\n<p><em>Production losses during suffering from SCM</em></p>\r\n\r\n<p>The average price of milk per liter is 88.6 TK. Crossbred cows suffer an average milk loss of 1.9 liters daily for 16.8 days due to SCM, resulting in an overall production loss of 2828.1 TK. Holstein Friesian cows lose 4.2 liters per day for 18.1 days, leading to a higher production loss of 6735.4 TK. Indigenous cows, with a daily milk loss of 0.3 liters for 14.2 days, incur a production loss of 377.4 TK.</p>\r\n\r\n<p> </p>\r\n\r\n<p><em>Treatment costs</em></p>\r\n\r\n<p>Treatment costs also add to the economic burden. Crossbred cows require an average of 10.8 days of treatment at a daily cost of 87.5 TK, plus a veterinarian consultation fee of 1008.3 TK, resulting in an overall medication expenditure of 1953.3 TK. Holstein Friesian cows, with a 12.6-day treatment period, a daily cost of 93.1 TK, and a consultation fee of 1253.7 TK, have a higher treatment cost of 2426.8 TK. Indigenous cows have the lowest treatment cost at 1437.5 TK, with an 8.2-day treatment period at 67.9 TK per day and an 880.7 TK consultation fee.</p>\r\n\r\n<p> </p>\r\n\r\n<p><em>Loss due to recurrence rate</em></p>\r\n\r\n<p>The recurrence of SCM decreases the value of affected quarters. The recurrence of SCM and the average number of affected quarters per SCM-affected cow were similar across breeds, but the economic impact varies. The decreased value of recurrence was the highest in crossbred cows (2381.6 TK), resulting in a loss of 293.4 TK per cow. Holstein Friesian cows lost 224.4 TK, and indigenous cows incurred the lowest loss at 149.2 TK.</p>\r\n\r\n<p> </p>\r\n\r\n<p><em>Grand total expenditure</em></p>\r\n\r\n<p>The total expenditure per cow during SCM, including production losses, treatment costs, and recurrence rate of SCM, plus an early diagnostic test fee of 1000 TK ($ 8.51), amounts to 6074.8 TK for crossbred cows, 10386.6 TK for Holstein Friesian cows, and 2964.1 TK for indigenous cows (<a href=\"#Table-7\">Table 7</a>).</p>\r\n\r\n<p><strong> </strong></p>\r\n\r\n<p><strong>Benefits of early diagnosis and treatment</strong></p>\r\n\r\n<p>The benefits of early detection and treatment of SCM in cows were significant, as illustrated in <a href=\"#Table-8\">Table 8</a>. For crossbred cows, the production loss per lactation during undetected and untreated SCM was 44893.6 TK, compared to a total expenditure of 6074.8 TK when SCM was detected and treated, resulting in a benefit of 38818.8 TK ($ 330.348) per cow per lactation. Holstein Friesian cows benefit even more, with a production loss of 121754.1 TK versus an expenditure of 10386.6 TK, yielding a benefit of 111367.5 TK ($ 947.737). Indigenous cows, though having lower overall production losses, still benefit by 3317.6 TK ($ 28.233) per cow per lactation.</p>\r\n\r\n<p style=\"text-align:center\"><strong>Table 8.</strong> Economic benefits from early diagnosis and treatment of SCM in cows.</p>\r\n\r\n<div id=\"Table-8\">\r\n<p style=\"text-align:center\"><a href=\"https://jabet.bsmiab.org/table/178-1729709059-table8/\">Table-8</a></p>\r\n</div>"
},
{
"section_number": 4,
"section_title": "DISCUSSION",
"body": "<p>The results of this study highlighted the significant socio-demographic and economic impacts of SCM on dairy farming in the Chattogram and Cox’s Bazar districts of Bangladesh. Our analysis revealed substantial differences in SCM prevalence based on farm management practices, cow breeds, and farming operations. We explored the severe production and financial losses associated with SCM, with notable variations in milk constituents across different cow breeds. Furthermore, the study demonstrates the considerable economic benefits of early diagnosis and treatment of SCM, emphasizing the critical need for improved management and detection strategies in the region.</p>\r\n\r\n<p>The male participant at the farm ownership level stands at 81.9%, significantly surpassing female ownership, contrary to previous findings indicating a notable rise in female involvement in livestock farming, increasing from 43% to 69% [<a href=\"#r-34\">34</a>]. This surge in female empowerment is largely attributed to substantial support from various NGOs and governmental initiatives to enhance women's societal status. In this study, the largest age group was identified as those between 46-60 years, accounting for 48.3% (95% CI: 38.9-57.7%) of the total participants. This finding aligns closely with research conducted in the Barind area, Dinajpur, and Khagrachari districts of Bangladesh, where the predominant age group was approximately 31-50 years [35,36]. The education levels among the farm owners in this study varied significantly (<em>P</em> = 0.029), with the majority holding higher secondary education, comprising 52.6% (95% CI: 43.6-61.9%) of the total sample, compared to those with graduation or primary education. This result contrasts with findings from other studies in the Barind area and Panchagarh district, where the majority of farm owners had only completed primary education, and in Khagrachari district, where most farm owners were illiterate [<a href=\"#r-35\">35–38</a>]. Educated farmers are more likely to adopt improved management practices, such as regular cleaning and disinfection of milking equipment, proper milking techniques, and timely identification and treatment of mastitis cases. Jeelani <em>et al.</em><strong> </strong>[<a href=\"#r-39\">39</a>] found a significant association between udder hygiene scores and management practices in dairy farms. Proper udder hygiene and management were linked to lower somatic cell counts, indicating better udder health and reduced incidence of SCM. Additionally, small (Farms having less than 10 cows) and medium (Farms having less than 11-30 cows) sized farms were the most prevalent, comprising 44% and 48.3%, respectively, closely aligning with findings from other studies in Bangladesh [<a href=\"#r-35\">35,36,40</a>].</p>\r\n\r\n<p>In this study, the prevalence of SCM in cattle was found to be highest in the Chattogram district, at 76.8% (43/56, 95% CI: 63.6-87.0). This finding closely aligns with a previous study in Chattogram, which reported a prevalence of 70% [<a href=\"#r-41\">41</a>]. Other studies have reported varying prevalence rates: 32.43% and 34.2% in Chattogram, and 53% in Jhenaidah, which do not align with our findings [<a href=\"#r-42\">42–44</a>]. Internationally, SCM prevalence has been reported at 53% in Kenya, 36.4%-50.2% in China, 50% in Colombia, and 62% in Rwanda, showing some variation from our study results [45–48]. Intensive management systems demonstrated a significantly higher prevalence of SCM in dairy cattle at 84.5% compared to semi-intensive farming, consistent with findings from a study in Welimada, Sri Lanka, where intensive farms had a prevalence of 61% [<a href=\"#r-49\">49</a>]. Intensive management system causes an increased frequency of SCM due to increased stress and overcrowding, which can compromise the immune system and create an environment conducive to bacterial growth [<a href=\"#r-50\">50</a>]. Additionally, the frequent and close contact among animals in these systems facilitates the transmission of mastitis-causing pathogens. Concerning flooring types, SCM prevalence was highest on concrete floors at 86.5%, contrasting with another study where soil-type floors were found to increase SCM occurrence in cattle [<a href=\"#r-51\">51</a>]. Additionally, crossbred cows exhibited a higher prevalence of SCM at 47.2% compared to indigenous breeds, aligning with the findings of other studies [<a href=\"#r-52\">52,53</a>].</p>\r\n\r\n<p>Our study revealed significant alterations in milk constituents due to SCM in cows from the Chattogram and Cox's Bazar districts of Bangladesh. These alterations encompassed both physico-chemical properties and chemical components of milk. Mammary gland inflammation can lead to alterations in milk composition due to localized effects. Serum components may enter milk, and specific milk constituents typically migrate from the alveolar lumen to the perivascular area leading to changes in milk components [<a href=\"#r-9\">9</a>]. Physically, SCM increased in milk density, specific gravity, and acidity, indicating potential changes in milk composition influenced by inflammatory processes. Chemically, SCM decreased fat, solid-not-fat (SNF), lactose, and mineral contents in milk. The findings of this study are aligned with the findings of another study [<a href=\"#r-54\">54</a>]. The decrease in fat percentage from 3.4% to 2.9%, and reductions in calcium, phosphorus, and potassium levels underscored the metabolic shifts and inflammatory responses associated with SCM. Similar findings were also reported previously [<a href=\"#r-32\">32</a>]. Similarly, a study was conducted in Egypt on Holstein Friesian cows and observed similar kinds of changes due to the effects of SCM [<a href=\"#r-55\">55</a>].</p>\r\n\r\n<p>The changes in protein fractions observed were also remarkable, with significant (<em>P</em><0.001) increases in immunoglobulin with concomitant reductions of α-lactalbumin and β-lactoglobulin levels discovered from the present study. The level of immunoglobulins in SCM milk increased significantly (7.4 to 26.1). The increased level is due to the immune response caused by infection [<a href=\"#r-56\">56</a>]. The SCM pathogens provoke an immune response leading to a larger production of immunoglobulins (antibodies), in the bovine milk, following the body’s defense mechanism [<a href=\"#r-57\">57</a>]. In SCM milk, the level of α-lactalbumin decreases to 22.1 in our study. Specifically, regarding proteins, a reduction in the key lactose-synthesis protein alpha-lactalbumin during infection could indicate impaired synthetic activity in the mammary gland [<a href=\"#r-58\">58</a>] . This impairment may lead to lower lactose production and milk quality issues. Our study showed a big drop in beta-lactoglobulin (from 54.7 to only 34.2). As a key whey protein, significantly reduced beta-lactoglobulin expression was observed and may be associated with alterations in milk protein synthesis and secretion pathways during SCM [<a href=\"#r-59\">59</a>]. Inflammation and tissue damage may also influence the secretion of this protein [<a href=\"#r-59\">59,60</a>]</p>\r\n\r\n<p>This rise was closely linked to the high albumin concentrations, which are a pro-inflammatory factor targeted at repairing damaged tissue [<a href=\"#r-48\">48</a>, <a href=\"#r-50\">50</a>]. One of these functions is that albumin works as a carrier protein, it can be upregulated by inflammatory stimuli to help in repairing tissues and immune responses [<a href=\"#r-32\">32</a>,<a href=\"#r-55\">55–57</a>].</p>\r\n\r\n<p>These changes reflect the immune system's response to SCM, affecting milk quality and potentially compromising its nutritional value. The elevated albumin content further indicates tissue damage and inflammation within the mammary gland, contributing to overall milk quality deterioration. The slight reduction in pre-albumin further reflects the broader impact of SCM on the protein synthesis machinery of the mammary gland [<a href=\"#r-32\">32</a>,<a href=\"#r-55\">55</a>]. Our findings aligned with previous research highlighting the detrimental effects of SCM on milk quality. Studies by Goncalves <em>et al.</em> [<a href=\"#r-32\">32</a>] and Dufour <em>et al.</em> [<a href=\"#r-9\">9</a>] similarly reported reductions in fat and protein contents, alongside changes in mineral composition in SCM-affected milk. These consistent findings emphasize the universal impact of SCM on milk composition across different geographical regions and cattle breeds [<a href=\"#r-32\">32</a>,<a href=\"#r-55\">55–57</a>]. In Crossbred and Holstein Friesian cows, SCM led to considerable negative impacts on key reproductive metrics, as evidenced by increased calving intervals and days open, along with reduced conception rates in Holstein Friesian cows. The significant reduction in milk progesterone levels across all breeds suggests a possible hormonal imbalance associated with SCM, which may contribute to impaired reproductive performance. Indigenous breeds showed relatively minimal effects, highlighting potential breed-specific resilience to SCM-related reproductive challenges. Similar findings were also observed by Waseem <em>et al.</em> [<a href=\"#r-15\">15</a>].</p>\r\n\r\n<p>The findings of our study showed the significant economic impact of SCM on dairy production, highlighting the need for effective management strategies. Effective measures to address SCM include improving diagnostic techniques, adopting better farm management and hygiene practices, and promoting farmer awareness programs. Additionally, prioritizing studies on antimicrobial resistance, breed susceptibility, nutritional interventions, and sustainable farming practices can significantly enhance disease prevention and control. SCM affects various breeds differently, with Holstein Friesians experiencing the highest production losses, followed by crossbred and indigenous cows [<a href=\"#r-4\">4</a>].</p>\r\n\r\n<p>Early diagnosis and treatment of SCM present clear economic advantages, as the study details. For crossbred cows, early intervention prevents a substantial production loss of 44,893.6 TK, with treatment costs amounting to only 6074.8 TK, resulting in a net benefit of 38,818.8 TK per cow per lactation. Holstein Friesian cows exhibit even greater benefits, avoiding a loss of 121,754.1 TK with an expenditure of 10,386.6 TK, yielding a benefit of 111,367.5 TK per cow per lactation. Though incurring lower absolute losses, Indigenous cows still benefit from early treatment, with a net gain of 3317.6 TK per cow per lactation.</p>\r\n\r\n<p>The analysis highlights that the financial benefits of early diagnosis and treatment of SCM far outweigh the costs. Proactive measures include regular screening using CMT and MWST, maintaining strict milking hygiene, ensuring proper under-health management, providing balanced nutrition, and implementing targeted antimicrobial therapies based on susceptibility testing to reduce the overall economic burden, enhance milk production efficiency, and improve the profitability of dairy farming [<a href=\"#r-33\">33</a>]. The reduction in production loss, coupled with manageable treatment costs, underscores the importance of early detection systems and prompt veterinary intervention [<a href=\"#r-8\">8</a>,<a href=\"#r-33\">33</a>]. Additionally, addressing SCM early prevents the long-term damage caused by recurrent SCM, preserving the health and productivity of dairy herds [<a href=\"#r-33\">33</a>].</p>\r\n\r\n<p>The economic analysis reinforces the critical need for early diagnosis and effective treatment protocols for SCM in dairy cows [<a href=\"#r-61\">61</a>]. The substantial financial benefits justify the investment in early intervention, making it a cost-effective strategy for sustaining dairy production and profitability [<a href=\"#r-62\">62</a>]. This study limits the hill tract area only which did not generalize the whole scenario of SCM in Bangladesh. We overlooked the economic analysis of CM. The economic losses due to CM should be explored in further investigations. </p>"
},
{
"section_number": 5,
"section_title": "CONCLUSIONS",
"body": "<p>This study reveals the high prevalence of SCM in dairy farms across Chattogram and Cox’s Bazar districts, with variations linked to socio-demographic, farm management, and animal-level factors. Key influences include age, breed, lactation stage, and parity, with medium-sized and intensively managed farms showing higher SCM rates, necessitating targeted interventions. SCM significantly alters milk's physical, chemical, and mineral properties, diminishing its economic and nutritional value. Additionally, it negatively affects milk protein fractions along with some key reproductive parameters, posing health and economic challenges for farmers. The findings highlight the need for improved farm management, awareness campaigns, and routine diagnostic practices to mitigate SCM. Region-specific strategies and policies are essential to reduce SCM prevalence, limit economic losses, and ensure the sustainability of Bangladesh’s dairy sector.</p>"
},
{
"section_number": 6,
"section_title": "ACKNOWLEDGEMENTS",
"body": "<p>The authors wish to express their gratitude to the dairy farmers and animal handlers, whose cooperation was significant in the collection of milk samples for this study. Furthermore, our sincere appreciation goes to the Department of Dairy Science at Sylhet Agricultural University, Sylhet, Bangladesh, for their support and collaboration, for the successful completion of this research.</p>"
},
{
"section_number": 7,
"section_title": "AUTHOR CONTRIBUTIONS",
"body": "<p>MPM, HH, KAB– Conceptualization, Methodology, Data Curation, Software, Formal Analysis, Investigation, Writing – Original Draft, Writing – Review and Editing; MI, MR, SIR, MM, MSH, – Data Curation, Investigation, Laboratory work, Formal Analysis, Writing-reviewing and editing, MSRC and MA- Data Curation, Formal Analysis, Writing – Original Draft, Writing – Review and Editing; MNH, AA, MMR and MMR – Conceptualization, Methodology, Data Curation, Software, Formal Analysis, Investigation, Validation, Visualization, Resources, Project Administration, Supervision, Writing – Original Draft, Writing – Review and Editing. All authors have approved the final version of the manuscript.</p>"
},
{
"section_number": 8,
"section_title": "CONFLICTS OF INTEREST",
"body": "<p>There is no conflict of interest among the authors.</p>"
}
],
"figures": [
{
"figure": "https://jabet.bsmiab.org/media/article_images/2025/36/28/178-1729709059-Figure1.jpg",
"caption": "Figure 1. The study area map shows the selected district and sub-district of the experiment. The map was created using ArcMap 10.8.",
"featured": false
},
{
"figure": "https://jabet.bsmiab.org/media/article_images/2025/36/28/178-1729709059-Figure2.jpg",
"caption": "Figure 2. A) Frequency of SCM on CMT positive quarters. Ns: Non-significant, *P<0.05, **P<0.01, ***P<0.001. B) SCM positive results on the basis of CMT grading.",
"featured": true
},
{
"figure": "https://jabet.bsmiab.org/media/article_images/2025/36/28/178-1729709059-Figure3.jpg",
"caption": "Figure 3. Comparative assessment (Normal vs SCM milk) of milk due to the effects of SCM. A) Changes of physical properties of milk due to SCM compared with normal healthy milk. B) Changes of chemical properties of milk due to SCM. C) Minerals and albumin. D) Level of protein fractions. [ns: non-significant, *p<0.05, **p<0.01, ***p<0.001, Independent sample t-test]",
"featured": false
}
],
"authors": [
{
"id": 1597,
"affiliation": [
{
"affiliation": "Department of Dairy Science, Sylhet Agricultural University, Sylhet-3100, Bangladesh"
}
],
"first_name": "Md. Piplu",
"family_name": "Mia",
"email": null,
"author_order": 1,
"ORCID": "https://orcid.org/0000-0002-7048-8043",
"corresponding": false,
"co_first_author": true,
"co_author": false,
"corresponding_author_info": "",
"article": 322
},
{
"id": 1598,
"affiliation": [
{
"affiliation": "Department of Anatomy and Histology, Sylhet Agricultural University, Sylhet-3100, Bangladesh"
}
],
"first_name": "Hemayet",
"family_name": "Hossain",
"email": null,
"author_order": 2,
"ORCID": "https://orcid.org/0000-0001-9785-2549",
"corresponding": false,
"co_first_author": true,
"co_author": false,
"corresponding_author_info": "",
"article": 322
},
{
"id": 1599,
"affiliation": [
{
"affiliation": "Department of Zoology (GSSC), University of Dhaka, Dhaka-1000, Bangladesh"
}
],
"first_name": "Khadiza Akter",
"family_name": "Brishty",
"email": null,
"author_order": 3,
"ORCID": "https://orcid.org/0000-0001-9380-2579",
"corresponding": false,
"co_first_author": true,
"co_author": false,
"corresponding_author_info": "",
"article": 322
},
{
"id": 1600,
"affiliation": [
{
"affiliation": "Department of Medicine, Sylhet Agricultural University, Sylhet-3100, Bangladesh"
}
],
"first_name": "Md. Shahidur Rahman",
"family_name": "Chowdhury",
"email": null,
"author_order": 4,
"ORCID": "https://orcid.org/0000-0003-0210-6581",
"corresponding": false,
"co_first_author": false,
"co_author": false,
"corresponding_author_info": "",
"article": 322
},
{
"id": 1601,
"affiliation": [
{
"affiliation": "Department of Agriculture and Environmental Sciences; Lincoln University, MO 65101, USA"
}
],
"first_name": "Md.",
"family_name": "Imranuzzaman",
"email": null,
"author_order": 5,
"ORCID": "https://orcid.org/0000-0002-3052-5727",
"corresponding": false,
"co_first_author": false,
"co_author": false,
"corresponding_author_info": "",
"article": 322
},
{
"id": 1602,
"affiliation": [
{
"affiliation": "Department of Dairy & Poultry Science; Hajee Mohammad Danesh Science and Technology University, Dinajpur-5200, Bangladesh"
}
],
"first_name": "Mostafizor",
"family_name": "Rahman",
"email": null,
"author_order": 6,
"ORCID": null,
"corresponding": false,
"co_first_author": false,
"co_author": false,
"corresponding_author_info": "",
"article": 322
},
{
"id": 1603,
"affiliation": [
{
"affiliation": "Department of Chemistry (EMC); University of Dhaka, Dhaka-1000, Bangladesh"
}
],
"first_name": "Sadia Islam",
"family_name": "Ria",
"email": null,
"author_order": 7,
"ORCID": null,
"corresponding": false,
"co_first_author": false,
"co_author": false,
"corresponding_author_info": "",
"article": 322
},
{
"id": 1604,
"affiliation": [
{
"affiliation": "Faculty of Veterinary Medicine; Chattogram Veterinary and Animal Sciences University, Chattogram-4202, Bangladesh"
}
],
"first_name": "Milon",
"family_name": "Mia",
"email": null,
"author_order": 8,
"ORCID": null,
"corresponding": false,
"co_first_author": false,
"co_author": false,
"corresponding_author_info": "",
"article": 322
},
{
"id": 1605,
"affiliation": [
{
"affiliation": "Faculty of Veterinary, Animal and Biomedical Sciences, Sylhet Agricultural University, Sylhet-3100, Bangladesh"
}
],
"first_name": "Md Saidul",
"family_name": "Haque",
"email": null,
"author_order": 9,
"ORCID": null,
"corresponding": false,
"co_first_author": false,
"co_author": false,
"corresponding_author_info": "",
"article": 322
},
{
"id": 1606,
"affiliation": [
{
"affiliation": "Department of Dairy Science, Sylhet Agricultural University, Sylhet-3100, Bangladesh"
}
],
"first_name": "Md. Ashik-Uz-",
"family_name": "Zaman",
"email": null,
"author_order": 10,
"ORCID": null,
"corresponding": false,
"co_first_author": false,
"co_author": false,
"corresponding_author_info": "",
"article": 322
},
{
"id": 1607,
"affiliation": [
{
"affiliation": "Department of Genetics and Animal Breeding, Sylhet Agricultural University, Sylhet-3100, Bangladesh"
}
],
"first_name": "Md. Nazmul",
"family_name": "Haque",
"email": null,
"author_order": 11,
"ORCID": null,
"corresponding": false,
"co_first_author": false,
"co_author": false,
"corresponding_author_info": "",
"article": 322
},
{
"id": 1608,
"affiliation": [
{
"affiliation": "Department of Dairy Science, Sylhet Agricultural University, Sylhet-3100, Bangladesh"
}
],
"first_name": "Anzuman",
"family_name": "Ara",
"email": "anzuman.ds@sau.ac.bd",
"author_order": 12,
"ORCID": null,
"corresponding": true,
"co_first_author": false,
"co_author": false,
"corresponding_author_info": "Anzuman Ara, Department of Dairy Science, Sylhet Agricultural University, Sylhet-3100, Bangladesh. Email: anzuman.ds@sau.ac.bd",
"article": 322
},
{
"id": 1609,
"affiliation": [
{
"affiliation": "Department of Pathology, Sylhet Agricultural University, Sylhet-3100, Bangladesh"
}
],
"first_name": "Md. Masudur",
"family_name": "Rahman",
"email": null,
"author_order": 13,
"ORCID": "https://orcid.org/0000-0001-7095-9303",
"corresponding": false,
"co_first_author": false,
"co_author": false,
"corresponding_author_info": "",
"article": 322
},
{
"id": 1610,
"affiliation": [
{
"affiliation": "Department of Medicine, Sylhet Agricultural University, Sylhet-3100, Bangladesh"
}
],
"first_name": "Md. Mahfujur",
"family_name": "Rahman",
"email": "mahfuj.vetmed@sau.ac.bd",
"author_order": 14,
"ORCID": "https://orcid.org/0000-0003-2062-8471",
"corresponding": true,
"co_first_author": false,
"co_author": false,
"corresponding_author_info": "Md. Mahfujur Rahman, Department of Medicine, Sylhet Agricultural University, Sylhet-3100, Bangladesh.\r\nEmail: mahfuj.vetmed@sau.ac.bd",
"article": 322
}
],
"views": 558,
"downloads": 72,
"references": [
{
"id": 13383,
"serial_number": 1,
"pmc": null,
"reference": "FAO. World Food and Agriculture – Statistical Yearbook. Rome, 2021.",
"DOI": null,
"article": 322
},
{
"id": 13384,
"serial_number": 2,
"pmc": null,
"reference": "Cheng WN, Han SG. Bovine mastitis: risk factors, therapeutic strategies, and alternative treatments — A review. Asian-Australas J Anim Sci. 2020; 33:1699.",
"DOI": null,
"article": 322
},
{
"id": 13385,
"serial_number": 3,
"pmc": null,
"reference": "Arikan M, Mat B, et al. Determination of Subclinical Mastitis Prevalence in Dairy Cows in Türkiye through Meta Analysis and Production Loss Calculation. Pak Vet J. 2024; 44:391-399.",
"DOI": null,
"article": 322
},
{
"id": 13386,
"serial_number": 4,
"pmc": null,
"reference": "Ruegg PL. A 100-Year Review: Mastitis detection, management, and prevention. J Dairy Sci. 2017; 100:10381–97.",
"DOI": null,
"article": 322
},
{
"id": 13387,
"serial_number": 5,
"pmc": null,
"reference": "Hoque MF, Mehedi AF, et al. Prevalence and antibiotic susceptibility profile of Staphylococcus aureus in clinical and subclinical mastitis milk samples. Bangladesh J Vet Med. 2023; 21:27-37.",
"DOI": null,
"article": 322
},
{
"id": 13388,
"serial_number": 6,
"pmc": null,
"reference": "Panchal J, Patel A, et al. Understanding mastitis: Microbiome, control strategies, and prevalence – A comprehensive review. Microb Pathog. 2024; 187:106533.",
"DOI": null,
"article": 322
},
{
"id": 13389,
"serial_number": 7,
"pmc": null,
"reference": "Singha S, Ericsson CD, et al. Occurrence and aetiology of subclinical mastitis in water buffalo in Bangladesh. J Dairy Res. 2021; 88:314–20.",
"DOI": null,
"article": 322
},
{
"id": 13390,
"serial_number": 8,
"pmc": null,
"reference": "Kour S, Sharma N, et al. Advances in Diagnostic Approaches and Therapeutic Management in Bovine Mastitis. Vet Sci. 2023; 10:449.",
"DOI": null,
"article": 322
},
{
"id": 13391,
"serial_number": 9,
"pmc": null,
"reference": "Dufour S, Fréchette A, et al. Invited review: Effect of udder health management practices on herd somatic cell count. J Dairy Sci. 2011; 94:563–79.",
"DOI": null,
"article": 322
},
{
"id": 13392,
"serial_number": 10,
"pmc": null,
"reference": "Tomanić D, Samardžija M, et al. Alternatives to Antimicrobial Treatment in Bovine Mastitis Therapy: A Review. Antibiotics (Basel). 2023; 12:683.",
"DOI": null,
"article": 322
},
{
"id": 13393,
"serial_number": 11,
"pmc": null,
"reference": "Tommasoni C, Fiore E, et al. Mastitis in Dairy Cattle: On-Farm Diagnostics and Future Perspectives. Animals. 2023; 13:2538.",
"DOI": null,
"article": 322
},
{
"id": 13394,
"serial_number": 12,
"pmc": null,
"reference": "Singh AK. A comprehensive review on subclinical mastitis in dairy animals: Pathogenesis, factors associated, prevalence, economic losses and management strategies. CABI Reviews. 2022; 17:057.",
"DOI": null,
"article": 322
},
{
"id": 13395,
"serial_number": 13,
"pmc": null,
"reference": "Bhakat C, Mohammad A, et al. Effect of dry period duration on udder health, milk production and body condition of jersey crossbred cows at lower gangetic tropics. Indian J Anim Res. 2021; 55:985–9.",
"DOI": null,
"article": 322
},
{
"id": 13396,
"serial_number": 14,
"pmc": null,
"reference": "Chowdhury MdS, Rahman MdM, et al. Subclinical Mastitis of Buffaloes in Asia: Prevalence, Pathogenesis, Risk Factors, Antimicro-bial resistance, and Current Treatment Strategies. J Anim Sci. 2024.",
"DOI": null,
"article": 322
},
{
"id": 13397,
"serial_number": 15,
"pmc": null,
"reference": "Waseem GM, Bin L, et al. Impact of Subclinical Mastitis on Reproductive Performance of Dairy Animals. Int J Vet Sci Res. 2019; 5:48–57.",
"DOI": null,
"article": 322
},
{
"id": 13398,
"serial_number": 16,
"pmc": null,
"reference": "Tiwari JG, Babra C, et al. Trends in therapeutic and prevention strategies for management of Bovine Mastitis: An overview. J Vaccines Vaccin. 2013; 4:1-11.",
"DOI": null,
"article": 322
},
{
"id": 13399,
"serial_number": 17,
"pmc": null,
"reference": "Halasa T, Huijps K, et al. Economic effects of bovine mastitis and mastitis management: A review. Veterinary Quarterly. 2007; 29:18–31.",
"DOI": null,
"article": 322
},
{
"id": 13400,
"serial_number": 18,
"pmc": null,
"reference": "Hogeveen H, Steeneveld W, et al. Production Diseases Reduce the Efficiency of Dairy Production: A Review of the Results, Methods, and Approaches Regarding the Economics of Mastitis. Annu Rev Resour Economics. Annual Reviews Inc.; 2019. p. 289–312.",
"DOI": null,
"article": 322
},
{
"id": 13401,
"serial_number": 19,
"pmc": null,
"reference": "Gröhn YT, Wilson DJ, et al. Effect of pathogen-specific clinical mastitis on milk yield in dairy cows. J Dairy Sci. 2004; 87:3358–74.",
"DOI": null,
"article": 322
},
{
"id": 13402,
"serial_number": 20,
"pmc": null,
"reference": "Seegers H, Fourichon C, et al. Production effects related to mastitis and mastitis economics in dairy cattle herds. Vet Res. 2003; 34:475–91.",
"DOI": null,
"article": 322
},
{
"id": 13403,
"serial_number": 21,
"pmc": null,
"reference": "Oliver SP, Murinda SE, et al. Impact of Antibiotic Use in Adult Dairy Cows on Antimicrobial Resistance of Veterinary and Human Pathogens: A Comprehensive Review. Foodborne Pathog Dis. 2011; 8:337–55.",
"DOI": null,
"article": 322
},
{
"id": 13404,
"serial_number": 22,
"pmc": null,
"reference": "Beyene T, Hayishe H, et al. Prevalence and antimicrobial resistance profile of Staphylococcus in dairy farms, abattoir and humans in Addis Ababa, Ethiopia. BMC Res Notes. 2017; 10:1–9.",
"DOI": null,
"article": 322
},
{
"id": 13405,
"serial_number": 23,
"pmc": null,
"reference": "Sharma C, Rokana N, et al. Antimicrobial Resistance: Its Surveillance, Impact, and Alternative Management Strategies in Dairy Animals. Front Vet Sci. 2018; 4:237.",
"DOI": null,
"article": 322
},
{
"id": 13406,
"serial_number": 24,
"pmc": null,
"reference": "Mbindyo CM, Gitao GC, et al. Prevalence, Etiology, and Risk Factors of Mastitis in Dairy Cattle in Embu and Kajiado Counties, Kenya. Vet Med Int. 2020;2020: 8831172.",
"DOI": null,
"article": 322
},
{
"id": 13407,
"serial_number": 25,
"pmc": null,
"reference": "Tomanić D, Božin B, et al. Environmental Bovine Mastitis Pathogens: Prevalence, Antimicrobial Susceptibility, and Sensitivity to Thymus vulgaris L., Thymus serpyllum L., and Origanum vulgare L. Essential Oils. Antibiotics. 2022; 11:1077.",
"DOI": null,
"article": 322
},
{
"id": 13408,
"serial_number": 26,
"pmc": null,
"reference": "Naser JA, Hossain H, et al. Exploring of spectrum beta lactamase producing multidrug-resistant Salmonella enterica serovars in goat meat markets of Bangladesh. Vet Anim Sci. 2024; 25:100367.",
"DOI": null,
"article": 322
},
{
"id": 13409,
"serial_number": 27,
"pmc": null,
"reference": "Rahman MM, Hossain H, et al. Molecular Characterization of Multidrug-Resistant and Extended-Spectrum β-Lactamases-Producing Salmonella enterica Serovars Enteritidis and Typhimurium Isolated from Raw Meat in Retail Markets. Antibiotics (Basel). 2024; 13:586.",
"DOI": null,
"article": 322
},
{
"id": 13410,
"serial_number": 28,
"pmc": null,
"reference": "Farabi AA, Hossain H, et al. Prevalence, Risk Factors, and Antimicrobial Resistance of Staphylococcus and Streptococcus Species Isolated from Subclinical Bovine Mastitis. Foodborne Pathog Dis. 2024; PMID: 39479784.",
"DOI": null,
"article": 322
},
{
"id": 13411,
"serial_number": 29,
"pmc": null,
"reference": "NMC Protocols, Guidelines and Procedures - National Mastitis Council. 2004.",
"DOI": null,
"article": 322
},
{
"id": 13412,
"serial_number": 30,
"pmc": null,
"reference": "Emon AA, Hossain H, et al. Prevalence, antimicrobial susceptibility profiles and resistant gene identification of bovine subclinical mastitis pathogens in Bangladesh. Heliyon. 2024; 10: e34567.",
"DOI": null,
"article": 322
},
{
"id": 13413,
"serial_number": 31,
"pmc": null,
"reference": "Rahman MM, Islam MR et al. Prevalence of subclinical mastitis in dairy cows reared in Sylhet district of Bangladesh. Int J BioRes. 2010; 1:23-28.",
"DOI": null,
"article": 322
},
{
"id": 13414,
"serial_number": 32,
"pmc": null,
"reference": "Gonçalves JL, Freu G, et al. Effect of bovine subclinical mastitis on milk production and economic performance of Brazilian dairy farms. Braz J Vet Res Anim Sci. 2023; 60: e208514–e208514.",
"DOI": null,
"article": 322
},
{
"id": 13415,
"serial_number": 33,
"pmc": null,
"reference": "Jingar S, Singh M, et al. Economic Loss due to Clinical Mastitis in Crossbred Cows. Dairy and Vet Sci J. 2017; 3:555606.",
"DOI": null,
"article": 322
},
{
"id": 13416,
"serial_number": 34,
"pmc": null,
"reference": "Mostari MP, Sadrul SB, et al. Women Empowerment and Livestock Development in Bangladesh: A Review. Bangladesh J Livest Res. 2021; 28:1–15.",
"DOI": null,
"article": 322
},
{
"id": 13417,
"serial_number": 35,
"pmc": null,
"reference": "Islam MA, Hossain MN, et al. Socio-economic Profile of Goat Rearing Farmers and Their Management Practices in Sylhet, Bangladesh. J Agric Ecol. 2018; 15:1–10.",
"DOI": null,
"article": 322
},
{
"id": 13418,
"serial_number": 36,
"pmc": null,
"reference": "Haque M, Sarder M, et al. Socio-Demographic Study of the Farmers of Barind Area of Bangladesh. J Earth Environ Sci. 2020; 4:194.",
"DOI": null,
"article": 322
},
{
"id": 13419,
"serial_number": 37,
"pmc": null,
"reference": "Hossain S, Amin M, et al. A socioeconomic investigation on the cattle rearing farmers in selected areas of Bangladesh. Glob J Agric Econ Econometr. 2020; 8:1–8.",
"DOI": null,
"article": 322
},
{
"id": 13420,
"serial_number": 38,
"pmc": null,
"reference": "Karim R, Islam MN, et al. Livelihood improvement of farmers through cattle fattening of Mymensingh District: A socio-economic study. J Agric Food Environ. 2020; 01:01–5.",
"DOI": null,
"article": 322
},
{
"id": 13421,
"serial_number": 39,
"pmc": null,
"reference": "Jeelani R, Asma Khan I, et al. Role of management in dairy udder health. Pharm Innov. 2022; 11:1337–46.",
"DOI": null,
"article": 322
},
{
"id": 13422,
"serial_number": 40,
"pmc": null,
"reference": "Halder SR and Barua P. Dairy production, consumption and marketing in Bangladesh. Econ Stud. 2003; 19:190–219.",
"DOI": null,
"article": 322
},
{
"id": 13423,
"serial_number": 41,
"pmc": null,
"reference": "Mohiuddin MA. Study on Prevalence of sub clinical mastitis in dairy cows in some selected dairy farms under Chittagong district. 2009.",
"DOI": null,
"article": 322
},
{
"id": 13424,
"serial_number": 42,
"pmc": null,
"reference": "Barua M, Prodhan MAM, et al. Sub-clinical mastitis prevalent in dairy cows in Chittagong district of Bangladesh: Detection by different screening tests. Vet World. 2014; 7:483–8.",
"DOI": null,
"article": 322
},
{
"id": 13425,
"serial_number": 43,
"pmc": null,
"reference": "Sayeed MA, Rahman MA, et al. Prevalence of Subclinical Mastitis and Associated Risk Factors at Cow Level in Dairy Farms in Jhenaidah, Bangladesh. Adv Anim Vet Sci. 2020; 8:112–21.",
"DOI": null,
"article": 322
},
{
"id": 13426,
"serial_number": 44,
"pmc": null,
"reference": "Islam S, Barua SR, et al. Epidemiology of Sub-Clinical Mastitis in Dairy Cows in Urban Areas of Chittagong, Bangladesh. Turk J Agric Food Sci Tech. 2019; 7:845–50.",
"DOI": null,
"article": 322
},
{
"id": 13427,
"serial_number": 45,
"pmc": null,
"reference": "Chen X, Chen Y, et al. Prevalence of subclinical mastitis among dairy cattle and associated risks factors in China during 2012–2021: A systematic review and meta-analysis. Res Vet Sci. 2022; 148:65–73.",
"DOI": null,
"article": 322
},
{
"id": 13428,
"serial_number": 46,
"pmc": null,
"reference": "Michira L, Kagira J, et al. Prevalence of subclinical mastitis, associated risk factors and antimicrobial susceptibility pattern of bacteria isolated from milk of dairy cattle in Kajiado Central sub-county, Kenya. Vet Med Sci. 2023; 9:2885–92.",
"DOI": null,
"article": 322
},
{
"id": 13429,
"serial_number": 47,
"pmc": null,
"reference": "Medrano-Galarza C, Ahumada-Beltrán DG, et al. Prevalence, incidence and risk factors of subclinical mastitis in specialized dairies in Colombia. Agronomía Mesoamericana. 2021; 32:487–507.",
"DOI": null,
"article": 322
},
{
"id": 13430,
"serial_number": 48,
"pmc": null,
"reference": "Ndahetuye JB, Twambazimana J, et al. A cross sectional study of prevalence and risk factors associated with subclinical mastitis and intramammary infections, in dairy herds linked to milk collection centers in Rwanda. Prev Vet Med. 2020;179.",
"DOI": null,
"article": 322
},
{
"id": 13431,
"serial_number": 49,
"pmc": null,
"reference": "Bandara D, Premaratne S, et al. Production and Economic Characteristics of Intensive and Semi- Intensive Dairy Cattle Management Systems in Vegetable Based Farming System in Welimada, Sri Lanka. Trop Agric Res. 2011; 22:314.",
"DOI": null,
"article": 322
},
{
"id": 13432,
"serial_number": 50,
"pmc": null,
"reference": "Ali A, Ganie SA, et al. Risk factors associated with subclinical mastitis in dairy cows reared in district Ganderbal, Jammu and Kashmir. J Vet Anim Sci. 2021; 52:418-422.",
"DOI": null,
"article": 322
},
{
"id": 13433,
"serial_number": 51,
"pmc": null,
"reference": "Kabir MH, Ershaduzzaman M, et al. Prevalence and identification of subclinical mastitis in cows at BLRI Regional Station, Sirajganj, Bangladesh. J Adv Vet Anim Res. 2017; 4:295–300.",
"DOI": null,
"article": 322
},
{
"id": 13434,
"serial_number": 52,
"pmc": null,
"reference": "Islam MA, Shanta SA, et al. Effect of floor on welfare of lactating cows in small farms of Sirajgonj district, Bangladesh. Res Agric Livest Fish. 2020; 7:87–95.",
"DOI": null,
"article": 322
},
{
"id": 13435,
"serial_number": 53,
"pmc": null,
"reference": "Kayesh M, Talukder M, et al. Prevalence of subclinical mastitis and its association with bacteria and risk factors in lactating cows of Barisal district in Bangladesh. Int J BioRes. 2014;2:35-38.",
"DOI": null,
"article": 322
},
{
"id": 13436,
"serial_number": 54,
"pmc": null,
"reference": "Hassan A, H.J A. Variations in milk composition of some farm animals resulted by sub-clinical mastitis in Al-Diwania province. Basrah Journal of Veterinary Research. 2013; 12:17–24.",
"DOI": null,
"article": 322
},
{
"id": 13437,
"serial_number": 55,
"pmc": null,
"reference": "Youssif NH, Hafiz NM, et al. Impact of subclinical mastitis on milk quality in different seasons. Int J Vet Sci. 2020; 9:313–6.",
"DOI": null,
"article": 322
},
{
"id": 13438,
"serial_number": 56,
"pmc": null,
"reference": "Tiwari JG, Babra C, et al. Trends in therapeutic and prevention strategies for management of bovine mastitis: An overview. J Vaccines Vaccin. 2013; 4:176.",
"DOI": null,
"article": 322
},
{
"id": 13439,
"serial_number": 57,
"pmc": null,
"reference": "Tuaillon E, Viljoen J, et al. Subclinical mastitis occurs frequently in association with dramatic changes in inflammatory/anti-inflammatory breast milk components. Pediatr Res. 2017; 81:556–64.",
"DOI": null,
"article": 322
},
{
"id": 13440,
"serial_number": 58,
"pmc": null,
"reference": "Bionaz M, Hurley W, et al. Milk Protein Synthesis in the Lactating Mammary Gland: Insights from Transcriptomics Analyses. Milk Protein. 2012.",
"DOI": null,
"article": 322
},
{
"id": 13441,
"serial_number": 59,
"pmc": null,
"reference": "Aich R, Batabyal S, et al. Isolation and purification of beta-lactoglobulin from cow milk. Vet World. 2015; 8:621.",
"DOI": null,
"article": 322
},
{
"id": 13442,
"serial_number": 60,
"pmc": null,
"reference": "Melnik BC, John SM, et al. The Role of Cow’s Milk Consumption in Breast Cancer Initiation and Progression. Curr Nutr Rep. 2023; 12:122.",
"DOI": null,
"article": 322
},
{
"id": 13443,
"serial_number": 61,
"pmc": null,
"reference": "Dejyong T, Chanachai K, et al. An economic analysis of high milk somatic cell counts in dairy cattle in Chiang Mai, Thailand. Front Vet Sci. 2022; 9:958163.",
"DOI": null,
"article": 322
},
{
"id": 13444,
"serial_number": 62,
"pmc": null,
"reference": "Hogeveen H, Huijps K, et al. Economic aspects of mastitis: New developments. N Z Vet J. 2011; 59:16–23.",
"DOI": null,
"article": 322
}
]
},
{
"id": 321,
"slug": "178-1722874475-antiviral-and-anti-inflammatory-activities-of-favipiravir-and-quinine-sulfate-against-dengue-virus-serotype-1-in-vitro",
"featured": false,
"slider": false,
"issue": "Vol8 Issue1",
"type": "original_article",
"manuscript_id": "178-1722874475",
"recieved": "2024-08-05",
"revised": null,
"accepted": "2024-11-28",
"published": "2025-01-25",
"pdf_file": "https://jabet.bsmiab.org/media/pdf_file/2025/36/178-1722874475.pdf",
"title": "Antiviral and anti-inflammatory activities of favipiravir and quinine sulfate against dengue virus serotype 1 in vitro",
"abstract": "<p>Dengue virus (DENV) infection is still a global health problem. The severity of DENV infection is related to the high viral load and cytokine storm caused by excessive inflammation. There is no specific antiviral used for DENV. Meanwhile, the use of anti-inflammatory drugs for DENV is limited to patients with severe clinical symptoms. Interestingly, favipiravir (FVP) and quinine sulfate (QS) have been reported as repurposing drugs that can inhibit DENV replication. However, their anti-inflammatory activity in DENV infection has not been studied yet. Thus, the current study aimed to evaluate both antiviral and inflammatory activities of FVP and QS in Vero and PBMC cells. The FVP and QS antiviral activities were analyzed through half-maximal inhibitory concentration (IC<sub>50</sub>) and half-maximal cytotoxicity concentration (CC<sub>50</sub>) values against DENV serotype-1 on Vero cells. The anti-inflammatory activities of FVP and QS were measured by the relative expression of TNF-α, IL-6, IL-10 cytokines, and the transcription factor NF-κB from DENV-1 infected peripheral blood mononuclear cells (PBMC) in vitro. The results showed that the IC<sub>50</sub>, CC<sub>50</sub>, and selectivity index (SI) for FVP were 2.72 μg/mL, 156.78 μg/mL, and 58, respectively. Meanwhile, the IC<sub>50</sub>, CC<sub>50</sub>, and SI of QS were 14.97 μg/mL, 85.2 μg/mL, and 5.69. Also, FVP and QS reduced the expression of IL-6 and IL-10 but induced the expression of TNF-α, and the transcription factor NF-κB in PBMC with the presence of antibody-dependent enhancement (ADE). Further, FVP has better DENV-1 antiviral activities compared to QS. However, in comparison with QS, FVP showed lower anti-inflammatory activities. Further studies are needed to explore the antiviral and anti-inflammatory mechanism of FVP and QS in the DENV-infected models. <strong> </strong></p>",
"journal_reference": "J Adv Biotechnol Exp Ther. 2025; 8(1): 150-162",
"academic_editor": "Md. Abdul Hannan, PhD; Bangladesh Agricultural University, Bangladesh",
"cite_info": "Rosalina RA, Dewi BE, et al. Antiviral and anti-inflammatory activities of favipiravir and quinine sulfate against dengue virus serotype 1 in vitro. J Adv Biotechnol Exp Ther. 2025; 8(1): 150-162.",
"keywords": [
"Anti-inflammatory",
"Drug repurposing",
"Dengue",
"Favipiravir",
"Antiviral",
"Quinine sulfate"
],
"DOI": "10.5455/jabet.2025.13",
"sections": [
{
"section_number": 1,
"section_title": "INTRODUCTION",
"body": "<p>Dengue hemorrhagic fever (DHF) remains a serious disease in tropical and subtropical regions of the world. According to the CDC, 400 million people worldwide are infected with dengue each year. Approximately 100 million people become ill, and 40,000 die from severe dengue [<a href=\"#r-1\">1</a>]. It was reported that the confirmed cases of dengue in Indonesia were 143,266 and accounted for 1,237 deaths in 2022 [<a href=\"#r-2\">2</a>].</p>\r\n\r\n<p>DHF caused by dengue virus (DENV) infection belongs to the Flaviviridae family and has 4 different serotypes (DENV-1, DENV-2, DENV-3, and DENV-4) [<a href=\"#r-3\">3-6</a>]. All four serotypes exhibit considerable similarity, with approximately 65% of their genomes being identical [<a href=\"#r-7\">7</a>]. DENV is transmitted through the bite of <em>Aedes</em> sp. mosquitoes (<em>Ae. Aegypti</em> and <em>Ae. Albopictus</em>) and causes no symptoms (asymptomatic) or symptoms (symptomatic). Symptomatic dengue cases are classified as undifferentiated febrile illness (UF), dengue fever (DF), DHF, and dengue shock syndrome (DSS). DF patients present some clinical symptoms such as headache, bone pain, and low-grade fever, so it is rarely fatal. DHF patients differ from DF in that DHF patients have plasma leakage. In the case of DSS, the clinical picture is similar to DHF, but the plasma leakage is very severe and causes the patient to go into shock [<a href=\"#r-8\">8</a>].</p>\r\n\r\n<p>The pathogenesis of DENV infection involves both viral and host factors. Host factors in the form of immune responses such as autoimmunity, antibody-dependent enhancement (ADE), and T cells trigger the emergence of cytokine storms [<a href=\"#r-9\">9, 10</a>]. Cytokine storm is a state of increased production of excess cytokines in a short period of time due to an imbalance between Th1 and Th2 cytokine responses [<a href=\"#r-11\">11-13</a>]. Dengue-infected patients have elevated levels of pro-inflammatory (TNF-𝛼, IL-6, IL-8, and IFN-𝛾) and anti-inflammatory (IL-10) cytokines [<a href=\"#r-14\">14</a>]. Cytokine profiles can be analyzed using DENV-infected peripheral blood mononuclear cells (PBMC) [<a href=\"#r-15\">15</a>]. PBMC consists of lymphocytes (T cells, B cells, and NK cells), monocytes, and dendritic cells with percentages of 70-90%, 10-20%, and 1-2%, respectively [<a href=\"#r-16\">16</a>].</p>\r\n\r\n<p>There is no specific treatment for DENV infection, only supportive care such as antipyretics, intravenous rehydration, and, in special circumstances, platelet transfusion are available [<a href=\"#r-17\">17</a>]. Antiviral drugs specific for DENV with the ability to reduce inflammation have been developed [<a href=\"#r-18\">18, 19</a>]. However, no antivirals have been approved for the treatment of DENV. Drug repurposing is a breakthrough therapeutic against infection. Therapeutically, the use of marketed repurposing drugs with antiviral activity in DENV infection is a strategy that can reduce the risk, time, and cost associated with drug development and is also highly effective [<a href=\"#r-12\">12</a>, <a href=\"#r-20\">20, 21</a>].</p>\r\n\r\n<p>Favipiravir (FVP) is a prodrug that is converted to its active form, favipiravir ribofuranosyl-triphosphate (FTP), by targeting the RNA-dependent RNA polymerase (RdRp) of viral RNA, resulting in the cessation of viral replication and mutagenesis [<a href=\"#r-22\">22</a>]. FVP also reduces DENV titers without cell toxicity effects [<a href=\"#r-23\">23</a>]. In addition, quinine sulfate (QS) is an antimalarial drug in the form of an alkaloid compound derived from cinchona bark, which inhibits RNA virus replication. Quinine increases the synthesis of RIG-I and IFN-𝛼 and blocks translation by activating protein kinase R and mRNA degradation by activating RNAse L, which inhibits RNA replication [<a href=\"#r-24\">24, 25</a>]. In dengue treatment, quinine inhibited replication of all serotypes of DENV. However, the internalization process of DENV into host cells could not be hampered [<a href=\"#r-26\">26</a>]. In repurposing drugs, an experimental approach is needed to screen and prove the effectiveness and safety of the tested drugs [<a href=\"#r-27\">27</a>]. Therefore, a dose-dependency test and a cytotoxicity test were conducted in this study. Considering that the anti-inflammatory effects of FVP and QS in dengue fever have never been tested, it is necessary to conduct testing. Therefore, this study aimed to determine the antiviral and anti-inflammatory effects of repurposing drugs FVP and QS in DENV-1 in vitro.</p>"
},
{
"section_number": 2,
"section_title": "MATERIALS AND METHODS",
"body": "<p><strong>Drugs</strong></p>\r\n\r\n<p>The FVP was purchased from Toyama Chemical Co., LTD under the brand name Avigan. The QS drug was bought from PT Kimia Farma Tbk, Indonesia. 10 mg of FVP and QS was dissolved in 1 mL of 100% dimethyl sulfoxide (DMSO) as a stock solution with a final concentration of 10 mg/mL. The stock solution was then used to make various concentrations of 0.3125, 0.625, 1.25, 2.5, 5, 10, 20, 40, 80, 160 and 320 µg/mL in MEM + 2% FBS medium. </p>\r\n\r\n<p><strong> </strong></p>\r\n\r\n<p><strong>Cell culture</strong></p>\r\n\r\n<p>Vero E6 C1008 cells were cultured in Gibco<sup>TM</sup> minimum essential medium (MEM) (Thermo Fisher Scientific, USA) supplemented with 10% fetal bovine serum (FBS) and 0.5% antibiotic-antimycotic at 37<sup>o</sup>C in a 5% CO<sub>2</sub> incubator.</p>\r\n\r\n<p> </p>\r\n\r\n<p><strong>Isolation of virus</strong></p>\r\n\r\n<p>The virus used was Dengue serotype 1 (DENV-1) Strain IDS 11/2010, isolated from patients infected with DENV-1 in 2010 by Dengue researchers at the Department of Microbiology, Faculty of Medicine Universitas Indonesia, and propagated in Vero E6 cells. Virus titration was performed by Focus Forming Assay (FFA) in Vero E6 C1008 cells [<a href=\"#r-28\">28, 29</a>]. Vero E6 C1008 cells were seeded in 96-well plates using 10% FBS MEM with a cell concentration of 2x10<sup>4</sup> cells/well. Supernatants from DENV-1 cultures were diluted in various dilutions from 10<sup>-1</sup> to 10<sup>-5</sup> and infected to the cells. Then, incubated at 37°C in a 5% CO<sub>2</sub> incubator for 2 h with agitating every 30 minutes. After incubation, the wells were given 1.25% methylcellulose and incubated the plate at 37°C and 5% CO<sub>2</sub>. After incubation for 2 days, infected cells were fixed by adding 3.7% formaldehyde. After washing with 1x non-sterile PBS 3 times every 5 minutes, added with Triton-X 0.5% (Sigma Aldrich, USA) and incubated for 20 minutes. Then, the primary antibody at a dilution of 1/1000 in 1% bovine serum albumin (BSA; Sigma-Aldrich, USA), 100 uL/well was added and incubated for 1 h. After washing, cells were then added with horseradish peroxidase (HRP) labeled secondary antibody (Goat anti-Human IgG (H+L); Invitrogen, Thermo Fisher Scientific, USA) at a dilution of 1/1000 in 1% BSA, 100 uL/well and incubated for 1 h. Diaminobenzidine 1x substrate (DAB; Thermo Fisher Scientific, USA) as substrate was added to the wells and incubated for ± 15 minutes. Foci as dark brown dots were observed under an inverted microscope [<a href=\"#r-28\">28</a>].</p>\r\n\r\n<p>This study was conducted at the Laboratory of Virology and Molecular Biology, Department of Microbiology and Infectious Disease and Immunology Research Center, Faculty of Medicine, Universitas Indonesia. Ethical approval was obtained from the Health Research Ethics Committee, Faculty of Medicine, University of Indonesia (No. KET-1449/UN2.F1/ETIK/PPM.00.02/2023).</p>\r\n\r\n<p> </p>\r\n\r\n<p><strong>Determination of IC<sub>50</sub></strong></p>\r\n\r\n<p>The anti-DENV activity assay was performed by seeding Vero E6 C1008 cells at a concentration of 2 x 10<sup>4 </sup>cells/well in a 96-well plate as in the previous study [<a href=\"#r-28\">28</a>] to determine the half-maximal inhibitory concentration (IC<sub>50</sub>). Viruses with Multiplicity of Infection (MOI) close to 0.5 FFU/cell were mixed with the FVP with concentrations of 0.3125, 0.625, 1.25, 2.5, 5 and 10 µg/mL. In the case of QS, concentrations of 5, 10, 20, 40, 80, and 160 µg/mL for the anti-DENV activity assay were used. In both cases, every concentration was replicated 3 times. 0.1% DMSO was included in the assay as a negative control. The drug-virus mixture was then inoculated into monolayer Vero E6 C1008 cells and incubated for 2 h at 37<sup>o</sup>C in a 5% CO<sub>2</sub> incubator, with plate agitation every 30 minutes. The supernatant of the plate was replaced with MEM containing 2% FBS and drug at the appropriate test concentration and then incubated for 48 h at 37<sup>o</sup>C in a 5% CO<sub>2 </sub>incubator. After 48 h, the supernatant was harvested for further titration.</p>\r\n\r\n<p> </p>\r\n\r\n<p><strong>Determination of CC<sub>50</sub></strong></p>\r\n\r\n<p>The MTT assay was performed by seeding Vero E6 C1008 cells at a 96-well plate with a concentration of 2 x 10<sup>4</sup> cells/well to determine the half-maximal cytotoxic concentration (CC<sub>50</sub>). Cells were then treated with FVP at concentrations of 5, 10, 20, 40, 80, and 160 µg/mL, while QS at concentrations of 0.625, 1.25, 2.5, 5, and 10 µg/mL. Both are processed in triplicate and incubated for 48 h at 37<sup>o</sup>C with 5% CO<sub>2</sub>. 0.1% DMSO was used as a negative control. After adding MTT solution and 100% DMSO, absorbance readings were taken at a wavelength of 490nm [<a href=\"#r-30\">30</a>]. The optical density (OD, absorbance) of each well in the indicated groups was used to calculate the percentage of cell viability as follows: percentage of cell viability = (<em>A </em>treatment – <em>A </em>blank)/(<em>A </em>control – <em>A </em>blank) × 100% (where, <em>A</em> = absorbance).</p>\r\n\r\n<p> </p>\r\n\r\n<p><strong>Anti-inflammatory assay</strong></p>\r\n\r\n<p>Anti-inflammatory activity was performed with PBMC cultured in 96-well plates at a concentration of 2x10<sup>5</sup> cells/well in triplicate [<a href=\"#r-15\">15</a>]. After informed consent, 12-20 mL of the blood was drawn from human subjects with inclusion criteria of having no fever for the last 3 weeks, negative DENV infection, negative NS1 antigen, and anti-dengue IgM antibody to obtain PBMC. PBMC were cultured in Roswell Park Memorial Institute (RPMI) medium with 10% FBS, and 1% antibiotic-antimycotic. We used Concanavalin-A, a mitogenic stimulated agent, as a positive control of inflammation. In purpose to infect PBMC with DENV-1, DENV-2-infected patients with a dilution of 1/10,000 as ADE was used [<a href=\"#r-31\">31</a>]. PBMC were incubated at 37°C with 5% CO<sub>2</sub> and were treated as indicated in <a href=\"#Table-1\">Table 1</a>.</p>\r\n\r\n<p>After incubation for 24 h, PBMC in 96-well plates was extracted to obtain cellular RNA to determine pro- and anti-inflammatory cytokine expression. RNA was converted into complementary DNA (cDNA) using the RevertAid First Strand cDNA Synthesis Kit (Thermo Fisher Scientific, USA). Cytokine analysis was performed by Real-Time PCR using PowerUp™ SYBR™ Green Master Mix for qPCR reagents (Applied Biosystems, USA). We used primers from previous studies (<a href=\"#Table-2\">Table 2</a>). Relative mRNA expression was analyzed against housekeeping gene β-actin mRNA levels using the Livak method (2<sup>-ΔΔ <em>Ct</em></sup><em>)</em> [<a href=\"#r-32\">32</a>].</p>\r\n\r\n<p style=\"text-align:center\"><strong>Table 1. </strong>Treatment details and PBMC stimulation in each group.</p>\r\n\r\n<div id=\"Table-1\">\r\n<p style=\"text-align:center\"><a href=\"https://jabet.bsmiab.org/table/178-1722874475-table1/\"> Table-1</a></p>\r\n</div>\r\n\r\n<p> </p>\r\n\r\n<p style=\"text-align:center\"><strong>Table 2. </strong>Primer sequences for cytokine gene analysis using real-time PCR.</p>\r\n\r\n<div id=\"Table-2\">\r\n<p style=\"text-align:center\"><a href=\"https://jabet.bsmiab.org/table/178-1722874475-table2/\">Table-2</a></p>\r\n</div>\r\n\r\n<p><strong>Statistical analysis </strong></p>\r\n\r\n<p>Data analysis was performed using IBM SPSS Statistics Version 26 (IBM, SPSS Inc., New York, USA) and GraphPad Prism Version 10 statistical software (GraphPad Software, Inc., California, USA). Data were collected based on the IC<sub>50</sub>, CC<sub>50,</sub> and anti-inflammatory test results. IC<sub>50</sub> and CC<sub>50</sub> values were obtained using linear regression. After obtaining IC<sub>50</sub> and CC<sub>50</sub>, the Selectivity Index (SI) value can be determined using the ratio between IC<sub>50</sub> and CC<sub>50</sub>. In IC<sub>50</sub> and CC<sub>50</sub> values, data normality and homogeneity were analyzed using the Shapiro-Wilks Test. Normal data will then be subjected to the one-way ANOVA test to see the meaningfulness of the mean difference between the treatment group and the control group. Data that are not homogeneous can use non-parametric tests to determine the meaningfulness of the difference in means between the treatment group and the control group.</p>"
},
{
"section_number": 3,
"section_title": "RESULTS",
"body": "<p><strong>IC</strong><sub>50</sub><strong> value of favipiravir</strong></p>\r\n\r\n<p>FFA was used to determine the titer of DENV after being treated with FVP. One foci on FFA represented 1 DENV that replicated during 48 h of the incubation time. Treatment with FVP decreased the number of foci in a dose-dependent manner (<a href=\"#figure1\">Figure 1</a>). The control group treated with 0.1% DMSO showed a large number of DENV-1 foci. The Mann-Whitney test showed a significant difference between the number of foci at each concentration of FVP and 0.1% DMSO control with p-value ≤ 0.01.</p>\r\n\r\n<p>The percentage of inhibition was obtained by comparing the difference in the number of foci in the control group with the treatment group at each concentration then divided by the number of DENV-1 foci in the control group. The higher the concentration of FVP showed the higher the percentage of inhibition (<a href=\"#figure2\">Figure 2</a> and <a href=\"#Table-3\">Table 3</a>).</p>\r\n\r\n<p>The percentage of inhibition and FVP concentrations were used to create a linear regression graph. The linear regression equation obtained was y = 6.4725x + 32.264 with R<sup>2</sup> of 0.9448 (<a href=\"#figure2\">Figure 2</a>). From the above equation, the IC<sub>50</sub> value of FVP was 2.72 μg/mL.</p>\r\n\r\n<div id=\"figure1\">\r\n<figure class=\"image\"><img alt=\"\" height=\"180\" src=\"/media/article_images/2025/09/27/178-1722874475-Figure1.jpg\" width=\"500\" />\r\n<figcaption><strong>Figure 1.</strong> DENV-1 focus assay results in Vero E6 C1008 cells treated with various concentrations of Favipiravir. 1 foci came from one infected DENV-1 that was replicated in Vero cells for 2 days of incubation. A. Negative Control (DMSO 0.1%), B. Favipiravir 10 μg/mL, C. Favipiravir 5 μg/mL, D. Favipiravir 2.5 μg/mL, E. Favipiravir 1.25 μg/mL, F. Favipiravir 0.625 μg/mL, G. Favipiravir 0.3125 μg/mL. Using 20x magnification and Focus Forming Assay (FFA).</figcaption>\r\n</figure>\r\n</div>\r\n\r\n<p><strong> </strong></p>\r\n\r\n<div id=\"figure2\">\r\n<figure class=\"image\"><img alt=\"\" height=\"433\" src=\"/media/article_images/2025/09/27/178-1722874475-Figure2.jpg\" width=\"500\" />\r\n<figcaption><strong>Figure 2.</strong> Linear regression graph between favipiravir concentration and percent inhibition. The R-value was 0.9448, indicating that experiments were in a dose-dependent manner.</figcaption>\r\n</figure>\r\n</div>\r\n\r\n<p><strong> </strong></p>\r\n\r\n<p style=\"text-align:center\"><strong>Table 3. </strong>Number of DENV-1 foci by favipiravir at various concentrations.</p>\r\n\r\n<div id=\"Table-3\">\r\n<p style=\"text-align:center\"><a href=\"https://jabet.bsmiab.org/table/178-1722874475-table3/\"> Table-3</a></p>\r\n</div>\r\n\r\n<p> </p>\r\n\r\n<p><strong>IC<sub>50</sub> value of quinine sulfate</strong></p>\r\n\r\n<p>The determining protocol of the IC<sub>50</sub> value of QS is the same as FVP. Administration of QS decreased the number of DENV-1 foci in a dose-dependent manner (<a href=\"#figure3\">Figure 3</a> and <a href=\"#Table-4\">Table 4</a>). The control group treated with 0.1% DMSO showed the highest number of foci (<a href=\"#figure3\">Figure 3</a> and <a href=\"#Table-4\">Table 4</a>). After being treated with QS at a concentration of 160 ug/mL, no foci with brown color dots appeared. With the reduced concentration of QS, the number of foci increased (<a href=\"#figure3\">Figure 3</a> and <a href=\"#Table-4\">Table 4</a>).</p>\r\n\r\n<p>Based on the logarithmic regression graph, a line equation was used to obtain the value of IC<sub>50</sub>. The log regression was y = 34.751ln(x) – 44.412 with R<sup>2</sup> of 0.9313 (<a href=\"#figure4\">Figure 4</a>). The IC<sub>50</sub> value of QS was 14.97 μg/mL.</p>\r\n\r\n<div id=\"figure3\">\r\n<figure class=\"image\"><img alt=\"\" height=\"184\" src=\"/media/article_images/2025/09/27/178-1722874475-Figure3.jpg\" width=\"500\" />\r\n<figcaption><strong>Figure 3</strong>. DENV-1 focus assay results in Vero E6 C1008 cells treated with various concentrations of Quinine Sulfate. One foci came from one infected DENV-1 that was replicated in Vero cells for 2 days of incubation. A. Negative Control (DMSO 0,1%), B. Quinine Sulfate 160 μg/mL, C. Quinine Sulfate 80 μg/mL, D. Quinine Sulfate 40 μg/mL, E. Quinine Sulfate 20 μg/mL, F. Quinine Sulfate 10 μg/mL, G. Quinine Sulfate 5 μg/mL. Using 20x magnification.</figcaption>\r\n</figure>\r\n\r\n<p> </p>\r\n</div>\r\n\r\n<div id=\"figure4\">\r\n<figure class=\"image\"><img alt=\"\" height=\"436\" src=\"/media/article_images/2025/09/27/178-1722874475-Figure4.jpg\" width=\"500\" />\r\n<figcaption><strong>Figure 4</strong>. Logarithmic regression graph between Quinine Sulfate concentration and percent inhibition. The R-value was 0.9313, indicating that experiments were in a dose-dependent manner.</figcaption>\r\n</figure>\r\n\r\n<p> </p>\r\n</div>\r\n\r\n<p style=\"text-align:center\"><strong>Table 4. </strong>Number of DENV-1 foci by quinine sulfate at various concentrations.</p>\r\n\r\n<div id=\"Table-4\">\r\n<p style=\"text-align:center\"><a href=\"https://jabet.bsmiab.org/table/178-1722874475-table4/\">Table-4</a></p>\r\n</div>\r\n\r\n<p> </p>\r\n\r\n<p><strong>CC<sub>50</sub> value of favipiravir </strong><strong>and quinine sulfate</strong></p>\r\n\r\n<p>Based on the MTT activity, the increased FVP and QS concentration reduced the cell viability (<a href=\"#figure5\">Figures 5 </a>and <a href=\"#figure6\">6</a>). FVP at a concentration of 160 μg/mL, the viability of the cells was only 51 ± 3.3 %. At concentrations less than 10 μg/mL of FVP, it didn’t show any toxicity to the cells, indicating that the higher the concentration of FVP, the more toxic to cells (<a href=\"https://jabet.bsmiab.org/media/supply_file/2025/45/27/Supplementary_materials.pdf\">Supplementary Table 1</a>).</p>\r\n\r\n<p>Determination of the CC<sub>50</sub> value was done by creating a regression graph between the percentage of viability and FVP concentration (<a href=\"#figure5\">Figure 5</a>). The linear regression equation of FVP treatment was y = -0.303x + 97.504 with R<sup>2</sup> = 0.9725. Based on the above equation, the CC<sub>50</sub> value of FVP was 156.78 μg/mL.</p>\r\n\r\n<p>Based on the MTT activity, the increased QS concentration reduced the cell viability (<a href=\"#figure6\">Figure 6</a>). QS at Concentrations of 10, 5, 2.5, and 1.25 μg/mL showed percentage cell viability significantly different from the 0.1% DMSO control group. Fortunately, the concentration of QS at 0.625 μg/mL was not significantly different (<a href=\"https://jabet.bsmiab.org/media/supply_file/2025/45/27/Supplementary_materials.pdf\">Supplementary Table 2</a>).</p>\r\n\r\n<p>The logarithmic regression equation of QS treatment was y = -9.506In(x) + 86.298 with R<sup>2</sup> = 0.9775 (<a href=\"#figure6\">Figure 6</a>). Based on the above equation, the CC50 value of QS was 85.2 μg/mL.</p>\r\n\r\n<div id=\"figure5\">\r\n<figure class=\"image\"><img alt=\"\" height=\"394\" src=\"/media/article_images/2025/09/27/178-1722874475-Figure5.jpg\" width=\"500\" />\r\n<figcaption><strong>Figure 5</strong>. The percentage viability of Vero cells at various concentrations of favipiravir. The R-value was 0.9725, indicating that experiments were in a dose-dependent manner.</figcaption>\r\n</figure>\r\n\r\n<p> </p>\r\n</div>\r\n\r\n<div id=\"figure6\">\r\n<figure class=\"image\"><img alt=\"\" height=\"448\" src=\"/media/article_images/2025/09/27/178-1722874475-Figure6.jpg\" width=\"500\" />\r\n<figcaption><strong>Figure 6</strong>. The percentage viability of Vero cells at various concentrations of quinine sulfate. The R-value was 0.9775, indicating that experiments were in a dose-dependent manner.</figcaption>\r\n</figure>\r\n\r\n<p> </p>\r\n</div>\r\n\r\n<p><strong>Selectivity index</strong></p>\r\n\r\n<p>The selectivity index (SI) value was obtained by comparing the CC<sub>50</sub> and IC<sub>50</sub> values of FVP and QS. From this study, the SI values of FVP and QS were 58 and 5.69, respectively (<a href=\"#Table-5\">Table 5</a>).</p>\r\n\r\n<p style=\"text-align:center\"><strong>Table 5.</strong> SI values of FVP and QS. Calculated from the comparison of CC<sub>50</sub> and IC<sub>50</sub> values.</p>\r\n\r\n<div id=\"Table-5\">\r\n<p style=\"text-align:center\"><a href=\"https://jabet.bsmiab.org/table/178-1722874475-table5/\"> Table-5</a></p>\r\n</div>\r\n\r\n<p> </p>\r\n\r\n<p><strong>Anti-inflammatory activity of favipiravir and quinine sulfate </strong></p>\r\n\r\n<p>Anti-inflammatory activity was observed in the anti-DENV antibody present as an ADE model. PBMC treated with 0.1% DMSO was used as a negative control. Relative mRNA expression was analyzed against housekeeping gene β-actin mRNA levels using the Livak method (2<sup>-ΔΔ <em>Ct</em></sup><em>)</em>. Each relative mRNA expression value was represented from the triplicate sample. In comparison with 0.1% DMSO control, after 24 h of incubation, the expression of TNF-α, IL-6, IL-10, and NF-κB increased in all treated groups in PBMC (data not shown). In comparison with DENV-infected PBMC, expression of NF-κB was more profound in DENV-infected PBMC treated with QS (<a href=\"#figure7\">Figure 7</a>A). Expression of TNF-α was slightly increased in DENV-infected PBMC treated with FVP and QS (<a href=\"#figure7\">Figure 7</a>B). IL-6 and IL-10 cytokines expression decreased after being treated with FVP (<a href=\"#figure7\">Figure 7</a>C and D). Similar to FVP, treatment with QS also decreased the expression of IL-6 and IL-10 cytokines (<a href=\"#figure7\">Figure 7</a>C and D).</p>\r\n\r\n<div id=\"figure7\">\r\n<figure class=\"image\"><img alt=\"\" height=\"260\" src=\"/media/article_images/2025/09/27/178-1722874475-Figure7.jpg\" width=\"500\" />\r\n<figcaption><strong>Figure 7</strong>. Relative mRNA expression of transcription factor A) NF-κB and cytokines B) TNF-α, C) IL-6, and D) IL10 after treatment with favipiravir and quinine sulfate in PBMC infected with DENV-1 in the presence of antibodies as ADE model. Each relative mRNA expression value was represented from a triplicate sample. The doses of FVP and QS used were 2xIC<sub>50</sub>, as determined by the antiviral activity test.</figcaption>\r\n</figure>\r\n</div>"
},
{
"section_number": 4,
"section_title": "DISCUSSION",
"body": "<p>Up to now, there are no specific commercial antiviral drugs for DENV infection. Poorly coordinated clinical trial efforts, difficulties in animal models and laboratory tests, and complex serotypes and genotypes have hampered antiviral drug development. Several candidates for anti-DENV drugs that are direct-acting antiviral (DAA) and host-directed antiviral (HDA) have been explored, but none have been successful in effectively treating dengue infection [<a href=\"#r-36\">36, 37</a>]. The discovery of new anti-DENV drugs takes a long time and involves many steps, and repurposing drugs is an alternative strategy to accelerate this process. In addition, repurposing drugs are already guaranteed to be safe [<a href=\"#r-38\">38</a>]. There is an urgent need for the development of therapeutics against dengue. This study evaluated the potential antiviral and anti-inflammatory effects of FVP and QS in DENV-infected Vero cells and PBMC.</p>\r\n\r\n<p>FVP inhibited DENV replication in HUH-7 cells and SK-N-MC cells with EC<sub>50 </sub> of 146.8 μM, 110 μM, and 287.9 μM. Besides FVP, QS also has the potential to have an antiviral effect on DENV with an EC<sub>50</sub> of 33.31 μg/mL [<a href=\"#r-23\">23</a>, <a href=\"#r-26\">26</a>, <a href=\"#r-39\">39</a>]. In the current study, the IC<sub>50</sub> value was determined by FFA, therefore, the target of drug inhibition against virus replication was not determined. It found the IC<sub>50 </sub>of FVP and QS was 2.72 μg/mL and 14.97 μg/mL, respectively. This showed that FVP has a stronger DENV-1 antiviral potential than QS. FVP is a broad-spectrum antiviral drug and is widely used for the treatment of RNA virus infections, which targeting the RNA-dependent RNA polymerase (RdRp) leads to chain termination during viral replication and viral mutagenesis [<a href=\"#r-22\">22</a>]. The mechanism of QS was increasing RIG-I expression and stimulating the interferon type I (IFN I) pathway to produce IFN-𝛼. IFN-𝛼 then stimulates interferon-stimulated genes (ISRE) to induce RNase L and protein kinase R (PKR). Induction of both genes can inhibit the synthesis of viral proteins to inhibit the replication of the virus. Activation of PKR can block the viral translation process, and RNase L can degrade viral mRNA so that no viral RNA is replicated [<a href=\"#r-24\">24</a>, <a href=\"#r-26\">26</a>].</p>\r\n\r\n<p>FVP and QS were tested for toxicity against Vero cells to obtain a concentration that reduced the number of viable cells tested by 50%. The CC<sub>50</sub> values of FVP and QS were 156.72 μg/mL and 85.2 μg/mL. In previous studies, the CC<sub>50</sub> value of FVP on HUH-7 cells was > 500 μM or equivalent to 78.5 μg/mL [<a href=\"#r-23\">23</a>] and > 1000 μM or equivalent to 157 μg/mL [<a href=\"#r-39\">39</a>]. The CC<sub>50</sub> of FVP was also evaluated using other cells such as MDCK cells, Vero cells, HEL cells, A549 cells, HeLa cells, and HEp-2 cells. The resulting CC<sub>50</sub> value of FVP for all those cells was>1000 μg/mL or equivalent to 157 μg/mL, indicating that FVP was not toxic to the cells tested at concentrations up to 1000 μg/mL [<a href=\"#r-40\">40</a>]. The FVP causes cell damage by oxidative stress, which can cause DNA damage in rat cardio myoblast cells (H9c2) and human skin fibroblasts (CCD-1079Sk). Oxidative stress is observed in the presence of ATP depletion, which is a sign of cellular stress [<a href=\"#r-41\">41</a>]. Focusing on the QS drug, a previous study showed CC<sub>50</sub> value of QS was 322.2 μM or 104.52 μg/mL [<a href=\"#r-26\">26</a>].</p>\r\n\r\n<p>A compound used as a drug candidate must have a high toxic concentration value and a very low activity concentration. DENV candidate antiviral with SI values ³ 10 are generally considered to have potential as antiviral drug for further drug development [<a href=\"#r-42\">42, 43</a>]. The SI values FVP and QS were 58 and 5.69, respectively. FVP has better potential to be anti-DENV-1 compared to QS. Previous studies using different cell lines showed that the SI value of FVP was 9.1 [<a href=\"#r-39\">39</a>]. The SI results of QS were similar to previous research, where the SI value was 3.137 [<a href=\"#r-26\">26</a>].</p>\r\n\r\n<p>Besides the capability to inhibit DENV replication, candidate antivirals are also suggested to have potential as anti-inflammatory since the severe DENV caused by cytokines storm. The present study showed that FVP and QS reduced the expression of IL-6 and IL-10 in DENV-infected PBMC with antibodies. Even though the main cytokine target (TNF-α) reduction did not occur after being treated with FVP and QS. FVP significantly reduced the levels of proinflammatory cytokines such as IL-6 and IL-10 in mice infected with Crimean-Congo hemorrhagic fever virus (CCHVF) [<a href=\"#r-44\">44</a>]. Previous research found that QS has anti-inflammatory activity by inhibiting cytokine production and IL-6 release in T cells [<a href=\"#r-45\">45</a>]. QS also suppressed the production of Th2-related cytokines such as IL-4, IL-5, IL-13, IL-1β, and TNF-α by inhibiting the activity of the NF-κB signaling pathway [<a href=\"#r-46\">46</a>]. Quinine treatment effectively attenuated the infiltration of inflammatory cells, alleviating the pathological damage, inhibiting the expression of genes related to the NF-κB signaling pathway, and reducing the inflammatory response [<a href=\"#r-46\">46</a>]. In COVID-19 infection, the production of the cytokine TNF-α is also suppressed [<a href=\"#r-45\">45</a>, <a href=\"#r-47\">47</a>]. In addition, quinine effectively enhances the production of IFN-α cytokine, which acts as an immune stimulator to inhibit the virus [<a href=\"#r-47\">47</a>]. In contrast, we found that the NF-κB activity and TNF-α suppression did not occur. It may be due to the concentration and incubation time for 24 h of FVP and QS as well as the influence of cytokine kinetics.</p>\r\n\r\n<p>However, this study has several limitations. Specifically, there was no examination of the amount of viral RNA in the cells, the number of infective virions, or the number of cytokines secreted in the supernatant of PBMC in the anti-inflammatory test. Furthermore, the anti-inflammatory activity test has not been repeated, which precludes statistical analysis.</p>"
},
{
"section_number": 5,
"section_title": "CONCLUSIONS",
"body": "<p>In conclusion, FVP has potential as an antiviral to DENV-1 and reduced IL-6 and IL-10 cytokines expression in DENV-infected PBMC. However, in comparison with QS, FVP showed lower anti-inflammatory activities. Further studies are needed to explore the mechanisms by which both repurposing drugs inhibit DENV replication and mediate anti-inflammatory effects.</p>"
},
{
"section_number": 6,
"section_title": "ACKNOWLEDGMENTS",
"body": "<p>This study thanks the Department of Research and Development, Universitas Indonesia, Indonesia for funding this research through the Post-Graduate PUTI Grant (Grant No: NKB-107/UN2.RST/HKP.05.00/2023). In addition, this study thanks the Department of Microbiology, Faculty of Medicine, University Indonesia, Indonesia for their support and laboratory facilities.</p>"
},
{
"section_number": 7,
"section_title": "AUTHOR CONTRIBUTIONS",
"body": "<p>All authors contributed to the development of this paper. RAR: data curation, formal analysis, investigation, methodology, software, visualization, writing - original draft, writing – review, and editing. BED and FIT: Conceptualization, formal analysis, investigation, methodology, writing - review and editing. All authors approved the final version of the manuscript.</p>"
},
{
"section_number": 8,
"section_title": "CONFLICTS OF INTEREST",
"body": "<p>There is no conflict of interest among the authors.</p>"
},
{
"section_number": 9,
"section_title": "SUPPLEMENTARY MATERIALS",
"body": "<p><a href=\"https://jabet.bsmiab.org/media/supply_file/2025/45/27/Supplementary_materials.pdf\">Supplementary Table 1</a>. Percentage of Vero cell viability after being treated with various concentrations of Favipiravir, and <a href=\"https://jabet.bsmiab.org/media/supply_file/2025/45/27/Supplementary_materials.pdf\">Supplementary Table 2</a>. Percentage of Vero cell viability after being treated with various concentrations of quinine sulfate (<a href=\"https://jabet.bsmiab.org/media/supply_file/2025/45/27/Supplementary_materials.pdf\">Supplementary Materials</a>).</p>"
}
],
"figures": [
{
"figure": "https://jabet.bsmiab.org/media/article_images/2025/09/27/178-1722874475-Figure1.jpg",
"caption": "Figure 1. DENV-1 focus assay results in Vero E6 C1008 cells treated with various concentrations of Favipiravir. 1 foci came from one infected DENV-1 that was replicated in Vero cells for 2 days of incubation. A. Negative Control (DMSO 0.1%), B. Favipiravir 10 μg/mL, C. Favipiravir 5 μg/mL, D. Favipiravir 2.5 μg/mL, E. Favipiravir 1.25 μg/mL, F. Favipiravir 0.625 μg/mL, G. Favipiravir 0.3125 μg/mL. Using 20x magnification and Focus Forming Assay (FFA).",
"featured": true
},
{
"figure": "https://jabet.bsmiab.org/media/article_images/2025/09/27/178-1722874475-Figure2.jpg",
"caption": "Figure 2. Linear regression graph between favipiravir concentration and percent inhibition. The R-value was 0.9448, indicating that experiments were in a dose-dependent manner.",
"featured": false
},
{
"figure": "https://jabet.bsmiab.org/media/article_images/2025/09/27/178-1722874475-Figure3.jpg",
"caption": "Figure 3. DENV-1 focus assay results in Vero E6 C1008 cells treated with various concentrations of Quinine Sulfate. One foci came from one infected DENV-1 that was replicated in Vero cells for 2 days of incubation. A. Negative Control (DMSO 0,1%), B. Quinine Sulfate 160 μg/mL, C. Quinine Sulfate 80 μg/mL, D. Quinine Sulfate 40 μg/mL, E. Quinine Sulfate 20 μg/mL, F. Quinine Sulfate 10 μg/mL, G. Quinine Sulfate 5 μg/mL. Using 20x magnification.",
"featured": false
},
{
"figure": "https://jabet.bsmiab.org/media/article_images/2025/09/27/178-1722874475-Figure4.jpg",
"caption": "Figure 4. Logarithmic regression graph between Quinine Sulfate concentration and percent inhibition. The R-value was 0.9313, indicating that experiments were in a dose-dependent manner.",
"featured": false
},
{
"figure": "https://jabet.bsmiab.org/media/article_images/2025/09/27/178-1722874475-Figure5.jpg",
"caption": "Figure 5. The percentage viability of Vero cells at various concentrations of favipiravir. The R-value was 0.9725, indicating that experiments were in a dose-dependent manner.",
"featured": false
},
{
"figure": "https://jabet.bsmiab.org/media/article_images/2025/09/27/178-1722874475-Figure6.jpg",
"caption": "Figure 6. The percentage viability of Vero cells at various concentrations of quinine sulfate. The R-value was 0.9775, indicating that experiments were in a dose-dependent manner.",
"featured": false
},
{
"figure": "https://jabet.bsmiab.org/media/article_images/2025/09/27/178-1722874475-Figure7.jpg",
"caption": "Figure 7. Relative mRNA expression of transcription factor A) NF-κB and cytokines B) TNF-α, C) IL-6, and D) IL10 after treatment with favipiravir and quinine sulfate in PBMC infected with DENV-1 in the presence of antibodies as ADE model. Each relative mRNA expression value was represented from a triplicate sample. The doses of FVP and QS used were 2xIC50, as determined by the antiviral activity test.",
"featured": false
}
],
"authors": [
{
"id": 1594,
"affiliation": [
{
"affiliation": "Master’s Programme in Biomedical Sciences, Faculty of Medicine, Universitas Indonesia, Jakarta, 10430, Indonesia"
}
],
"first_name": "Regita Aulia",
"family_name": "Rosalina",
"email": null,
"author_order": 1,
"ORCID": "https://orcid.org/0009-0003-0445-6718",
"corresponding": false,
"co_first_author": true,
"co_author": false,
"corresponding_author_info": "",
"article": 321
},
{
"id": 1595,
"affiliation": [
{
"affiliation": "Department of Microbiology, Faculty of Medicine, Universitas Indonesia, Jakarta, 10320, Indonesia"
},
{
"affiliation": "Infectious Disease and Immunology Research Center Cluster, Indonesian Medical Education and Research Institute, Faculty of Medicine, Universitas Indonesia, Jakarta, 10430, Indonesia"
}
],
"first_name": "Beti Ernawati",
"family_name": "Dewi",
"email": "beti.ernawati@ui.ac.id",
"author_order": 2,
"ORCID": "https://orcid.org/0009-0002-0452-1914",
"corresponding": true,
"co_first_author": false,
"co_author": false,
"corresponding_author_info": "Beti Ernawati Dewi, Department of Microbiology, Faculty of Medicine, Universitas Indonesia, Jakarta, 10320, Indonesia. Email: beti.ernawati@ui.ac.id",
"article": 321
},
{
"id": 1596,
"affiliation": [
{
"affiliation": "Department of Microbiology, Faculty of Medicine, Universitas Indonesia, Jakarta, 10320, Indonesia"
}
],
"first_name": "Fithriyah",
"family_name": null,
"email": null,
"author_order": 3,
"ORCID": null,
"corresponding": false,
"co_first_author": true,
"co_author": false,
"corresponding_author_info": "",
"article": 321
}
],
"views": 571,
"downloads": 86,
"references": [
{
"id": 13336,
"serial_number": 1,
"pmc": null,
"reference": "Prevention CfDCa. About dengue. U.S. Department of Health & Human Services; 2022.",
"DOI": null,
"article": 321
},
{
"id": 13337,
"serial_number": 2,
"pmc": null,
"reference": "Indonesia MoHotRo. Indonesia health profile in 2021. Pusdatin; 2021.",
"DOI": null,
"article": 321
},
{
"id": 13338,
"serial_number": 3,
"pmc": null,
"reference": "Pang NY-L, Pang AS-R, et al. Understanding neutralising antibodies against sars-cov-2 and their implications in clinical practice. Military Medical Research. 2021;8:47.",
"DOI": null,
"article": 321
},
{
"id": 13339,
"serial_number": 4,
"pmc": null,
"reference": "Langerak T, Mumtaz N, et al. The possible role of cross-reactive dengue virus antibodies in zika virus pathogenesis. PLoS pathogens. 2019;15:e1007640.",
"DOI": null,
"article": 321
},
{
"id": 13340,
"serial_number": 5,
"pmc": null,
"reference": "Hasan S, Jamdar SF, et al. Dengue virus: A global human threat: Review of literature. Journal of international society of preventive and community dentistry. 2016;6:1-6.",
"DOI": null,
"article": 321
},
{
"id": 13341,
"serial_number": 6,
"pmc": null,
"reference": "Cloutier M, Nandi M, et al. Ade and hyperinflammation in sars-cov2 infection-comparison with dengue hemorrhagic fever and feline infectious peritonitis. Cytokine. 2020;136:155256.",
"DOI": null,
"article": 321
},
{
"id": 13342,
"serial_number": 7,
"pmc": null,
"reference": "Azhar EI, Hashem AM, et al. Complete genome sequencing and phylogenetic analysis of dengue type 1 virus isolated from jeddah, saudi arabia. Virology journal. 2015;12:1-11.",
"DOI": null,
"article": 321
},
{
"id": 13343,
"serial_number": 8,
"pmc": null,
"reference": "Kalayanarooj S. Clinical manifestations and management of dengue/dhf/dss. Tropical medicine and health. 2011;39:S83-S7.",
"DOI": null,
"article": 321
},
{
"id": 13344,
"serial_number": 9,
"pmc": null,
"reference": "King CA, Wegman AD, et al. Mobilization and activation of the innate immune response to dengue virus. Frontiers in Cellular and Infection Microbiology. 2020;10.",
"DOI": null,
"article": 321
},
{
"id": 13345,
"serial_number": 10,
"pmc": null,
"reference": "Martina BE, Koraka P, et al. Dengue virus pathogenesis: An integrated view. Clinical microbiology reviews. 2009;22:564-81.",
"DOI": null,
"article": 321
},
{
"id": 13346,
"serial_number": 11,
"pmc": null,
"reference": "Bhatt P, Sabeena SP, et al. Current understanding of the pathogenesis of dengue virus infection. Curr Microbiol. 2021;78:17-32.",
"DOI": null,
"article": 321
},
{
"id": 13347,
"serial_number": 12,
"pmc": null,
"reference": "Imad HA, Phumratanaprapin W, et al. Cytokine expression in dengue fever and dengue hemorrhagic fever patients with bleeding and severe hepatitis. Am J Trop Med Hyg. 2020;102:943-50.",
"DOI": null,
"article": 321
},
{
"id": 13348,
"serial_number": 13,
"pmc": null,
"reference": "Nanaware N, Banerjee A, et al. Dengue virus infection: A tale of viral exploitations and host responses. Viruses. 2021;13.",
"DOI": null,
"article": 321
},
{
"id": 13349,
"serial_number": 14,
"pmc": null,
"reference": "Masood KI, Jamil B, et al. Role of tnf α, il-6 and cxcl10 in dengue disease severity. Iranian journal of microbiology. 2018;10:202.",
"DOI": null,
"article": 321
},
{
"id": 13350,
"serial_number": 15,
"pmc": null,
"reference": "Dewi BE, Takasaki T, et al. Peripheral blood mononuclear cells increase the permeability of dengue virus-infected endothelial cells in association with downregulation of vascular endothelial cadherin. Journal of General Virology. 2008;89:642-52.",
"DOI": null,
"article": 321
},
{
"id": 13351,
"serial_number": 16,
"pmc": null,
"reference": "Kleiveland CR. Peripheral blood mononuclear cells. The Impact of Food Bioactives on Health: in vitro and ex vivo models. 2015:161-7.",
"DOI": null,
"article": 321
},
{
"id": 13352,
"serial_number": 17,
"pmc": null,
"reference": "Organization WH. Regional office for south east asia (2011) comprehensive guidelines for prevention and control of dengue and dengue haemorrhagic fever: Revised and expanded edition. New Delhi: World Health Organization.",
"DOI": null,
"article": 321
},
{
"id": 13353,
"serial_number": 18,
"pmc": null,
"reference": "Bhatt S, Gething PW, et al. The global distribution and burden of dengue. Nature. 2013;496:504-7.",
"DOI": null,
"article": 321
},
{
"id": 13354,
"serial_number": 19,
"pmc": null,
"reference": "Tatem AJ, Hay SI, et al. Global traffic and disease vector dispersal. Proceedings of the National Academy of Sciences. 2006;103:6242-7.",
"DOI": null,
"article": 321
},
{
"id": 13355,
"serial_number": 20,
"pmc": null,
"reference": "Sahoo BM, Ravi Kumar B, et al. Drug repurposing strategy (drs): Emerging approach to identify potential therapeutics for treatment of novel coronavirus infection. Frontiers in Molecular Biosciences. 2021;8:628144.",
"DOI": null,
"article": 321
},
{
"id": 13356,
"serial_number": 21,
"pmc": null,
"reference": "Vaughn DW, Green S, et al. Dengue viremia titer, antibody response pattern, and virus serotype correlate with disease severity. The Journal of infectious diseases. 2000;181:2-9.",
"DOI": null,
"article": 321
},
{
"id": 13357,
"serial_number": 22,
"pmc": null,
"reference": "Zhao L, Zhong W. Mechanism of action of favipiravir against sars-cov-2: Mutagenesis or chain termination? The Innovation. 2021;2.",
"DOI": null,
"article": 321
},
{
"id": 13358,
"serial_number": 23,
"pmc": null,
"reference": "Franco EJ, Pires de Mello CP, et al. Antiviral evaluation of uv-4b and interferon-alpha combination regimens against dengue virus. Viruses. 2021;13:771.",
"DOI": null,
"article": 321
},
{
"id": 13359,
"serial_number": 24,
"pmc": null,
"reference": "Latarissa IR, Barliana MI, et al. Potential of quinine sulfate for covid-19 treatment and its safety profile. Clinical Pharmacology: Advances and Applications. 2021:225-34.",
"DOI": null,
"article": 321
},
{
"id": 13360,
"serial_number": 25,
"pmc": null,
"reference": "Nugraha RV, Ridwansyah H, et al. Traditional herbal medicine candidates as complementary treatments for covid‐19: A review of their mechanisms, pros and cons. Evidence‐Based Complementary and Alternative Medicine. 2020;2020:2560645.",
"DOI": null,
"article": 321
},
{
"id": 13361,
"serial_number": 26,
"pmc": null,
"reference": "Malakar S, Sreelatha L, et al. Drug repurposing of quinine as antiviral against dengue virus infection. Virus research. 2018;255:171-8.",
"DOI": null,
"article": 321
},
{
"id": 13362,
"serial_number": 27,
"pmc": null,
"reference": "Rudrapal M, Khairnar SJ, et al. Drug repurposing (dr): An emerging approach in drug discovery. Drug repurposing-hypothesis, molecular aspects and therapeutic applications. 2020;10.",
"DOI": null,
"article": 321
},
{
"id": 13363,
"serial_number": 28,
"pmc": null,
"reference": "Dewi BE, Angelina M, et al. Antiviral effect of pterocarpus indicus willd leaves extract against replication of dengue virus (denv) in vitro. Journal of Tropical Life Science. 2018;8.",
"DOI": null,
"article": 321
},
{
"id": 13364,
"serial_number": 29,
"pmc": null,
"reference": "Rosmalena R, Elya B, et al. The antiviral effect of indonesian medicinal plant extracts against dengue virus in vitro and in silico. Pathogens. 2019;8:85.",
"DOI": null,
"article": 321
},
{
"id": 13365,
"serial_number": 30,
"pmc": null,
"reference": "Tresnaningtyas SA, Sjatha F, et al. Infectivity and viability of dengue virus infected hepatocytes cocultured with peripheral blood mononuclear cells from a healthy subject. Medical Journal of Indonesia. 2020;29:260-7.",
"DOI": null,
"article": 321
},
{
"id": 13366,
"serial_number": 31,
"pmc": null,
"reference": "Kartika A, Dewi B, et al. Cassia alata butanol fraction anti-inflammatory effect on early expression of nfκb and cytokines in denv-1 infected pbmcs. Journal of Applied Pharmaceutical Science. 2024.",
"DOI": null,
"article": 321
},
{
"id": 13367,
"serial_number": 32,
"pmc": null,
"reference": "Rao X, Huang X, et al. An improvement of the 2ˆ (–delta delta ct) method for quantitative real-time polymerase chain reaction data analysis. Biostatistics, bioinformatics and biomathematics. 2013;3:71.",
"DOI": null,
"article": 321
},
{
"id": 13368,
"serial_number": 33,
"pmc": null,
"reference": "Tarasuk M, Songprakhon P, et al. Alpha-mangostin inhibits viral replication and suppresses nuclear factor kappa b (nf-κb)-mediated inflammation in dengue virus infection. Scientific Reports. 2022;12:16088.",
"DOI": null,
"article": 321
},
{
"id": 13369,
"serial_number": 34,
"pmc": null,
"reference": "Yi B, Hu X, et al. Nuclear nf-κb p65 in peripheral blood mononuclear cells correlates with urinary mcp-1, rantes and the severity of type 2 diabetic nephropathy. PLoS One. 2014;9:e99633.",
"DOI": null,
"article": 321
},
{
"id": 13370,
"serial_number": 35,
"pmc": null,
"reference": "Staples KJ, Smallie T, et al. Il-10 induces il-10 in primary human monocyte-derived macrophages via the transcription factor stat3. The Journal of Immunology. 2007;178:4779-85.",
"DOI": null,
"article": 321
},
{
"id": 13371,
"serial_number": 36,
"pmc": null,
"reference": "Troost B, Smit JM. Recent advances in antiviral drug development towards dengue virus. Current opinion in virology. 2020;43:9-21.",
"DOI": null,
"article": 321
},
{
"id": 13372,
"serial_number": 37,
"pmc": null,
"reference": "Shukla R, Rajpoot RK, et al. Cocculus hirsutus-derived phytopharmaceutical drug has potent anti-dengue activity. Frontiers in Microbiology. 2021;12:746110.",
"DOI": null,
"article": 321
},
{
"id": 13373,
"serial_number": 38,
"pmc": null,
"reference": "Oprea T, Mestres J. Drug repurposing: Far beyond new targets for old drugs. The AAPS journal. 2012;14:759-63.",
"DOI": null,
"article": 321
},
{
"id": 13374,
"serial_number": 39,
"pmc": null,
"reference": "Qiu L, Patterson SE, et al. Nucleobases and corresponding nucleosides display potent antiviral activities against dengue virus possibly through viral lethal mutagenesis. PLoS neglected tropical diseases. 2018;12:e0006421.",
"DOI": null,
"article": 321
},
{
"id": 13375,
"serial_number": 40,
"pmc": null,
"reference": "Furuta Y, Takahashi K, et al. In vitro and in vivo activities of anti-influenza virus compound t-705. Antimicrobial agents and chemotherapy. 2002;46:977-81.",
"DOI": null,
"article": 321
},
{
"id": 13376,
"serial_number": 41,
"pmc": null,
"reference": "Gunaydin-Akyildiz A, Aksoy N, et al. Favipiravir induces oxidative stress and genotoxicity in cardiac and skin cells. Toxicology letters. 2022;371:9-16.",
"DOI": null,
"article": 321
},
{
"id": 13377,
"serial_number": 42,
"pmc": null,
"reference": "Indrayanto G, Putra GS, et al. Validation of in-vitro bioassay methods: Application in herbal drug research. Profiles of drug substances, excipients and related methodology. 2021;46:273-307.",
"DOI": null,
"article": 321
},
{
"id": 13378,
"serial_number": 43,
"pmc": null,
"reference": "Smee DF, Hurst BL, et al. Evaluation of cell viability dyes in antiviral assays with rna viruses that exhibit different cytopathogenic properties. Journal of virological methods. 2017;246:51-7.",
"DOI": null,
"article": 321
},
{
"id": 13379,
"serial_number": 44,
"pmc": null,
"reference": "Tipih T, Meade-White K, et al. Favipiravir and ribavirin protect immunocompetent mice from lethal cchfv infection. Antiviral Research. 2023;218:105703.",
"DOI": null,
"article": 321
},
{
"id": 13380,
"serial_number": 45,
"pmc": null,
"reference": "Inklebarger J, Gyer M, et al. Cinchona bark for the treatment of covid-19 pnemonia: A modern review of the potential anti-viral therapeutic applications of an old treatment. International Journal of Medical Science and Clinical Invention. 2020;7:4795-801.",
"DOI": null,
"article": 321
},
{
"id": 13381,
"serial_number": 46,
"pmc": null,
"reference": "Guo H, Bossila E, et al. Dual immune regulatory roles of interleukin-33 in pathological conditions. Cells. 2022; 11: 3237. s Note: MDPI stays neutral with regard to jurisdictional claims in published …; 2022.",
"DOI": null,
"article": 321
},
{
"id": 13382,
"serial_number": 47,
"pmc": null,
"reference": "Utama IMS, Lukman N, et al. Dengue viral infection in indonesia: Epidemiology, diagnostic challenges, and mutations from an observational cohort study. PLOS Neglected Tropical Diseases. 2019;13:e0007785.",
"DOI": null,
"article": 321
}
]
},
{
"id": 320,
"slug": "178-1730138656-trajectory-of-human-migration-insights-from-autosomal-and-non-autosomal-variant-clustering-patterns",
"featured": false,
"slider": false,
"issue": "Vol8 Issue1",
"type": "short_communication",
"manuscript_id": "178-1730138656",
"recieved": "2024-10-28",
"revised": null,
"accepted": "2025-01-07",
"published": "2025-01-24",
"pdf_file": "https://jabet.bsmiab.org/media/pdf_file/2025/31/178-1730138656.pdf",
"title": "Trajectory of human migration: Insights from autosomal and non-autosomal variant clustering patterns",
"abstract": "<p>Genetic variations present in the Y chromosomal and mitochondrial DNA provide the molecular basis to support the archeological and anthropological evidence that formulates the theories for describing the trajectory of human migration, which started almost 200,000 years ago out of Africa. These genetic variations have long been used as ancestry informative markers (AIMs) in forensics and evolutionary studies, primarily because of their uniparental inheritance and lack of recombination, despite the fact that gender specific gene flow and socio-cultural practices may cause discrepancies. Moreover, the genetic markers on the Y- chromosome constitute only a minor fraction of the entire human genome. Here, we analyzed over 75 million genetic variants (single nucleotide variants (SNVs) and short insertion-deletion (InDels)) within consecutive 2500000 base pair windows in the autosomal as well as non-autosomal chromosomes of 22 populations in four major geographic regions that are cataloged in the 1000 Genomes Project to understand the clustering patterns of the autosomal and non-autosomal variants. While autosomal and X-chromosomal variants cluster the populations of similar geographic regions together, Y-chromosomal variants constantly place the East Asian Japanese, and the European Finnish populations in a single clade in hierarchical clusters. In conclusion, this comprehensive genome-wide analysis essentially introduces new insights into mapping the path of human migration based on the Y-chromosomal and other chromosomal variants.<strong> </strong></p>",
"journal_reference": "J Adv Biotechnol Exp Ther. 2025; 8(1): 139-149",
"academic_editor": "Md Jamal Uddin, PhD; ABEx Bio-Research Center, Bangladesh",
"cite_info": "Tuli SS, Sarker J, et al. Trajectory of human migration: Insights from autosomal and non-autosomal variant clustering patterns. J Adv Biotechnol Exp Ther. 2025; 8(1): 139-149.",
"keywords": [
"Autosomal variant",
"Clustering pattern",
"Human migration",
"Non-autosomal variant"
],
"DOI": "10.5455/jabet.2025.12",
"sections": [
{
"section_number": 1,
"section_title": "INTRODUCTION",
"body": "<p>One of the most widely accepted human migration theories, ‘Out of Africa Theory’ proposes that the first anatomically modern humans arose in Africa more than 200,000 years ago [<a href=\"#r-1\">1</a>]. It also suggests that the other populations around the globe are descendants of the Africans [<a href=\"#r-2\">2</a>]. The distribution of the Y chromosomal haplogroup by geographical area supports the 'Out of Africa' theory [<a href=\"#r-3\">3</a>]. From Africa, modern humans headed toward Asia and other distant regions [<a href=\"#r-4\">4</a>]. Despite the widespread acceptance of the idea that modern humans left Africa and dispersed worldwide, the next route they took remains a subject of debate. Two proposed theories potentially support the migration of modern humans out of Africa: the northern route of dispersal and the southern route of dispersal. The northern dispersal theory suggests that modern humans left Africa around 120,000 years ago and migrated through the Sinai Peninsula to the Levant [<a href=\"#r-5\">5</a>]. The southern dispersal route suggests that early human migration occurred along the southern coast of Asia, extended from the Arabian Peninsula, via Persia and India, and eventually reached Southeast Asia and Oceania [<a href=\"#r-6\">6</a>]. The theory that depicts the emergence of modern humans in Africa and the migration trajectory of modern humans was defined based on the mitochondrial DNA [<a href=\"#r-7\">7</a>]. Detailed phylogenetic analyses of mitochondrial DNA support the southern dispersion. At the same time, investigation of the non-recombining portion of the Y chromosome (NRY) haplogroups indicates this pattern of migrations from south to north [<a href=\"#r-8\">8</a>].</p>\r\n\r\n<p>The primary reason for using Y chromosomal DNA and mitochondrial DNA in these studies is that their inheritance is rather straightforward. The Y chromosome is inherited only from the father, while mitochondria are inherited only from the mother. These do not undergo recombination events [<a href=\"#r-7\">7</a>]. That is why genetic variants of the Y chromosome and mitochondria are used as potential tools to trace the migration trajectory [<a href=\"#r-9\">9</a>].</p>\r\n\r\n<p>Many genetic loci are geographically stratified, and these show significant differences in allele frequencies among people from different geographic regions [<a href=\"#r-10\">10</a>]. These loci are called ancestry-informative markers (AIMs). AIMs not only help determine the geographical ancestry of a population, but they also have important applications in fields such as forensics, genetic association studies, drug response testing, admixture mapping, and reconstructing evolutionary histories. While mitochondrial DNA and Y chromosomal variants serve as excellent markers for determining the ancestry and lineage of individuals, these have limitations as they offer information for either paternal or maternal inheritance [<a href=\"#r-11\">11</a>]. On top of that, local and cultural traditions influence these markers over time. Most human societies practice patrilocality. Therefore, Y-chromosome variants exhibit greater territorial localization compared to mitochondrial DNA variants [<a href=\"#r-12\">12</a>]. Again, the migration of Tibeto-Burman-speaking tribes from China to Southeast Asia and then to northern India demonstrated a male-biased dispersal pattern and a paucity of genetic diversity in mitochondrial DNA as a result of agricultural expansion [<a href=\"#r-13\">13</a>]. Therefore, the dispersal of genetic variants of mitochondrial DNA and the Y chromosome is not aligned with the same flow [<a href=\"#r-8\">8</a>]. It might create some inconsistencies in defining the exact inheritance and migration patterns of humans. We, therefore, sought to analyze all genetic variants of the 22 autosomal and the non-autosomal chromosomes to find any deviation in the clustering pattern. By entailing all the variations in autosomal and non-autosomal chromosomes, a more comprehensive depiction of human migration is expected to be generated.</p>"
},
{
"section_number": 2,
"section_title": "MATERIALS AND METHODS",
"body": "<p><strong>Data source</strong></p>\r\n\r\n<p>The allele frequency calculator (AFC) tool at Ensembl genome browser [<a href=\"#r-14\">14</a>] provides an interface to retrieve allele frequency for variants within a given genomic interval (the maximum range is 2500000 base pairs) for any of the given populations listed in the 1000 Genomes Project [<a href=\"#r-15\">15</a>]. We used the AFC tool at Ensembl genome browser [<a href=\"#r-14\">14</a>] to retrieve the allele frequencies of 75,160,938 genetic variants, including single nucleotide variants (SNVs) and short insertions and deletions (InDels), from 2,504 people from 22 populations in four major geographic regions around the globe: Africa (AFR), Europe (EUR), East Asia (EAS), and South Asia (SAS). <a href=\"#Table-1\">Table 1</a> provides the chromosome-wise breakdown of variant numbers analyzed in this study. Supplementary table 1 provides the list of populations and their geographic distributions. The variants on each chromosome were downloaded with a window of consecutive 2500000 base pairs (<em>e.g.</em>, variants in chromosome 1 were retrieved within the ranges: 1- 2500000, 2500001-5000000, ... , 247500001-248956422). This study involved neither any human nor animal, and hence, no ethical approval was required.</p>\r\n\r\n<p style=\"text-align:center\"><strong>Table 1</strong>. Number of genetic variants of all chromosomes.</p>\r\n\r\n<div id=\"Table-1\">\r\n<p style=\"text-align:center\"><a href=\"https://jabet.bsmiab.org/table/178-1730138656-table1/\"> Table-1</a></p>\r\n</div>\r\n\r\n<p><strong>Data formatting</strong></p>\r\n\r\n<p>We applied a Python script to reformat and organize the downloaded data. The Python script is provided in supplementary table 2. An example of the data format is provided in supplementary table 3. The coordinates of centromeric regions were retrieved from the UCSC genome browser database [<a href=\"#r-16\">16</a>]. The coordinates of centromeric regions are given in supplementary table 4.</p>\r\n\r\n<p> </p>\r\n\r\n<p><strong>Clustering and analysis of data</strong></p>\r\n\r\n<p>The statistical tools available at the web-based Metaboanalyst 5.0 platform [<a href=\"#r-17\">17</a>] were used for unsupervised clustering of the variant frequency data by principal component analysis (PCA) as well as hierarchical clustering for each 2500000 base pair window. The input data format is shown in supplementary table 3. The variant frequencies were not normalized, scaled, transformed, or filtered. Hierarchical clustering was done following the Euclidian distance measure and Ward’s clustering algorithm. </p>"
},
{
"section_number": 3,
"section_title": "RESULTS",
"body": "<p><strong>Clustering based on the variants on autosomes and X chromosome</strong></p>\r\n\r\n<p>By analyzing over 75 million SNVs and InDels among 22 populations distributed in four geographic regions through principal component analysis and hierarchical clustering in a total of 1146 plots, we have identified a notable pattern difference between variants of the autosomes and X chromosome with those of the Y chromosome. In the PCA plots, the allele frequencies at the variant loci in all autosomes and the X chromosome cluster the populations based on the geographic locations (<a href=\"#figure1\">Figure 1</a>). In these plots, AFR populations remain closely clustered and positioned distantly from the other populations. The EAS populations also exhibit more or less close clusters, although, unlike the AFR populations, the cluster positions were not strictly distinctive. </p>\r\n\r\n<p>In population dendrograms, too, the AFR populations form a distinct and separate clade, while the other populations appear in a second clade (<a href=\"#figure2\">Figure 2</a>). The SAS and EUR populations generally share a single node in this latter branch for both the autosomal and the X chromosomal variants. This pattern significantly portrays that the SAS and EUR populations have higher similarities in their autosomal and X chromosomal genetic material (<a href=\"#figure2\">Figure 2</a>).</p>\r\n\r\n<div id=\"figure1\">\r\n<figure class=\"image\"><img alt=\"\" height=\"491\" src=\"/media/article_images/2025/06/26/178-1730138656-Figure1.jpg\" width=\"500\" />\r\n<figcaption><strong>Figure 1</strong>. Clustering of genetic variants in four super-populations in PCA plot (A-I). Randomly selected plots are shown. Chromosome number and genetic regions are shown in each plot (e.g., “1: 47500001-50000000” indicates base positions between 47500001 and 50000000 in human chromosome 1). AFR- African, EAS- East Asian, EUR- European, SAS- South Asian.</figcaption>\r\n</figure>\r\n</div>\r\n\r\n<div id=\"figure2\">\r\n<figure class=\"image\"><img alt=\"\" height=\"534\" src=\"/media/article_images/2025/06/26/178-1730138656-Figure2.jpg\" width=\"500\" />\r\n<figcaption><strong>Figure 2</strong>. Hierarchical clustering of autosomal and X chromosomal variants (A-I). Chromosome number and genetic regions are shown in each plot (e.g., “1: 1-2500000” indicates base positions between 1 and 2500000 in human chromosome 1). African super-population (AFR)- ((Yoruba in Ibadan, Nigeria (YRI); Luhya in Webuye, Kenya (LWK); Gambian in Western Divisions in the Gam-bia (GWD); Mende in Sierra Leone (MSL); Esan in Nigeria (ESN); Americans of African Ancestry in SW USA (ASW); African Caribbeans in Barbados (ACB)); East Asian (EAS)- ((Han Chinese in Beijing, China (CHB); Japanese in Tokyo, Japan (JPT); Southern Han Chinese (CHS); Chinese Dai in Xishuangbanna, China (CDX); Kinh in Ho Chi Minh City, Vietnam (KHV)); European (EUR)- ((Utah Residents (CEPH) with Northern and Western European Ancestry (CEU); Toscani in Italia (TSI); Finnish in Finland (FIN); British in England and Scotland (GBR); Iberian Population in Spain (IBS)); South Asian (SAS)- ((Gujarati Indian from Houston, Texas (GIH); Punjabi from Lahore, Pakistan (PJL); Bengali from Bangladesh (BEB); Sri Lankan Tamil from the UK (STU); Indian Telugu from the UK (ITU)).</figcaption>\r\n</figure>\r\n</div>\r\n\r\n<p> </p>\r\n\r\n<p><strong>Clustering based on the variants on the Y chromosome</strong></p>\r\n\r\n<p>Like the autosomes and the X chromosome variants, the allele frequencies at the Y chromosome variant loci cluster the AFR populations together (<a href=\"#figure3\">Figure 3</a>). The common observation from the variants of the Y chromosome is that the SAS populations and the EUR populations, except the Finnish (FIN) population, emerge from the common node in the dendrograms (<a href=\"#figure4\">Figure 4</a>). A distinctive clustering pattern of the Y chromosomal variants is observed for the Japanese (JPT) and the FIN populations. The FIN population of the EUR superpopulation separately clusters with the JPT population, which belongs to the EAS superpopulation (<a href=\"#4\">Figure 4</a>). Only Y chromosome variants exhibit this specific clustering pattern.</p>\r\n\r\n<div id=\"figure3\">\r\n<figure class=\"image\"><img alt=\"\" height=\"474\" src=\"/media/article_images/2025/06/26/178-1730138656-Figure3.jpg\" width=\"500\" />\r\n<figcaption><strong>Figure 3</strong>. Clustering of Y chromosomal variants in PCA plot (A-I). Randomly selected plots are shown. Chromosome number and genetic regions are shown in each plot (e.g., “Y: 2500001-5000000” indicates base positions between 2500001 and 5000000 in human chromosome Y). AFR- African, EAS- East Asian, EUR- European, SAS- South Asian.</figcaption>\r\n</figure>\r\n</div>\r\n\r\n<div id=\"figure4\">\r\n<figure class=\"image\"><img alt=\"\" height=\"501\" src=\"/media/article_images/2025/06/26/178-1730138656-Figure4.jpg\" width=\"500\" />\r\n<figcaption><strong>Figure 4</strong>. Hierarchical clustering of Y chromosomal variants (A-I). Chromosome number and genetic regions are shown in each plot (e.g., “Y: 12500001-15000000” indicates base positions between 12500001 and 15000000 in human chromosome Y). African super-population (AFR)- ((Yoruba in Ibadan, Nigeria (YRI); Luhya in Webuye, Kenya (LWK); Gambian in Western Divisions in the Gambia (GWD); Mende in Sierra Leone (MSL); Esan in Nigeria (ESN); Americans of African Ancestry in SW USA (ASW); African Caribbeans in Barbados (ACB)); East Asian (EAS)- ((Han Chinese in Beijing, China (CHB); Japanese in Tokyo, Japan (JPT); Southern Han Chinese (CHS); Chinese Dai in Xishuangbanna, China (CDX); Kinh in Ho Chi Minh City, Vietnam (KHV)); European (EUR)- ((Utah Residents (CEPH) with Northern and Western European Ancestry (CEU); Toscani in Italia (TSI); Finnish in Finland (FIN); British in England and Scotland (GBR); Iberian Population in Spain (IBS)); South Asian (SAS)- ((Gujarati Indian from Houston, Texas (GIH); Punjabi from Lahore, Pakistan (PJL); Bengali from Bangladesh (BEB); Sri Lankan Tamil from the UK (STU); Indian Telugu from the UK (ITU)).</figcaption>\r\n</figure>\r\n\r\n<p> </p>\r\n</div>\r\n\r\n<p><strong>Clustering based on the variants around the centromere of the chromosomes</strong></p>\r\n\r\n<p>The regions of centromeres constitute common heterochromatin sites in chromosomes and the loci near centromeres exhibit low levels of recombination [<a href=\"#r-18\">18-20</a>]. Coordinates of centromeric regions in different chromosomes are shown in supplementary table 4. The variants at loci encompassing the regions of the centromere cluster the populations of the similar geographic regions together (<a href=\"#figure5\">Figure 5</a>). However, in many of these plots, the EUR and the SAS populations cluster very close- a pattern observed with the Y-chromosome variants (<a href=\"#figure3\">Figure 3</a>), which might be indicative of the comparatively more genetic relatedness between EUR and SAS populations.</p>\r\n\r\n<div id=\"figure5\">\r\n<figure class=\"image\"><img alt=\"\" height=\"474\" src=\"/media/article_images/2025/06/26/178-1730138656-Figure5.jpg\" width=\"500\" />\r\n<figcaption><strong>Figure 5</strong>. Clustering of variants located near the centromeric regions in PCA plot (A-I). Randomly selected plots are shown. Chromosome number and genetic regions are shown in each plot (e.g., “1: 120000001-122500000” indicates base positions between 120000001 and 122500000 in human chromosome 1). AFR- African, EAS- East Asian, EUR- European, SAS- South Asian.</figcaption>\r\n</figure>\r\n</div>"
},
{
"section_number": 4,
"section_title": "DISCUSSION",
"body": "<p>The 22 autosomes constitute the major portion of the human genome. By incorporating and analyzing autosomal variants along with non-autosomal variants, we produced an extensive genome-wide study to interpret human geographical ancestry more persuasively. We observed that autosomal and X-chromosomal variants cluster differently than Y-chromosomal variants, not at random, but rather consistently. The clustering pattern with autosomal and X-chromosomal variants (<a href=\"#figure1\">Figures 1</a> and <a href=\"#figure2\">2</a>) reiterates the fossil and genetic evidence [<a href=\"#r-21\">21-23</a>] suggesting that anatomically, modern humans evolved in Africa and then migrated into Europe and Asia in an approximately West-to-East pattern. Geographic isolation, interbreeding, and adaptation in new environments later differentiated human populations from each other [<a href=\"#r-24\">24</a>]. EUR and SAS populations have been reported to be more related in multiple studies [<a href=\"#r-10\">10</a>, <a href=\"#r-25\">25-27</a>]. There is greater Neanderthal mixing in EAS populations than in EUR populations, and part of it occurred after East Asians and Europeans separated [<a href=\"#r-28\">28-30</a>].</p>\r\n\r\n<p>Mitochondrial DNA, having a small circular genome with a higher mutation rate than nuclear DNA, serves as a potential marker to identify the migration pattern of humans. As the mitochondrial genome is inherited solely from the mother, it essentially helps to understand the maternal ancestry, thereby the pattern of migration in light of movement and inheritance of female genetic material. In comparison to mitochondrial markers, Y chromosomal markers offer several advantages as ancestry markers. The Y chromosome contains a wide range of polymorphisms such as base substitution, indels, duplication, and inversion due to its larger size and higher complexity than those of mitochondrial DNA [<a href=\"#r-31\">31</a>]. Y chromosomal DNA regions have a lower mutation rate compared to that of the mitochondrial genome. The lower mutation rate of the Y chromosome helps to ascertain the ancestry of humans more accurately, as these mutations pass down to the descendants more stably [<a href=\"#r-32\">32</a>]. Therefore, polymorphisms found in the Y chromosomes have emerged as important markers to distinguish human genetic diversity according to geographic locations. Also, Y chromosomal regions do not undergo recombination like the other parts of the human genome, such as the autosomes and X chromosome [<a href=\"#r-33\">33, 34</a>], which may explain the close clustering of the EUR and SAS populations for the variants in the Y-chromosomal and the near-centromeric regions of other chromosomes (<a href=\"#figure3\">Figures 3</a> and <a href=\"#figure5\">5</a>). </p>\r\n\r\n<p>This study reveals an intriguing pattern in the Y chromosomal variants, leading to a notable distinction in the hierarchical clustering patterns between the Y chromosomal and other chromosomal variants (<a href=\"#figure4\">Figure 4</a>). Specifically, the FIN population, distinct from other EUR populations, consistently aligns with the JPT population, a part of the EAS super population. For the autosomal and X-chromosomal variants, this pattern is not completely absent. There is archaeological and cultural evidence that might support this clustering pattern. In the past, Finnish people spoke the Uralic language, which is distinct from the Indo-European languages generally spoken by Europeans. The Uralic language group was previously known as Finno-Ugric, which originated in north-central Asia. Also, a study of Y chromosome markers showed that Europeans who speak Uralic languages share Y-chromosome haplotypes with people from central and northeastern Asia, indicating a significant paternal genetic contribution from Asia to these northern European populations [<a href=\"#r-35\">35</a>]. The sea plays an enormous role in Japanese culture, history, society, art, and identity. The Pacific Ocean, the Sea of Okhotsk, the Sea of Japan, and the East China Sea surround Japan. Human habitation in Japan certainly occurred by sea routes [<a href=\"#r-36\">36</a>]. Is it possible that during any such voyage, a group of the early ancestors of the Japanese population, dominated mostly by males, set foot on a European coast?</p>\r\n\r\n<p>Estimation of the ancestry of individuals based on their genetic inheritance is an emerging area of research. Understanding human migration routes and history in light of the genetic structure of the populations can be a great way to hypothesize and comprehend how the individuals of a population are susceptible to any disease. Many studies have already found that susceptibility to diseases varies from population to population. For example, individuals from African lineages have been identified as having a greater susceptibility to asthma compared to those of European descent [<a href=\"#r-37\">37</a>]. Again, people of African ancestry are more susceptible to encountering strokes as a consequence of cardiovascular diseases, whereas individuals of South Asian descent are more likely to suffer from heart attacks [<a href=\"#r-38\">38</a>]. Also, infectious diseases with higher prevalence and extensive geographic distributions may induce substantial genetic variation in susceptibility [<a href=\"#r-39\">39-41</a>].</p>\r\n\r\n<p>This study only analyzed the genome-wide variant data available for 2,504 people from 22 populations in four major geographic regions. The inclusion of more samples from a wider number of populations from different geographic regions would give a more complete picture of the trajectory of human migration.</p>"
},
{
"section_number": 5,
"section_title": "CONCLUSIONS",
"body": "<p>The current investigation reveals distinct differences in population-specific clustering patterns of genetic variants that reside on the Y and other chromosomes. Finally, this comprehensive analysis of autosomal and non-autosomal variants brought additional perspectives to the human migration trajectory.</p>"
},
{
"section_number": 6,
"section_title": "ACKNOWLEDGEMENTS",
"body": "<p>This study was supported by grants (Grant No. 2022-2023) from the University Grants Commission (UGC), Bangladesh in the University of Dhaka. The authors are thankful for the support.</p>"
},
{
"section_number": 7,
"section_title": "AUTHOR CONTRIBUTIONS",
"body": "<p>SST: Investigation, methodology, writing; JS: Investigation, methodology, writing; MSR: Data curation; AB: Investigation, methodology; RN: Investigation, methodology; TA: Investigation, methodology; MWM: Methodology, reviewing; AAS: Conceptualization, fund acquisition, project administration, resources, supervision, reviewing. All authors have approved the final version of the manuscript.</p>"
},
{
"section_number": 8,
"section_title": "CONFLICTS OF INTEREST",
"body": "<p>There is no conflict of interest among the authors.</p>"
},
{
"section_number": 9,
"section_title": "SUPPLEMENTARY MATERIALS",
"body": "<p>Supplementary Table 1. List of populations with their geographic distribution, Supplementary Table 2. Python code for rearranging the columns of the data files, Supplementary Table 3. An example of the data format, and Supplementary Table 4. Chromosomal position of centromeres (<a href=\"https://jabet.bsmiab.org/media/supply_file/2025/23/10/178-1730138656-Supplementary_materials.pdf\">Supplementary materials</a>).</p>"
}
],
"figures": [
{
"figure": "https://jabet.bsmiab.org/media/article_images/2025/06/26/178-1730138656-Figure1.jpg",
"caption": "Figure 1. Clustering of genetic variants in four super-populations in PCA plot (A-I). Randomly selected plots are shown. Chromosome number and genetic regions are shown in each plot (e.g., “1: 47500001-50000000” indicates base positions between 47500001 and 50000000 in human chromosome 1). AFR- African, EAS- East Asian, EUR- European, SAS- South Asian.",
"featured": true
},
{
"figure": "https://jabet.bsmiab.org/media/article_images/2025/06/26/178-1730138656-Figure2.jpg",
"caption": "Figure 2. Hierarchical clustering of autosomal and X chromosomal variants (A-I). Chromosome number and genetic regions are shown in each plot (e.g., “1: 1-2500000” indicates base positions between 1 and 2500000 in human chromosome 1). African super-population (AFR)- ((Yoruba in Ibadan, Nigeria (YRI); Luhya in Webuye, Kenya (LWK); Gambian in Western Divisions in the Gam-bia (GWD); Mende in Sierra Leone (MSL); Esan in Nigeria (ESN); Americans of African Ancestry in SW USA (ASW); African Caribbeans in Barbados (ACB)); East Asian (EAS)- ((Han Chinese in Beijing, China (CHB); Japanese in Tokyo, Japan (JPT); Southern Han Chinese (CHS); Chinese Dai in Xishuangbanna, China (CDX); Kinh in Ho Chi Minh City, Vietnam (KHV)); European (EUR)- ((Utah Residents (CEPH) with Northern and Western European Ancestry (CEU); Toscani in Italia (TSI); Finnish in Finland (FIN); British in England and Scotland (GBR); Iberian Population in Spain (IBS)); South Asian (SAS)- ((Gujarati Indian from Houston, Texas (GIH); Punjabi from Lahore, Pakistan (PJL); Bengali from Bangladesh (BEB); Sri Lankan Tamil from the UK (STU); Indian Telugu from the UK (ITU)).",
"featured": false
},
{
"figure": "https://jabet.bsmiab.org/media/article_images/2025/06/26/178-1730138656-Figure3.jpg",
"caption": "Figure 3. Clustering of Y chromosomal variants in PCA plot (A-I). Randomly selected plots are shown. Chromosome number and genetic regions are shown in each plot (e.g., “Y: 2500001-5000000” indicates base positions between 2500001 and 5000000 in human chromosome Y). AFR- African, EAS- East Asian, EUR- European, SAS- South Asian.",
"featured": false
},
{
"figure": "https://jabet.bsmiab.org/media/article_images/2025/06/26/178-1730138656-Figure4.jpg",
"caption": "Figure 4. Hierarchical clustering of Y chromosomal variants (A-I). Chromosome number and genetic regions are shown in each plot (e.g., “Y: 12500001-15000000” indicates base positions between 12500001 and 15000000 in human chromosome Y). African super-population (AFR)- ((Yoruba in Ibadan, Nigeria (YRI); Luhya in Webuye, Kenya (LWK); Gambian in Western Divisions in the Gambia (GWD); Mende in Sierra Leone (MSL); Esan in Nigeria (ESN); Americans of African Ancestry in SW USA (ASW); African Caribbeans in Barbados (ACB)); East Asian (EAS)- ((Han Chinese in Beijing, China (CHB); Japanese in Tokyo, Japan (JPT); Southern Han Chinese (CHS); Chinese Dai in Xishuangbanna, China (CDX); Kinh in Ho Chi Minh City, Vietnam (KHV)); European (EUR)- ((Utah Residents (CEPH) with Northern and Western European Ancestry (CEU); Toscani in Italia (TSI); Finnish in Finland (FIN); British in England and Scotland (GBR); Iberian Population in Spain (IBS)); South Asian (SAS)- ((Gujarati Indian from Houston, Texas (GIH); Punjabi from Lahore, Pakistan (PJL); Bengali from Bangladesh (BEB); Sri Lankan Tamil from the UK (STU); Indian Telugu from the UK (ITU)).",
"featured": false
},
{
"figure": "https://jabet.bsmiab.org/media/article_images/2025/06/26/178-1730138656-Figure5.jpg",
"caption": "Figure 5. Clustering of variants located near the centromeric regions in PCA plot (A-I). Randomly selected plots are shown. Chromosome number and genetic regions are shown in each plot (e.g., “1: 120000001-122500000” indicates base positions between 120000001 and 122500000 in human chromosome 1). AFR- African, EAS- East Asian, EUR- European, SAS- South Asian.",
"featured": false
}
],
"authors": [
{
"id": 1586,
"affiliation": [
{
"affiliation": "Department of Genetic Engineering and Biotechnology, University of Dhaka, Dhaka, Bangladesh"
}
],
"first_name": "Samayeta Sarkar",
"family_name": "Tuli",
"email": null,
"author_order": 1,
"ORCID": null,
"corresponding": false,
"co_first_author": true,
"co_author": false,
"corresponding_author_info": "",
"article": 320
},
{
"id": 1587,
"affiliation": [
{
"affiliation": "Department of Genetic Engineering and Biotechnology, University of Dhaka, Dhaka, Bangladesh"
}
],
"first_name": "Joyatry",
"family_name": "Sarker",
"email": null,
"author_order": 2,
"ORCID": null,
"corresponding": false,
"co_first_author": true,
"co_author": false,
"corresponding_author_info": "",
"article": 320
},
{
"id": 1588,
"affiliation": [
{
"affiliation": "Department of Computer Science and Engineering, Southeast University, Dhaka, Bangladesh"
},
{
"affiliation": "University of Illinois Urbana-Champaign, Urbana, IL-61820, USA"
}
],
"first_name": "Mrinmoy Saha",
"family_name": "Roddur",
"email": null,
"author_order": 3,
"ORCID": null,
"corresponding": false,
"co_first_author": false,
"co_author": false,
"corresponding_author_info": "",
"article": 320
},
{
"id": 1589,
"affiliation": [
{
"affiliation": "Department of Genetic Engineering and Biotechnology, University of Dhaka, Dhaka, Bangladesh"
}
],
"first_name": "Anik",
"family_name": "Biswas",
"email": null,
"author_order": 4,
"ORCID": null,
"corresponding": false,
"co_first_author": false,
"co_author": false,
"corresponding_author_info": "",
"article": 320
},
{
"id": 1590,
"affiliation": [
{
"affiliation": "Department of Genetic Engineering and Biotechnology, University of Dhaka, Dhaka, Bangladesh"
}
],
"first_name": "Reefa",
"family_name": "Nawar",
"email": null,
"author_order": 5,
"ORCID": null,
"corresponding": false,
"co_first_author": false,
"co_author": false,
"corresponding_author_info": "",
"article": 320
},
{
"id": 1591,
"affiliation": [
{
"affiliation": "Department of Genetic Engineering and Biotechnology, University of Dhaka, Dhaka, Bangladesh"
}
],
"first_name": "Tahmina",
"family_name": "Akter",
"email": null,
"author_order": 6,
"ORCID": null,
"corresponding": false,
"co_first_author": false,
"co_author": false,
"corresponding_author_info": "",
"article": 320
},
{
"id": 1592,
"affiliation": [
{
"affiliation": "Department of Genetic Engineering and Biotechnology, University of Dhaka, Dhaka, Bangladesh"
}
],
"first_name": "Md. Wahid",
"family_name": "Murad",
"email": null,
"author_order": 7,
"ORCID": null,
"corresponding": false,
"co_first_author": false,
"co_author": false,
"corresponding_author_info": "",
"article": 320
},
{
"id": 1593,
"affiliation": [
{
"affiliation": "Department of Genetic Engineering and Biotechnology, University of Dhaka, Dhaka, Bangladesh"
}
],
"first_name": "Abu Ashfaqur",
"family_name": "Sajib",
"email": "abu.sajib@du.ac.bd",
"author_order": 8,
"ORCID": "https://orcid.org/0000-0003-1710-9865",
"corresponding": true,
"co_first_author": false,
"co_author": false,
"corresponding_author_info": "Abu Ashfaqur Sajib , Department of Genetic Engineering & Biotechnology, University of Dhaka, Dhaka 1000, Bangladesh. Email: abu.sajib@du.ac.bd",
"article": 320
}
],
"views": 645,
"downloads": 82,
"references": [
{
"id": 13295,
"serial_number": 1,
"pmc": null,
"reference": "Smith TM, Tafforeau P, et al. Earliest evidence of modern human life history in north african early homo sapiens. Proceedings of the National Academy of Sciences of the United States of America. 2007;104:6128-33.",
"DOI": null,
"article": 320
},
{
"id": 13296,
"serial_number": 2,
"pmc": null,
"reference": "Scerri EML, Chikhi L, et al. Beyond multiregional and simple out-of-africa models of human evolution. Nat Ecol Evol. 2019;3:1370-2.",
"DOI": null,
"article": 320
},
{
"id": 13297,
"serial_number": 3,
"pmc": null,
"reference": "Oppenheimer S. Out-of-africa, the peopling of continents and islands: Tracing uniparental gene trees across the map. Philos Trans R Soc Lond B Biol Sci. 2012;367:770-84.",
"DOI": null,
"article": 320
},
{
"id": 13298,
"serial_number": 4,
"pmc": null,
"reference": "Bae CJ, Douka K, et al. On the origin of modern humans: Asian perspectives. Science. 2017;358:eaai9067.",
"DOI": null,
"article": 320
},
{
"id": 13299,
"serial_number": 5,
"pmc": null,
"reference": "López S, van Dorp L, et al. Human dispersal out of africa: A lasting debate. Evolutionary bioinformatics online. 2016;11:57-68.",
"DOI": null,
"article": 320
},
{
"id": 13300,
"serial_number": 6,
"pmc": null,
"reference": "Endicott P, Metspalu M, et al. Genetic evidence on modern human dispersals in south asia: Y chromosome and mitochondrial DNA perspectives: The world through the eyes of two haploid genomes. In: Petraglia MD, Allchin B, editors. The evolution and history of human populations in south asia vertebrate paleobiology and paleoanthropology series. Dordrecht: Springer; 2007.",
"DOI": null,
"article": 320
},
{
"id": 13301,
"serial_number": 7,
"pmc": null,
"reference": "Stanyon R, Sazzini M, et al. Timing the first human migration into eastern asia. J Biol. 2009;8:18.",
"DOI": null,
"article": 320
},
{
"id": 13302,
"serial_number": 8,
"pmc": null,
"reference": "Stoneking M, Delfin F. The human genetic history of east asia: Weaving a complex tapestry. Curr Biol. 2010;20:R188-93.",
"DOI": null,
"article": 320
},
{
"id": 13303,
"serial_number": 9,
"pmc": null,
"reference": "Underhill PA, Kivisild T. Use of y chromosome and mitochondrial DNA population structure in tracing human migrations. Annu Rev Genet 2007;41:539-64.",
"DOI": null,
"article": 320
},
{
"id": 13304,
"serial_number": 10,
"pmc": null,
"reference": "Ahsan T, Urmi NJ, et al. Heterogeneity in the distribution of 159 drug-response related snps in world populations and their genetic relatedness. PloS one. 2020;15:e0228000.",
"DOI": null,
"article": 320
},
{
"id": 13305,
"serial_number": 11,
"pmc": null,
"reference": "Kersbergen P, van Duijn K, et al. Developing a set of ancestry-sensitive DNA markers reflecting continental origins of humans. BMC Genet. 2009;10:69.",
"DOI": null,
"article": 320
},
{
"id": 13306,
"serial_number": 12,
"pmc": null,
"reference": "Badro DA, Douaihy B, et al. Y-chromosome and mtdna genetics reveal significant contrasts in affinities of modern middle eastern populations with european and african populations. PloS one. 2013;8:e54616.",
"DOI": null,
"article": 320
},
{
"id": 13307,
"serial_number": 13,
"pmc": null,
"reference": "Wen B, Xie X, et al. Analyses of genetic structure of tibeto-burman populations reveals sex-biased admixture in southern tibeto-burmans. Am J Hum Genet. 2004;74:856-65.",
"DOI": null,
"article": 320
},
{
"id": 13308,
"serial_number": 14,
"pmc": null,
"reference": "Hunt SE, McLaren W, et al. Ensembl variation resources. Database (Oxford). 2018;2018::bay119.",
"DOI": null,
"article": 320
},
{
"id": 13309,
"serial_number": 15,
"pmc": null,
"reference": "Auton A, Brooks LD, et al. A global reference for human genetic variation. Nature. 2015;526:68-74.",
"DOI": null,
"article": 320
},
{
"id": 13310,
"serial_number": 16,
"pmc": null,
"reference": "Nassar LR, Barber GP, et al. The ucsc genome browser database: 2023 update. Nucleic Acids Res. 2023;51:D1188-D95.",
"DOI": null,
"article": 320
},
{
"id": 13311,
"serial_number": 17,
"pmc": null,
"reference": "Pang Z, Chong J, et al. Metaboanalyst 5.0: Narrowing the gap between raw spectra and functional insights. Nucleic Acids Res. 2021;49:W388-W96.",
"DOI": null,
"article": 320
},
{
"id": 13312,
"serial_number": 18,
"pmc": null,
"reference": "Carneiro M, Ferrand N, et al. Recombination and speciation: Loci near centromeres are more differentiated than loci near telomeres between subspecies of the european rabbit (oryctolagus cuniculus). Genetics. 2009;181:593-606.",
"DOI": null,
"article": 320
},
{
"id": 13313,
"serial_number": 19,
"pmc": null,
"reference": "Stump AD, Fitzpatrick MC, et al. Centromere-proximal differentiation and speciation in anopheles gambiae. Proceedings of the National Academy of Sciences of the United States of America. 2005;102:15930-5.",
"DOI": null,
"article": 320
},
{
"id": 13314,
"serial_number": 20,
"pmc": null,
"reference": "Schreiber M, Gao Y, et al. Recombination landscape divergence between populations is marked by larger low-recombining regions in domesticated rye. Mol Biol Evol. 2022;39:msac131.",
"DOI": null,
"article": 320
},
{
"id": 13315,
"serial_number": 21,
"pmc": null,
"reference": "Norris ET, Wang L, et al. Genetic ancestry, admixture and health determinants in latin america. BMC genomics. 2018;19:861.",
"DOI": null,
"article": 320
},
{
"id": 13316,
"serial_number": 22,
"pmc": null,
"reference": "Rotimi CN, Bentley AR, et al. The genomic landscape of african populations in health and disease. Hum Mol Genet. 2017;26:R225-R36.",
"DOI": null,
"article": 320
},
{
"id": 13317,
"serial_number": 23,
"pmc": null,
"reference": "Tishkoff SA, Reed FA, et al. The genetic structure and history of africans and african americans. Science. 2009;324:1035-44.",
"DOI": null,
"article": 320
},
{
"id": 13318,
"serial_number": 24,
"pmc": null,
"reference": "Hellwege JN, Keaton JM, et al. Population stratification in genetic association studies. Curr Protoc Hum Genet. 2017;95:1.22.1-1..3.",
"DOI": null,
"article": 320
},
{
"id": 13319,
"serial_number": 25,
"pmc": null,
"reference": "Li JZ, Absher DM, et al. Worldwide human relationships inferred from genome-wide patterns of variation. Science. 2008;319:1100-4.",
"DOI": null,
"article": 320
},
{
"id": 13320,
"serial_number": 26,
"pmc": null,
"reference": "Visscher H, Ross CJ, et al. Application of principal component analysis to pharmacogenomic studies in canada. Pharmacogenomics J. 2009;9:362-72.",
"DOI": null,
"article": 320
},
{
"id": 13321,
"serial_number": 27,
"pmc": null,
"reference": "Xu S. Human population admixture in asia. Genomics Inform. 2012;10:133-44.",
"DOI": null,
"article": 320
},
{
"id": 13322,
"serial_number": 28,
"pmc": null,
"reference": "Kim BY, Lohmueller KE. Selection and reduced population size cannot explain higher amounts of neandertal ancestry in east asian than in european human populations. Am J Hum Genet. 2015;96:454-61.",
"DOI": null,
"article": 320
},
{
"id": 13323,
"serial_number": 29,
"pmc": null,
"reference": "Villanea FA, Schraiber JG. Multiple episodes of interbreeding between neanderthal and modern humans. Nat Ecol Evol. 2019;3:39-44.",
"DOI": null,
"article": 320
},
{
"id": 13324,
"serial_number": 30,
"pmc": null,
"reference": "Wall JD, Yang MA, et al. Higher levels of neanderthal ancestry in east asians than in europeans. Genetics. 2013;194:199-209.",
"DOI": null,
"article": 320
},
{
"id": 13325,
"serial_number": 31,
"pmc": null,
"reference": "Jobling MA, Tyler-Smith C. Fathers and sons: The y chromosome and human evolution. Trends Genet. 1995;11:449-56.",
"DOI": null,
"article": 320
},
{
"id": 13326,
"serial_number": 32,
"pmc": null,
"reference": "Xue Y, Wang Q, et al. Human y chromosome base-substitution mutation rate measured by direct sequencing in a deep-rooting pedigree. Curr Biol. 2009;19:1453-7.",
"DOI": null,
"article": 320
},
{
"id": 13327,
"serial_number": 33,
"pmc": null,
"reference": "Syndercombe Court D. The y chromosome and its use in forensic DNA analysis. Emerg Top Life Sci. 2021;5:427-41.",
"DOI": null,
"article": 320
},
{
"id": 13328,
"serial_number": 34,
"pmc": null,
"reference": "Gubbay J, Lovell-Badge R. The mouse y chromosome. In: Wachtel SS, editor. Molecular genetics of sex determination: Academic Press; 1994. p. 43-67.",
"DOI": null,
"article": 320
},
{
"id": 13329,
"serial_number": 35,
"pmc": null,
"reference": "Zerjal T, Dashnyam B, et al. Genetic relationships of asians and northern europeans, revealed by y-chromosomal DNA analysis. Am J Hum Genet. 1997;60:1174-83.",
"DOI": null,
"article": 320
},
{
"id": 13330,
"serial_number": 36,
"pmc": null,
"reference": "Bestor V, Bestor TC, et al. Routledge handbook of japanese culture and society: Routledge; 2011.",
"DOI": null,
"article": 320
},
{
"id": 13331,
"serial_number": 37,
"pmc": null,
"reference": "Vergara C, Caraballo L, et al. African ancestry is associated with risk of asthma and high total serum ige in a population from the caribbean coast of colombia. Hum Genet. 2009;125:565-79.",
"DOI": null,
"article": 320
},
{
"id": 13332,
"serial_number": 38,
"pmc": null,
"reference": "Das R, Tatarinova TV, et al. Editorial: Association between individuals' genomic ancestry and variation in disease susceptibility. Front Genet 2022;13:831320.",
"DOI": null,
"article": 320
},
{
"id": 13333,
"serial_number": 39,
"pmc": null,
"reference": "Baker C, Antonovics J. Evolutionary determinants of genetic variation in susceptibility to infectious diseases in humans. PloS one. 2012;7:e29089.",
"DOI": null,
"article": 320
},
{
"id": 13334,
"serial_number": 40,
"pmc": null,
"reference": "Ahsan T, Fatema K, et al. Ethnic disparities in the distribution of gene expression modulating polymorphisms in key pro-inflammatory cytokines associated with covid-19 severities. Journal of Bangladesh Academy of Sciences. 2023;47:69–90.",
"DOI": null,
"article": 320
},
{
"id": 13335,
"serial_number": 41,
"pmc": null,
"reference": "Shoily SS, Ahsan T, et al. Disparities in covid-19 severities and casualties across ethnic groups around the globe and patterns of ace2 and pir variants. Infect Genet Evol. 2021;92:104888.",
"DOI": null,
"article": 320
}
]
},
{
"id": 319,
"slug": "178-1734634003-pharmacological-insights-and-therapeutic-advances-of-mangiferin-against-various-pathological-conditions-in-liver-diseases",
"featured": true,
"slider": false,
"issue": "Vol8 Issue1",
"type": "review_article",
"manuscript_id": "178-1734634003",
"recieved": "2024-12-01",
"revised": null,
"accepted": "2025-01-16",
"published": "2025-01-20",
"pdf_file": "https://jabet.bsmiab.org/media/pdf_file/2025/28/178-1734634003.pdf",
"title": "Pharmacological insights and therapeutic advances of mangiferin against various pathological conditions in liver diseases",
"abstract": "<p>Currently, liver diseases have become a serious global health issue, and this situation occurs due to the exposure of the liver to different agents, such as chemicals, alcohol, viruses, and autoimmune diseases. Mangiferin is a natural bioactive xanthone C-glycoside compound and a potent antioxidant that is widely found in medicinal plants such as the leaves of <em>Mangifera indica L</em>. (<em>Anacardiaceae</em>). It possesses a wide range of biological properties, such as antidiabetic, hepatoprotective, anti-inflammatory, antioxidant, and anticarcinogenic activities. The purpose of this literature review was to delineate the hepatoprotective effects of mangiferin, a natural bioactive compound without side effects, and explain how it protects the liver via the suppression of pathological conditions involved in liver diseases. Relevant published research articles from peer-reviewed journals were searched in PubMed and Google Scholar to gain insights into the consequences of mangiferin in liver diseases. Several studies have suggested that pretreatment with mangiferin decreases hepatic inflammation, oxidative stress, apoptosis, fibrosis, endoplasmic reticulum (ER) stress, and hepatic dysfunction and concomitantly ameliorates the morphological structures of the liver. Therefore, mangiferin could be considered a multitarget therapeutic and promising drug candidate for the treatment of hepatic diseases, although a detailed mechanistic explanation needs to be provided. This literature review highlights the pathological conditions (inflammation, oxidative stress, apoptosis, ER stress) associated with liver diseases as well as the hepatoprotective and therapeutic effects of mangiferin in the liver.<strong> </strong></p>",
"journal_reference": "J Adv Biotechnol Exp Ther. 2025; 8(1): 125-138",
"academic_editor": "Md. Abdul Hannan, PhD; Bangladesh Agricultural University, Bangladesh",
"cite_info": "Shoyshob TZ, Akter S, et al. Pharmacological insights and therapeutic advances of mangiferin against various pathological conditions in liver diseases. J Adv Biotechnol Exp Ther. 2025; 8(1): 125-138.",
"keywords": [
"Oxidative Stress",
"Apoptosis",
"Mangiferin",
"Endoplasmic reticulum stress",
"Liver disease"
],
"DOI": "10.5455/jabet.2025.11",
"sections": [
{
"section_number": 1,
"section_title": "INTRODUCTION",
"body": "<p>Liver disease is one of the most alarming concerns, and approximately 2 million people die of liver diseases and complications. Chronic liver diseases, including liver cirrhosis and liver cancers, are the 11<sup>th</sup> and 16<sup>th</sup> leading factors responsible for death worldwide and are characterized by various pathological conditions such as oxidative stress, ER stress, inflammation, apoptosis, and other pathologic conditions [<a href=\"#r-1\">1</a>]. These conditions can be identified by examining any discrepancies with their respective markers. Nonalcoholic fatty liver disease (NAFLD) and alcoholic liver disease (ALD) are the most well-known liver diseases. Among them, fatty liver diseases are commonly caused by lipid accumulation in the liver, which aggravates inflammation and results in severe long-term effects on the liver [<a href=\"#r-2\">2, 3</a>].</p>\r\n\r\n<p>In addition, hepatocellular carcinoma is closely associated with multiple complications, including consequent inflammatory cascades along with insulin resistance, obesity, and iron deposition [<a href=\"#r-4\">4, 5</a>].</p>\r\n\r\n<p>Diabetes and obesity increase the levels of several proinflammatory cytokines, including interleukin-6 (IL-6) and tumor necrosis factor-alpha (TNF-α) [<a href=\"#r-6\">6</a>]. In addition, these diseases are also associated with a reduction in adiponectin, which favors severe liver inflammation and, ultimately, hepatic steatosis [<a href=\"#r-7\">7, 8</a>]. This condition is exacerbated by the upregulation of insulin-like growth factor-1 (IGF1), which promotes cellular proliferation within the liver, thereby leading to liver cancer. While annual global deaths due to liver disease are at their peak, the number of U.S. Food and Drug Administration (FDA)-approved drugs for the treatment of these diseases is low. Considering this situation, the exploration of all possible natural products and the determination of their therapeutic efficacy could be a treatment option without any side effects.</p>\r\n\r\n<p>Eastern societies have long used natural products as liver disease remedies, which has attracted the attention of Western medical practitioners [<a href=\"#r-9\">9</a>]. In addition, desirable outcomes are lacking with the available drugs, such as antihyperlipidemic or anti-inflammatory drugs, for treating liver diseases [<a href=\"#r-10\">10</a>]. Therefore, more attention is being given to the efficacy of natural products as alternatives to restore liver function.</p>\r\n\r\n<p>Mangiferin is used extensively against several lifestyle-associated disorders. It can be extracted from several parts of mango (<em>Mangifera indica</em>) fruits, including peels, kernels, and seeds, and it can possess diverse health-endorsing properties, including anti-inflammatory, antimicrobial, antidiabetic, antiallergic, antioxidant, anticancer, immunoregulatory and hypercholesterolemic properties. Mangiferin, a naturally occurring xanthone derivative with the chemical structure of 1,3,6,7-tetrahydroxyxanthone-C2-beta-D-glucoside (<a href=\"#figure1\">Figure 1</a>), has been extensively studied for its wide range of pharmacological actions involving antioxidant properties. The antioxidant capability of mangiferin is associated primarily with its unique chemical structure, which facilitates the formation of stable complexes with metal ions, specifically ferric iron [Fe(III)] [<a href=\"#r-11\">11</a>].</p>\r\n\r\n<p>Researchers have demonstrated that mangiferin has a dual mechanism to protect against iron-induced oxidative damage. It successfully chelates Fe(III), preventing its reduction to Fe(II), a process that is important in the Fenton reaction and is likely to produce highly reactive hydroxyl radicals (•OH). With the maintenance of iron in its ferric state, mangiferin mitigates the availability of Fe(II) for redox cycling and the subsequent formation of reactive oxygen species (ROS). This chelation mechanism was confirmed through experiments showing that mangiferin significantly inhibits 2-deoxyribose degradation induced by Fe(III)–EDTA/citrate plus ascorbate, indicating that it forms a stable iron‒mangiferin complex that reduces oxidative damage [<a href=\"#r-12\">12</a>].</p>\r\n\r\n<p>Nuclear factor erythroid 2-related factor 2 (Nrf2) is a transcription factor that controls antioxidant protein expression. Nrf2 is separated from its inhibitor, Kelch-like ECH-associated protein 1 (Keap1), under oxidative stress or in the presence of electrophiles and then translocates into the nucleus. Eventually, once in the nucleus, Nrf2 attaches to the antioxidant response element (ARE) in target gene promoter regions. In addition, phase II detoxifying enzymes such as NAD(P)H, oxidoreductase 1 (NQO1), and glutathione S-transferases (GSTs) are expressed.</p>\r\n\r\n<p>In one study, mangiferin treatment increased the nuclear translocation of Nrf2 and increased the expression of NQO1 to provide protective effects against oxidative stress and DNA damage. Mangiferin also has antioxidant effects by directly binding to ferric iron, which neutralizes free radicals without depending on the Nrf2 pathway. Furthermore, it may increase the activity of other antioxidant enzymes, such as superoxide dismutase (SOD) and catalase (CAT), through mechanisms involving dissociation from Nrf2. Mangiferin also has anti-inflammatory properties, mitigating oxidative stress and DNA damage by suppressing proinflammatory cytokines and other inflammation-associated pathways independent of Nrf2 [<a href=\"#r-13\">13</a>]. Recently, the renoprotective effects of mangiferin have been reviewed [<a href=\"#r-14\">14</a>]. In addition, by blocking lipid peroxidation, it acts as a protective agent against a range of life-threatening cancers, including breast, colon, lung, and brain cancers. The enormous free-radical scavenging ability of mangiferin originates from the connection [<a href=\"#r-15\">15</a>] of the polyhydroxy groups and the C-glucosyl linkages in mangiferin. The protective mechanism of the polyphenol mangiferin is associated with the suppression of nuclear factor kappa B (NF-κB) and the simultaneous activation of several transcription factors, such as Nrf-2 [<a href=\"#r-16\">16-18</a>].</p>\r\n\r\n<p>Oral administration of this polyphenol tends to convert mangiferin into active metabolites such as norathyriol, 1,7-dihydroxyxanthone, 1,3,6-trihydroxy-7-methoxyxanthone, 1,3,7-trihydroxyxanthone, and 1,3,6,7-tetrahydroxyxanthone [<a href=\"#r-19\">19</a>]. Norathyriol ameliorates lipid metabolism by activating AMP-activated protein kinase (AMPK), sirtuin-1 (SIRT-1), and liver kinase B1, which together lead to protection against hepatic lipid metabolic disorders [<a href=\"#r-20\">20</a>]. Clinical trials in different animal models and humans have shown significant improvements in carbohydrate metabolism, lipid metabolism, and protection against liver injury and fibrosis [<a href=\"#r-21\">21</a>].</p>\r\n\r\n<p>Therefore, the current review summarized the therapeutic or pharmacological potential of mangiferin against the pathologic conditions associated with liver diseases and explored its potential as a promising/novel drug candidate on the basis of its desirable properties. Furthermore, the study design incorporated the protective mechanisms of mangiferin against liver diseases with respect to clinical trials, doses, and molecular consequences.</p>\r\n\r\n<div id=\"figure1\">\r\n<figure class=\"image\"><img alt=\"\" height=\"347\" src=\"/media/article_images/2025/58/21/178-1734634003-Figure1.jpg\" width=\"500\" />\r\n<figcaption><strong>Figure </strong><strong>1</strong><strong>.</strong> Chemical structure of mangiferin (C19H18O11) [<a href=\"#r-19\">19</a>].</figcaption>\r\n</figure>\r\n</div>"
},
{
"section_number": 2,
"section_title": "METHODS",
"body": "<p>The literature was collected from published online research databases (1999--2023), such as PubMed and Google Scholar, using the keywords ‘mangiferin on liver diseases’ and ‘mangiferin on oxidative stress’, ‘mangiferin on inflammation’ and ‘mangiferin on apoptosis’. All figures were generated via Adobe Illustrator.</p>"
},
{
"section_number": 3,
"section_title": "MANGIFERIN AGAINST PATHOLOGICAL CONDITIONS OF LIVER DISEASES",
"body": "<p>The pharmacological potential of mangiferin against several possible pathological conditions, including oxidative stress, inflammation, fibrosis, ER stress, and other pathologies related to liver disorders, is summarized and presented in <a href=\"#Table-1\">Tables</a> 1-3 and <a href=\"#figure2\">Figure 2</a>.</p>\r\n\r\n<div id=\"figure2\">\r\n<figure class=\"image\"><img alt=\"\" height=\"435\" src=\"/media/article_images/2025/58/21/178-1734634003-Figure2.jpg\" width=\"500\" />\r\n<figcaption><strong>Figure 2.</strong> Summary of the protective mechanisms of mangiferin against liver disease. Stress stimuli such as HFD, D-GalN, STZ, LPS, As, and ischemia trigger the generation of ROS, which reduce the levels of several antioxidant enzymes (SOD, CAT, GST, GPx) and hence cause oxidative stress, ultimately resulting in liver diseases. Mangiferin intercepts oxidative stress by increasing the level of antioxidant enzymes. In addition, these stimuli also trigger inflammatory cascades via the activation of the NF-қB pathway. Nevertheless, mangiferin blocks inflammatory cascades via the suppression of ROS and the NF-қB pathway. The production of cytochrome C decreases the expression of Bcl-2, thus decreasing apoptosis. Mangiferin also inhibits ER stress by suppressing CHOP and GRP78. Furthermore, after the activation of TNF-α, it helps to activate caspase compounds, resulting in apoptosis, and mangiferin inhibits this apoptosis in the liver.</figcaption>\r\n</figure>\r\n\r\n<p> </p>\r\n</div>\r\n\r\n<p style=\"text-align:center\"><strong>Table 1.</strong> Pharmacological effects of pretreated mangiferin in vivo.</p>\r\n\r\n<div id=\"Table-1\">\r\n<p style=\"text-align:center\"><a href=\"https://jabet.bsmiab.org/table/178-1734634003-table1/\">Table-1</a></p>\r\n</div>\r\n\r\n<p style=\"text-align:center\"> </p>\r\n\r\n<p style=\"text-align:center\"><strong>Table 2.</strong> Pharmacological effects of posttreatment with mangiferin in vivo.</p>\r\n\r\n<div id=\"Table-2\">\r\n<p style=\"text-align:center\"><a href=\"https://jabet.bsmiab.org/table/178-1734634003-table2/\">Table-2</a></p>\r\n</div>\r\n\r\n<p style=\"text-align:center\"> </p>\r\n\r\n<p style=\"text-align:center\"><strong>Table 3.</strong> Pharmacological effects of mangiferin in vitro.</p>\r\n\r\n<div id=\"Table-3\">\r\n<p style=\"text-align:center\"><a href=\"https://jabet.bsmiab.org/table/178-1734634003-table3/\">Table-3</a></p>\r\n</div>\r\n\r\n<p><strong>Liver inflammation</strong></p>\r\n\r\n<p>Hepatic inflammation is a complex process that occurs in response to different stress conditions and is associated with most acute and chronic liver disorders. Depending on different types of factors, inflammation can be beneficial or harmful to the liver. A mild inflammatory response induces hepatoprotective effects, tissue repair, and homeostasis mechanisms, whereas excessive inflammation triggers the loss of hepatocytes and liver disorders [<a href=\"#r-53\">53</a>, <a href=\"#r-54\">54</a>]. This phenomenon damages hepatocytes and instigates inflammatory responses, thus causing inflammation and cell death [<a href=\"#r-55\">55</a>]. D-galactosamine (D-GalN) is recognized as a hepatotoxin generally used to induce liver inflammation via NF-κB-dependent iNOS overexpression and other proinflammatory cytokines, such as TNF-α, interleukin-1-beta (IL-1β) and IL-6 [<a href=\"#r-32\">32</a>, <a href=\"#r-44\">44</a>]. High-fat diets (HFDs) and lipopolysaccharides (LPSs) also stimulate the production of different inflammatory mediators [<a href=\"#r-41\">41, 44</a>]. Studies have shown that the majority of proinflammatory cytokine- and inflammatory enzyme-encoding genes are regulated predominantly by NF-κB, which is the key inflammatory protein [<a href=\"#r-24\">24</a>, <a href=\"#r-32\">32</a>]. NLR family pyrin domain containing 3 (NLRP3) is a Nod-like receptor that forms an inflammasome along with its adaptor proteins, and its activation is caused by ROS [<a href=\"#r-49\">49</a>]. The NLRP3 inflammasome is also associated with the pathogenesis of liver damage. After the activation of NLRP3, it engages the adaptor apoptosis-associated speck-like protein containing a CARD ASC, which further recruits procaspase-1, which ultimately contributes to the maturation of the inflammatory mediator IL-1β [<a href=\"#r-44\">44</a>]. NLRP3 activation activates caspase-1; thus, the proinflammatory cytokines pro-IL-1β and pro-IL-18 are activated and trigger the release of mature inflammatory mediators, leading to an inflammatory cascade [<a href=\"#r-49\">49</a>]. In addition, saturated fatty acid and adipose tissue disturbances lead to an inflammatory response along with the generation of inflammatory chemokines and cytokines in the liver. The inflammatory pathways, which include the NF-κB and c-Jun N-terminal protein kinase (JNK) pathways, are associated with hepatic inflammation and the pathogenesis of inflammatory liver injury [<a href=\"#r-42\">42</a>]. Lead is a hazardous metal that causes hepatic damage. Moreover, nitrate [Pb(NO<sub>3</sub>)<sub>2</sub>] and N-acetyl-q-benzoquinone imine (NAQPI), the reactive intermediate compounds from lead [Pb(ІІ)] and acetaminophen, respectively, instigate the generation of ROS and JNK activation; thus, ROS trigger inflammation [<a href=\"#r-24\">24</a>, <a href=\"#r-31\">31</a>, <a href=\"#r-47\">47</a>].</p>\r\n\r\n<p>However, mangiferin plays an important role in protecting the liver from various inflammatory modulators. One study revealed that 5-25 mg/kg mangiferin treatment for 14 d minimized the expression of proinflammatory cytokines (TNF-α, IFN-γ, IL-1β, IL-6, IL-12, IL-18, and IL-10) in male Swiss albino rats. This hepatoprotective role of mangiferin occurred because of the reduction in inflammation caused by the inhibition of NF-kB [<a href=\"#r-32\">32</a>]. Doses of 5, 10, 20, and 25 mg/kg mangiferin reduce the expression of inflammatory cytokines in D-GalN-induced rats [<a href=\"#r-32\">32</a>]. In male Zucker diabetic fatty (ZDF) rats, treatment with 100 mg/kg mangiferin for 6 weeks reduced liver inflammation through the suppression of NF-κB [<a href=\"#r-38\">38</a>]. Furthermore, the administration of 250 mg/kg leaf extract and 40 mg/kg mangiferin to male weanling Wistar rats fed streptozotocin (STZ) for 8 d suppressed NF-kB protein expression and protected the liver against inflammation, as it has anti-inflammatory activity [<a href=\"#r-41\">41</a>]. Another study showed that in male Kunming HFD-fed mice, 15, 30, and 60 mg/kg mangiferin for 12 weeks alleviated the liver by inhibiting the inflammatory responses of the cytokines NF-κB and JNK [<a href=\"#r-42\">42</a>]. The administration of 100 mg/kg mangiferin for 6 d in Pb(NO<sub>3</sub>)<sub>2</sub>-treated male albino mice minimized the level of NF-қB [<a href=\"#r-47\">47</a>]. Because of its anti-inflammatory mechanism, mangiferin alleviated LPS/D-GalN-induced NLRP3 inflammasome expression. In D-GalN-induced male BALB/c mice, the administration of 5, 10, or 20 mg/kg mangiferin for 1 h reduced the expression of IL-1β, NLRP3, TNF-α, and MCP-1 [<a href=\"#r-44\">44</a>]. In addition, after treatment with 12.5−50 mg/kg mangiferin for 12 h in acetaminophen-induced male C57BL/6 mice, the mRNA levels of TNF-α, MCP-1, IL-1β, IL-6, NF-κB, CXC chemokine ligand-1 and CXC chemokine ligand-2 (CXCL-1 and CXCL-2) were decreased [<a href=\"#r-24\">24</a>]. Moreover, treatment with 25, 50, or 100 mg/kg mangiferin in HFD-fed male C57BL/6J mice for 12 weeks alleviated the expression of NLRP3, NF-қB, and IL-1β, thus mitigating liver inflammation. In addition, treatment with 12.5, 25, or 50 μM mangiferin for 1 h reduced inflammation by reducing the levels of TNF-α and IL-1β in primary hepatocytes [<a href=\"#r-44\">44</a>]. Treatment with mangiferin at 100 mg/kg/d and 100 µM reduced the activity of the NLRP3 inflammasome in NAFLD model mice and HepG2 cells, respectively [<a href=\"#r-49\">49</a>].</p>\r\n\r\n<p><strong> </strong></p>\r\n\r\n<p><strong>Liver oxidative stress</strong></p>\r\n\r\n<p>Oxidative stress is a key factor in a wide range of liver disorders [<a href=\"#r-39\">39</a>, <a href=\"#r-56\">56</a>]. Cellular and molecular investigations revealed that the increase in oxidative stress is due to the overproduction of ROS and the depletion of antioxidants [<a href=\"#r-22\">22</a>, <a href=\"#r-32\">32</a>, <a href=\"#r-39\">39</a>]. Furthermore, the functions of modified antioxidant enzymes, such as SOD, CAT, glutathione peroxidase (GPx), and glutathione (GSH) metabolism, cause an imbalance in the action of oxidant or antioxidant defense systems, thus contributing to the overproduction of ROS [<a href=\"#r-31\">31</a>]. Chronic hyperglycemia and the cytotoxic action of STZ trigger ROS production, which results in oxidative tissue damage. In living organisms, antioxidant enzymes and nonenzymatic antioxidants act as the first line of defense against ROS-induced oxidative stress [<a href=\"#r-31\">31</a>]. Nrf2 affects genes encoding antioxidant proteins. Nrf2 responds to oxidative stress from the cytosol and translocates toward the nucleus, where the cytoprotective response is produced after the sequential binding of Nrf2 to the ARE. Thus, this increases the level of antioxidant enzymes and reduces the degree of oxidative stress damage [<a href=\"#r-32\">32</a>, <a href=\"#r-57\">57</a>].</p>\r\n\r\n<p>In the cafeteria, diet-fed male weanling Wistar rats treated with 250 mg/kg leaf extract and 40 mg/kg mangiferin for 8 d presented increased SOD and decreased malondialdehyde (MDA) contents [<a href=\"#r-41\">41</a>]. In STZ-induced male albino Wistar rats, 40 mg/kg mangiferin for 30 d increased the expression levels of antioxidants (GSH, CAT, SOD, GPx) [<a href=\"#r-31\">31</a>]. The administration of 50 mg/kg mangiferin in ethanol-treated Albino Wistar rats for 8 weeks upregulated the levels of SOD and CAT antioxidants [<a href=\"#r-33\">33</a>]. In Sprague-Dawley (SD) rats treated with SM, 30, 60, or 120 mg/kg mangiferin for 7 d, the expression of the antioxidant GSH increased [<a href=\"#r-35\">35</a>]. The use of 300 mg/kg mangiferin for 13 weeks mitigated oxidative stress by increasing GSH levels in HFD-fed male SD rats [<a href=\"#r-36\">36</a>]. After treatment with 1-200 mg/kg mangiferin for 1 h or for 7 d in LPS-triggered male BALB/c mice, oxidative stress was reduced through the suppression of excess ROS [23]. In alcohol-treated male SD rats, 50–100 mg/kg mangiferin upregulated the levels of antioxidants (SOD, GSH-PX, and CAT) and decreased oxidative stress by mitigating the levels of ROS and MDA [<a href=\"#r-17\">17</a>, <a href=\"#r-20\">20</a>]. In male albino rats induced with STZ, the administration of mangiferin (50 and 100 mg/kg) orally for 15 d increased the contents of GSH, SOD, and CAT [<a href=\"#r-43\">43</a>]. Treatment with 100 mg/kg mangiferin in Pb(NO3)2-induced male albino mice for 6 d inhibited oxidative stress via a reduction in the contents of MDA and ROS and increased the levels of the antioxidants CAT, SOD, GST, GPX, and glutathione reductase (GRD) [<a href=\"#r-47\">47</a>]. Doses of 20 mg/kg mangiferin for 3 d in IR-induced male Wistar rats for 3 d increased the GST content and decreased the content of MDA, thus mitigating oxidative stress [<a href=\"#r-25\">25</a>]. In iron-dextran-treated female Wistar rats treated with 40 mg/kg mangiferin for 7 d, the liver antioxidant enzymes GPx, GSH, and SOD were upregulated [<a href=\"#r-26\">26</a>]. The levels of liver antioxidants (CAT, SOD, GPx, GST, and GSH) were alleviated, and the MDA level was reduced by treatment with 40 mg/kg mangiferin for 28 d in STZ-treated male SD rats [<a href=\"#r-45\">45</a>]. In a previous study, oxidative stress was decreased in STZ-treated Wistar albino rats treated with 20 mg/kg mangiferin for 20 d through downregulation of MDA and upregulation of antioxidants (SOD, GSH, and CAT) [<a href=\"#r-46\">46</a>]. With the administration of 30 and 60 mg/kg mangiferin for 7 d in CCl4-treated male albino rats, liver antioxidants such as GSH, GPx, GST, GRD, thiobarbituric acid reactive substances (TBARS), SOD, and CAT are increased [<a href=\"#r-27\">27</a>]. In CCl4-treated male and female albino rats, treatment with 60 mg/kg mangiferin for 7 d upregulated the levels of the antioxidants GSH, SOD, and CAT in the liver [<a href=\"#r-28\">28</a>]. In TA3-induced male SD rats, 10-200 μg/ml mangiferin for 2 hours minimizes oxidative stress through the suppression of the overproduction of ROS in the liver in the sandwich configuration of cultured rat hepatocytes (SCRHs) [<a href=\"#r-51\">51</a>]. In addition, treatment with 100 nM mangiferin for 12 h reduces oxidative damage by alleviating the expression level of the transcription factor Nrf2 in hepatocytes [<a href=\"#r-32\">32</a>]. The administration of mangiferin (10 μM) for 20 minutes in Fe2+- citrate-treated rats facilitated the expression of SOD and CAT and alleviated the levels of MDA and ROS, hence reducing oxidative damage in rat liver mitochondria [<a href=\"#r-11\">11</a>]. In the liver, oxidative stress was mitigated by increasing the SOD content via treatment with 50, 100, or 200 mg/kg mangiferin for 4 weeks in iron dextran-treated male SD rats [<a href=\"#r-48\">48</a>].</p>\r\n\r\n<p><strong> </strong></p>\r\n\r\n<p><strong>Endoplasmic reticulum stress in the liver</strong></p>\r\n\r\n<p>ER stress is characterized by the accumulation of misfolded proteins within the lumen of the ER [<a href=\"#r-58\">58</a>]. It is commonly instigated during the development of solid tumors and stage progression [<a href=\"#r-59\">59</a>]. Various factors, such as nutrient deficiencies, hypoxia, and breakdown of calcium, can affect the homeostasis of this compartment, thereby causing ER stress and triggering unfolded protein response (UPR) activation. The UPR is a complex signaling network that is mediated by three ER transmembrane stress sensors: inositol-requiring enzyme 1α (IRE1α), pancreatic endoplasmic reticulum kinase (PERK), and transcription factor 6 activation (ATF6) in mammalian cells [<a href=\"#r-59\">59-63</a>].</p>\r\n\r\n<p>ER stress has been demonstrated to occur during acute liver injury induced by LPS and D-GalN. Extensive ER stress instigates liver damage through cell apoptosis, steatosis, or an inflammatory response [<a href=\"#r-29\">29</a>, <a href=\"#r-52\">52</a>]. ER homeostasis is associated with lipid metabolism [<a href=\"#r-64\">64</a>, <a href=\"#r-65\">65</a>]. ER stress and the UPR are involved in the pathogenesis of human diseases such as liver disease [<a href=\"#r-64\">64</a>]. NAFLD is currently the leading cause of liver abnormalities in the United States and Western countries. ALD and NAFLD are diseases linked with triglyceride accumulation in hepatocytes and involve hepatic steatosis to progressive nonalcoholic steatohepatitis (NASH), leading to progressive liver damage, fibrosis, cirrhosis, and hepatocellular carcinoma (HCC) [<a href=\"#r-64\">64</a>, <a href=\"#r-66\">66</a>, <a href=\"#r-67\">67</a>]. Alcohol-related ROS accumulation increases hepatic CYP2E1 (CYP2E1) expression, decreases the S-adenosylmethionine/S-adenosylhomocysteine ratio, elevates homocysteine levels in the blood, and epigenetic regulation is the only factor that might cause ER stress. Eventually, ER stress and UPR pathway activation are observed in the livers of chronic ALD patients as well as in a variety of experimental ALD models [<a href=\"#r-64\">64</a>, <a href=\"#r-65\">65</a>, <a href=\"#r-68\">68</a>]. Peroxisomes are small organelles located in the cytoplasm of cells. Peroxisome deficiency triggers lipid metabolism disruption, such as fatty acid oxidation, in human patients and animal models of peroxisomal biogenesis disorders [<a href=\"#r-69\">69</a>, <a href=\"#r-70\">70</a>]. In both the presence and absence of an HFD, ER stress regulates peroxisomal redox imbalance-induced hepatic steatosis and NAFLD in catalase mutant mice [<a href=\"#r-69\">69</a>].</p>\r\n\r\n<p>MicroRNAs (miRNAs), such as miR-144-3p, directly target Nrf2 to modify cisplatin resistance in lung cancer, and miR-340-5p may act as a direct mediator of Nrf2 in the postexercise skeletal muscle of mice, indicating that miRNAs may regulate Nrf2 expression [<a href=\"#r-29\">29</a>, <a href=\"#r-71\">71</a>]. Several studies have shown that mangiferin reduces LPS/DGalN-induced acute liver injury via activation of the miR-20a/miR-101a-Nrf2 axis pathway [<a href=\"#r-44\">44</a>].</p>\r\n\r\n<p>Recently, mangiferin was shown to protect against ER stress by regulating the miR-20a/miR-101a-Nrf2 axis and restoring hepatic function in mice [<a href=\"#r-29\">29</a>]. Furthermore, mangiferin attenuated the ER stress-related NLRP3 inflammasome by controlling AMPK activity in perivascular adipose tissue in rats [<a href=\"#r-72\">72</a>].</p>\r\n\r\n<p> </p>\r\n\r\n<p><strong>Other pathologies in the liver</strong></p>\r\n\r\n<p>The peroxisome proliferator-activated receptor PPAR-α is known as a nuclear receptor that conserves the homeostasis of lipid metabolism, and mangiferin has an important role in activating PPAR-α [<a href=\"#r-38\">38</a>]. NAFLD decreases the autophagy pathway that controls autophagy as well as lipid metabolism by mitigating the AMPK/mechanistic target of the rapamycin (mTOR) signaling pathway [<a href=\"#r-42\">42</a>]. AMPK acts as a major mediator of energy metabolic homeostasis and assists in the protection of mitochondria. The phosphorylation of AMPK inhibits NF-κB signaling and, hence, inflammation via the activation of sirtuin-1, the forkhead box O family, and peroxisome proliferator-activated receptor γ coactivator 1α. Mangiferin improved AMPK activation [<a href=\"#r-24\">24</a>]. Akt is a pluripotent molecule and another kinase, ERK1/2 that plays a key role in preventing hepatotoxicity and is dwindled in the arsenic-administered liver, and mangiferin ameliorated the expression levels of Akt and ERK1/2 due to its anti-apoptotic activity [<a href=\"#r-39\">39</a>].</p>\r\n\r\n<p>Administration of 1, 5, 10, or 20 mg/kg mangiferin for 1 hour reduced apoptosis in LPS- and D-GalN-treated male BALB/c mice [<a href=\"#r-44\">44</a>]. Supplementation with 100 mg/kg mangiferin for 6 d prevented Pb(II)-induced apoptotic death and protected hepatocytes in male albino mice via the inhibition of BCL2 Associated X (Bax) and the upregulation of the anti-apoptotic marker Bcl-2 [<a href=\"#r-47\">47</a>]. Mangiferin at 100 mg/kg and 150 mg/kg prevented lipid accumulation through the suppression of plasma triglyceride (TG) and total cholesterol (TC) levels in male ZDF rats and golden Syrian hamsters, respectively [<a href=\"#r-37\">37</a>]. In response to mangiferin supplementation, the expression of TNF-α was mitigated concomitantly with decreased expression of downstream extramitochondrial apoptotic cascades, such as TNF-α, cytochrome c, Bax, caspase 3, caspase 9, caspase 12, TRADD, and caspase 8, in NaAsO<sub>2</sub>-treated male Wistar rats treated with 40 mg/kg mangiferin for 6 weeks because of the anti-apoptotic activities of mangiferin [<a href=\"#r-39\">39</a>]. Pretreatment with 20 mg/kg mangiferin enhanced Bcl-2 and downregulated caspase 3 due to its anti-apoptotic effect on IR-induced male Wistar rats [<a href=\"#r-25\">25</a>]. In addition, 100 nM mangiferin treatment for 12 hours in D-GalN-treated hepatocytes protected the liver by inhibiting the expression of caspase 3 and reducing apoptosis [<a href=\"#r-32\">32</a>].</p>\r\n\r\n<p><strong> </strong></p>\r\n\r\n<p><strong>PHARMACOLOGICAL ADVANCES IN MANGIFERIN IN LIVER DISEASES</strong></p>\r\n\r\n<p>Mangiferin reportedly ameliorates alcohol-induced liver injuries. Although the exact molecular mechanism is unclear, mangiferin restores PDE3B stability, consequently reducing fatty acid release by activating AMPK/TBK1 signaling and diminishing noncanonical NF-κB activation, which leads to a reduction in ethanol-induced liver injury. PDE3B is a family member of the PDE family that is found mostly in energy metabolism tissues, such as adipose 9, and may play a role in inhibiting catecholamine-induced lipolysis [<a href=\"#r-29\">29</a>]. Mangiferin has been empirically determined to have several other pharmacological effects, including antitumor, cardioprotective, antidiabetic, neurogenerative, antipyretic, anti-inflammatory, and cytotoxic effects [<a href=\"#r-17\">17</a>]. Although mangiferin is a natural constituent with limited adverse effects, it has not been used clinically for several reasons, such as disparaging solubility, poor oral absorption, and low bioavailability [<a href=\"#r-73\">73</a>]. The development and modification of mangiferin-based derivatives have become current research hotspots for improving mangiferin solubility and establishing mangiferin as a clinical drug. Various mangiferin adjuvants, including incorporated nanoparticles and mangiferin, have been developed, and their efficacy has been determined in many animal studies. Soft nanoparticles of mangiferin complexed with self-assembled phospholipids were designed. These nanoparticles improved the oral solubility, bioavailability, and overall efficacy of mangiferin [<a href=\"#r-28\">28</a>]. Mangiferin calcium salt (MCS) was developed, and its oral absorption effects were analyzed in type 2 diabetes and NAFLD rats. MCS was found to improve the condition of type 2 diabetes and NAFLD rats more effectively than mangiferin by regulating glucose and lipid metabolism [<a href=\"#r-74\">74</a>]. In addition to its pharmacological effects on liver, kidney, and heart disease, it can be used to counteract skin infections. In a vesicular system, plurethosomes for mangiferin based on the block copolymer pluronic and phosphatidylcholine were designed for application in skin orders induced by environmental pollutants such as ozone [75]. Mangiferin-alginate-grafted N-succinylated chitosan (NSC) nanoconjugate was also developed to test its effectiveness in reducing TC, blood glucose, TG, and hyperlipidemia [<a href=\"#r-76\">76</a>]. The pharmacological effects of mangiferin with adjuvants are summarized and represented in <a href=\"#Table-4\">Table 4</a>.</p>\r\n\r\n<p style=\"text-align:center\"><strong>Table 4.</strong> The pharmacological effect of mangiferin with adjuvants.</p>\r\n\r\n<div id=\"Table-4\">\r\n<p style=\"text-align:center\"><a href=\"https://jabet.bsmiab.org/table/178-1734634003-table4/\">Table-4</a></p>\r\n</div>"
},
{
"section_number": 4,
"section_title": "CONCLUSIONS AND FUTURE PROSPECTS",
"body": "<p>The accumulation of different kinds of toxic compounds is associated with reduced liver function, hence triggering liver diseases. Thus, proper treatment might ameliorate the liver condition and function of the liver. Although many medications are used for the treatment of liver diseases, their use is restricted and limited due to their side effects. Therefore, the role of a natural polyphenol compound with fewer side effects has been investigated. This review suggests that mangiferin protects the liver and enhances liver function through the suppression of various host cellular factors, such as proinflammatory cytokines, oxidative markers, ER stress, and apoptotic and fibrotic factors, and reduces various comorbidities that are likely to cause liver diseases, including diabetes, ALD, NAFLD, and liver cirrhosis. The therapeutic effects of this study will be further researched in the future to determine the importance of pharmacological medications involving the use of natural compounds to treat liver diseases.</p>\r\n\r\n<p>Mangiferin also has an indirect negative effect on the development of endothelial dysfunction. Mangiferin induces the secretion of exosomes by perivascular adipose tissue (PVAT), which reverses the effects of inflammation-induced endothelial dysfunction following palmitic acid (PA) treatment. Mangiferin-induced exosome production also decreases NF-ƙB signaling in endothelial cells and reduces endothelial dysfunction [<a href=\"#r-77\">77</a>]. Mangiferin has an overall high potential as a clinical drug for various diseases, although its oral solubility limits its application. Although there should be a number of ongoing investigations, more investigations are needed for mangiferin to establish an approved clinical drug.</p>"
},
{
"section_number": 5,
"section_title": "AUTHOR CONTRIBUTIONS",
"body": "<p>This work involved collaboration among all the authors. MJU and AM designed the outline of the manuscript. TZS, SA, MF, and MRU wrote the initial draft of the manuscript. MJU, AM, MGH, and WS reviewed the scientific contents described in the manuscript. All the authors have read and approved the final submitted version of the manuscript.</p>"
},
{
"section_number": 6,
"section_title": "ACKNOWLEDGMENTS",
"body": "<p>None.</p>"
},
{
"section_number": 7,
"section_title": "CONFLICTS OF INTEREST",
"body": "<p>There is no conflict of interest among the authors.</p>"
}
],
"figures": [
{
"figure": "https://jabet.bsmiab.org/media/article_images/2025/58/21/178-1734634003-Figure1.jpg",
"caption": "Figure 1. Chemical structure of mangiferin (C19H18O11) [19].",
"featured": false
},
{
"figure": "https://jabet.bsmiab.org/media/article_images/2025/58/21/178-1734634003-Figure2.jpg",
"caption": "Figure 2. Summary of the protective mechanisms of mangiferin against liver disease. Stress stimuli such as HFD, D-GalN, STZ, LPS, As, and ischemia trigger the generation of ROS, which reduce the levels of several antioxidant enzymes (SOD, CAT, GST, GPx) and hence cause oxidative stress, ultimately resulting in liver diseases. Mangiferin intercepts oxidative stress by increasing the level of antioxidant enzymes. In addition, these stimuli also trigger inflammatory cascades via the activation of the NF-қB pathway. Nevertheless, mangiferin blocks inflammatory cascades via the suppression of ROS and the NF-қB pathway. The production of cytochrome C decreases the expression of Bcl-2, thus decreasing apoptosis. Mangiferin also inhibits ER stress by suppressing CHOP and GRP78. Furthermore, after the activation of TNF-α, it helps to activate caspase compounds, resulting in apoptosis, and mangiferin inhibits this apoptosis in the liver.",
"featured": true
}
],
"authors": [
{
"id": 1578,
"affiliation": [
{
"affiliation": "ABEx Bio-Research Center, East Azampur, Dhaka-1230, Bangladesh"
}
],
"first_name": "Tanvir Zaman",
"family_name": "Shoyshob",
"email": null,
"author_order": 1,
"ORCID": "https://orcid.org/0000-0002-8853-9769",
"corresponding": false,
"co_first_author": true,
"co_author": false,
"corresponding_author_info": "",
"article": 319
},
{
"id": 1579,
"affiliation": [
{
"affiliation": "ABEx Bio-Research Center, East Azampur, Dhaka-1230, Bangladesh"
}
],
"first_name": "Sumaya",
"family_name": "Akter",
"email": null,
"author_order": 2,
"ORCID": null,
"corresponding": false,
"co_first_author": true,
"co_author": false,
"corresponding_author_info": "",
"article": 319
},
{
"id": 1580,
"affiliation": [
{
"affiliation": "ABEx Bio-Research Center, East Azampur, Dhaka-1230, Bangladesh"
}
],
"first_name": "Muhammad Ramiz",
"family_name": "Uddin",
"email": null,
"author_order": 3,
"ORCID": null,
"corresponding": false,
"co_first_author": false,
"co_author": false,
"corresponding_author_info": "",
"article": 319
},
{
"id": 1581,
"affiliation": [
{
"affiliation": "ABEx Bio-Research Center, East Azampur, Dhaka-1230, Bangladesh"
}
],
"first_name": "Mithila",
"family_name": "Farjana",
"email": null,
"author_order": 4,
"ORCID": null,
"corresponding": false,
"co_first_author": false,
"co_author": false,
"corresponding_author_info": "",
"article": 319
},
{
"id": 1582,
"affiliation": [
{
"affiliation": "ABEx Bio-Research Center, East Azampur, Dhaka-1230, Bangladesh"
}
],
"first_name": "Akhi",
"family_name": "Moni",
"email": null,
"author_order": 5,
"ORCID": "https://orcid.org/0000-0002-5812-7755",
"corresponding": false,
"co_first_author": false,
"co_author": false,
"corresponding_author_info": "",
"article": 319
},
{
"id": 1583,
"affiliation": [
{
"affiliation": "Graduate School of Pharmaceutical Sciences, College of Pharmacy, Ewha Womans University, Seoul 03760, Republic of Korea"
}
],
"first_name": "Wonhyo",
"family_name": "Seo",
"email": null,
"author_order": 6,
"ORCID": null,
"corresponding": false,
"co_first_author": false,
"co_author": false,
"corresponding_author_info": "",
"article": 319
},
{
"id": 1584,
"affiliation": [
{
"affiliation": "Department of Microbiology and Hygiene, Bangladesh Agricultural University, Mymensingh 2202, Bangladesh"
}
],
"first_name": "Md. Golzar",
"family_name": "Hossain",
"email": null,
"author_order": 7,
"ORCID": "https://orcid.org/0000-0002-1487-5444",
"corresponding": false,
"co_first_author": false,
"co_author": false,
"corresponding_author_info": "",
"article": 319
},
{
"id": 1585,
"affiliation": [
{
"affiliation": "ABEx Bio-Research Center, East Azampur, Dhaka-1230, Bangladesh"
},
{
"affiliation": "Graduate School of Pharmaceutical Sciences, College of Pharmacy, Ewha Womans University, Seoul 03760, Republic of Korea"
}
],
"first_name": "Md Jamal",
"family_name": "Uddin",
"email": "hasan800920@gmail.com",
"author_order": 8,
"ORCID": "https://orcid.org/0000-0003-2911-3255",
"corresponding": true,
"co_first_author": false,
"co_author": false,
"corresponding_author_info": "Md Jamal Uddin, PhD; ABEx Bio-Research Center, East Azampur, Dhaka-1230, Bangladesh. Email: hasan800920@gmail.com",
"article": 319
}
],
"views": 658,
"downloads": 106,
"references": [
{
"id": 13218,
"serial_number": 1,
"pmc": null,
"reference": "Asrani SK, Devarbhavi H, et al. Burden of liver diseases in the world. Journal of Hepatology. 2019;70:151-71.",
"DOI": null,
"article": 319
},
{
"id": 13219,
"serial_number": 2,
"pmc": null,
"reference": "Jiang S, Uddin MJ, et al. Peroxisomal fitness: A potential protective mechanism of fenofibrate against high fat diet-induced non-alcoholic fatty liver disease in mice. Diabetes & Metabolism Journal. 2022;46:829-42.",
"DOI": null,
"article": 319
},
{
"id": 13220,
"serial_number": 3,
"pmc": null,
"reference": "Niederreiter L, Tilg H. Cytokines and fatty liver diseases. Liver Research. 2018;2:14-20.",
"DOI": null,
"article": 319
},
{
"id": 13221,
"serial_number": 4,
"pmc": null,
"reference": "Starley BQ, Calcagno CJ, et al. Nonalcoholic fatty liver disease and hepatocellular carcinoma: A weighty connection. 2010. p. 1820-31.",
"DOI": null,
"article": 319
},
{
"id": 13222,
"serial_number": 5,
"pmc": null,
"reference": "Uddin MJ, Joe Y, et al. Inhibitory effects of chung hun wha dam tang (chwdt) on high-fat diet-induced obesity via amp-activated protein kinase activation. Evidence-Based Complementary and Alternative Medicine. 2012;2012:1-10.",
"DOI": null,
"article": 319
},
{
"id": 13223,
"serial_number": 6,
"pmc": null,
"reference": "Popko K, Gorska E, et al. Proinflammatory cytokines il-6 and tnf-α and the development of inflammation in obese subjects. European Journal of Medical Research. 2010;15:120-.",
"DOI": null,
"article": 319
},
{
"id": 13224,
"serial_number": 7,
"pmc": null,
"reference": "Jorge ASB, Andrade JMO, et al. Body mass index and the visceral adipose tissue expression of il-6 and tnf-alpha are associated with the morphological severity of non-alcoholic fatty liver disease in individuals with class iii obesity. Obesity Research & Clinical Practice. 2018;12:1-8.",
"DOI": null,
"article": 319
},
{
"id": 13225,
"serial_number": 8,
"pmc": null,
"reference": "Parker R. The role of adipose tissue in fatty liver diseases. Liver Research. 2018;2:35-42.",
"DOI": null,
"article": 319
},
{
"id": 13226,
"serial_number": 9,
"pmc": null,
"reference": "Beyoğlu D, Idle JR. Metabolomic insights into the mode of action of natural products in the treatment of liver disease. Biochemical Pharmacology. 2020;180:114171-.",
"DOI": null,
"article": 319
},
{
"id": 13227,
"serial_number": 10,
"pmc": null,
"reference": "Xu J-Y, Zhang L, et al. Natural products on nonalcoholic fatty liver disease. Current Drug Targets. 2015;16:1347-55.",
"DOI": null,
"article": 319
},
{
"id": 13228,
"serial_number": 11,
"pmc": null,
"reference": "Andreu GP, Delgado R, et al. Iron complexing activity of mangiferin, a naturally occurring glucosylxanthone, inhibits mitochondrial lipid peroxidation induced by fe2+-citrate. European Journal of Pharmacology. 2005;513:47-55.",
"DOI": null,
"article": 319
},
{
"id": 13229,
"serial_number": 12,
"pmc": null,
"reference": "Pardo-Andreu GL, Delgado R, et al. Dual mechanism of mangiferin protection against iron-induced damage to 2-deoxyribose and ascorbate oxidation. Pharmacological research. 2006;53:253-60.",
"DOI": null,
"article": 319
},
{
"id": 13230,
"serial_number": 13,
"pmc": null,
"reference": "Zhang B, Zhao J, et al. Mangiferin activates the nrf2-are pathway and reduces etoposide-induced DNA damage in human umbilical cord mononuclear blood cells. Pharmaceutical Biology. 2015;53:503-11.",
"DOI": null,
"article": 319
},
{
"id": 13231,
"serial_number": 14,
"pmc": null,
"reference": "Akter S, Moni A, et al. Renoprotective effects of mangiferin: Pharmacological advances and future perspectives. International Journal of Environmental Research and Public Health. 2022;19:1864-.",
"DOI": null,
"article": 319
},
{
"id": 13232,
"serial_number": 15,
"pmc": null,
"reference": "Rodriguez-Gonzalez JC, Hernández-Balmaseda I, et al. Antiproliferative, antiangiogenic, and antimetastatic therapy response by mangiferin in a syngeneic immunocompetent colorectal cancer mouse model involves changes in mitochondrial energy metabolism. Frontiers in Pharmacology. 2021;12.",
"DOI": null,
"article": 319
},
{
"id": 13233,
"serial_number": 16,
"pmc": null,
"reference": "Imran M, Arshad MS, et al. Mangiferin: A natural miracle bioactive compound against lifestyle related disorders. 2017. p. 1-17.",
"DOI": null,
"article": 319
},
{
"id": 13234,
"serial_number": 17,
"pmc": null,
"reference": "Du S, Liu H, et al. Mangiferin: An effective therapeutic agent against several disorders (review). 2018. p. 4775-86.",
"DOI": null,
"article": 319
},
{
"id": 13235,
"serial_number": 18,
"pmc": null,
"reference": "Saha S, Sadhukhan P, et al. Mangiferin: A xanthonoid with multipotent anti-inflammatory potential. BioFactors. 2016;42:459-74.",
"DOI": null,
"article": 319
},
{
"id": 13236,
"serial_number": 19,
"pmc": null,
"reference": "Wang H, Ye G, et al. Identification and determination of four metabolites of mangiferin in rat urine. Journal of Pharmaceutical and Biomedical Analysis. 2007;45:793-8.",
"DOI": null,
"article": 319
},
{
"id": 13237,
"serial_number": 20,
"pmc": null,
"reference": "Li J, Liu M, et al. Mangiferin improves hepatic lipid metabolism mainly through its metabolite-norathyriol by modulating sirt-1/ampk/srebp-1c signaling. Frontiers in Pharmacology. 2018;9.",
"DOI": null,
"article": 319
},
{
"id": 13238,
"serial_number": 21,
"pmc": null,
"reference": "Fomenko EV, Chi Y. Mangiferin modulation of metabolism and metabolic syndrome. 2016. p. 492-503.",
"DOI": null,
"article": 319
},
{
"id": 13239,
"serial_number": 22,
"pmc": null,
"reference": "Kasi Viswanadh E, Nageshwar Rao B, et al. Antigenotoxic effect of mangiferin and changes in antioxidant enzyme levels of swiss albino mice treated with cadmium chloride. Human & Experimental Toxicology. 2010;29:409-18.",
"DOI": null,
"article": 319
},
{
"id": 13240,
"serial_number": 23,
"pmc": null,
"reference": "Garrido G. Protection against septic shock and suppression of tumor necrosis factor alpha and nitric oxide production on macrophages and microglia by a standard aqueous extract of mangifera indica l. (vimangs)role of mangiferin isolated from the extract. Pharmacological research. 2004;50:165-72.",
"DOI": null,
"article": 319
},
{
"id": 13241,
"serial_number": 24,
"pmc": null,
"reference": "Chowdhury A, Lu J, et al. Mangiferin ameliorates acetaminophen-induced hepatotoxicity through apap-cys and jnk modulation. Biomedicine & Pharmacotherapy. 2019;117:109097-.",
"DOI": null,
"article": 319
},
{
"id": 13242,
"serial_number": 25,
"pmc": null,
"reference": "El-Sayyad SM, Soubh AA, et al. Mangiferin protects against intestinal ischemia/reperfusion-induced liver injury: involvement of ppar-γ, gsk-3β and wnt/β-catenin pathway. European Journal of Pharmacology. 2017;809:80-6.",
"DOI": null,
"article": 319
},
{
"id": 13243,
"serial_number": 26,
"pmc": null,
"reference": "Pardo-Andreu GL, Barrios MF, et al. Protective effects of mangifera indica l extract (vimang), and its major component mangiferin, on iron-induced oxidative damage to rat serum and liver. Pharmacological research. 2008;57:79-86.",
"DOI": null,
"article": 319
},
{
"id": 13244,
"serial_number": 27,
"pmc": null,
"reference": "Bhattacharyya S, Ahmmed SM, et al. Soya phospholipid complex of mangiferin enhances its hepatoprotectivity by improving its bioavailability and pharmacokinetics. Journal of the Science of Food and Agriculture. 2014;94:1380-8.",
"DOI": null,
"article": 319
},
{
"id": 13245,
"serial_number": 28,
"pmc": null,
"reference": "Telange DR, Sohail NK, et al. Phospholipid complex-loaded self-assembled phytosomal soft nanoparticles: Evidence of enhanced solubility, dissolution rate, ex vivo permeability, oral bioavailability, and antioxidant potential of mangiferin. Drug Delivery and Translational Research. 2021;11:1056-83.",
"DOI": null,
"article": 319
},
{
"id": 13246,
"serial_number": 29,
"pmc": null,
"reference": "Dong M, Li L, et al. Mangiferin protects against alcoholic liver injury: Via suppression of inflammation-induced adipose hyperlipolysis. Food and Function. 2020;11:8837-51.",
"DOI": null,
"article": 319
},
{
"id": 13247,
"serial_number": 30,
"pmc": null,
"reference": "Saleh S, El-maraghy N, et al. Modulation of diabetes and dyslipidemia in diabetic insulin-resistant rats by mangiferin: Role of adiponectin and tnf-α. Anais da Academia Brasileira de Ciências. 2014;86:1935-48.",
"DOI": null,
"article": 319
},
{
"id": 13248,
"serial_number": 31,
"pmc": null,
"reference": "Sellamuthu PS, Arulselvan P, et al. Protective nature of mangiferin on oxidative stress and antioxidant status in tissues of streptozotocin-induced diabetic rats. ISRN Pharmacology. 2013;2013:750109-.",
"DOI": null,
"article": 319
},
{
"id": 13249,
"serial_number": 32,
"pmc": null,
"reference": "Das J, Ghosh J, et al. Mangiferin exerts hepatoprotective activity against d-galactosamine induced acute toxicity and oxidative/nitrosative stress via nrf2–nfκb pathways. Toxicology and Applied Pharmacology. 2012;260:35-47.",
"DOI": null,
"article": 319
},
{
"id": 13250,
"serial_number": 33,
"pmc": null,
"reference": "Jain PK, Kharya M, et al. Pharmacological evaluation of mangiferin herbosomes for antioxidant and hepatoprotection potential against ethanol induced hepatic damage. Drug Development and Industrial Pharmacy. 2013;39:1840-50.",
"DOI": null,
"article": 319
},
{
"id": 13251,
"serial_number": 34,
"pmc": null,
"reference": "Sathialingam M, Saidian M, et al. Evaluation of cycloferin supplement on health parameters in experimentally induced diabetic rats with and without exogenous insulin. Journal of Dietary Supplements. 2019;16:454-62.",
"DOI": null,
"article": 319
},
{
"id": 13252,
"serial_number": 35,
"pmc": null,
"reference": "Li J, Chen L, et al. The mixture of salvianolic acids from salvia miltiorrhiza and total flavonoids from anemarrhena asphodeloides attenuate sulfur mustard-induced injury. International Journal of Molecular Sciences. 2015;16:24555-73.",
"DOI": null,
"article": 319
},
{
"id": 13253,
"serial_number": 36,
"pmc": null,
"reference": "Zhou C, Li G, et al. A high-throughput metabolomic approach to explore the regulatory effect of mangiferin on metabolic network disturbances of hyperlipidemia rats. Molecular BioSystems. 2015;11:418-33.",
"DOI": null,
"article": 319
},
{
"id": 13254,
"serial_number": 37,
"pmc": null,
"reference": "Guo F, Zi T, et al. A 1 h-nmr based metabolomics study of the intervention effect of mangiferin on hyperlipidemia hamsters induced by a high-fat diet. Food & Function. 2017;8:2455-64.",
"DOI": null,
"article": 319
},
{
"id": 13255,
"serial_number": 38,
"pmc": null,
"reference": "Hsunweihuang T, Peng G, et al. Salacia oblonga root improves postprandial hyperlipidemia and hepatic steatosis in zucker diabetic fatty rats: Activation of ppar-α. Toxicology and Applied Pharmacology. 2006;210:225-35.",
"DOI": null,
"article": 319
},
{
"id": 13256,
"serial_number": 39,
"pmc": null,
"reference": "Saha S, Rashid K, et al. Attenuative role of mangiferin in oxidative stress-mediated liver dysfunction in arsenic-intoxicated murines. BioFactors. 2016;42:515-32.",
"DOI": null,
"article": 319
},
{
"id": 13257,
"serial_number": 40,
"pmc": null,
"reference": "Li M, Wu C, et al. Mangiferin improves hepatic damage-associated molecular patterns, lipid metabolic disorder and mitochondrial dysfunction in alcohol hepatitis rats. Food & Function. 2019;10:3514-34.",
"DOI": null,
"article": 319
},
{
"id": 13258,
"serial_number": 41,
"pmc": null,
"reference": "Toledo RCL, Brito LF, et al. Acute treatment with mangifera indica l. Leaf extract attenuates liver inflammation in rats fed a cafeteria diet. Food & Function. 2019;10:4861-7.",
"DOI": null,
"article": 319
},
{
"id": 13259,
"serial_number": 42,
"pmc": null,
"reference": "Wang H, Zhu Y-Y, et al. Mangiferin ameliorates fatty liver via modulation of autophagy and inflammation in high-fat-diet induced mice. Biomedicine & Pharmacotherapy. 2017;96:328-35.",
"DOI": null,
"article": 319
},
{
"id": 13260,
"serial_number": 43,
"pmc": null,
"reference": "Singh AK, Raj V, et al. Isolated mangiferin and naringenin exert antidiabetic effect via ppar γ /glut4 dual agonistic action with strong metabolic regulation. Chemico-Biological Interactions. 2018;280:33-44.",
"DOI": null,
"article": 319
},
{
"id": 13261,
"serial_number": 44,
"pmc": null,
"reference": "Pan C-w, Pan Z-z, et al. Mangiferin alleviates lipopolysaccharide and d-galactosamine-induced acute liver injury by activating the nrf2 pathway and inhibiting nlrp3 inflammasome activation. European Journal of Pharmacology. 2016;770:85-91.",
"DOI": null,
"article": 319
},
{
"id": 13262,
"serial_number": 45,
"pmc": null,
"reference": "Sekar V, Mani S, et al. Antidiabetic effect of mangiferin in combination with oral hypoglycemic agents metformin and gliclazide. Phytomedicine. 2019;59:152901-.",
"DOI": null,
"article": 319
},
{
"id": 13263,
"serial_number": 46,
"pmc": null,
"reference": "Bhargava S, Shah MB. Evaluation of efficacy of bombax ceiba extract and its major constituent, mangiferin in streptozotocin (stz)-induced diabetic rats. Journal of Complementary and Integrative Medicine. 2021;18:311-8.",
"DOI": null,
"article": 319
},
{
"id": 13264,
"serial_number": 47,
"pmc": null,
"reference": "Pal PB, Sinha K, et al. Mangiferin, a natural xanthone, protects murine liver in pb(ii) induced hepatic damage and cell death via map kinase, nf-κb and mitochondria dependent pathways. PLoS ONE. 2013;8:e56894-e.",
"DOI": null,
"article": 319
},
{
"id": 13265,
"serial_number": 48,
"pmc": null,
"reference": "Estuningtyas A, Setiabudy R, et al. The role of mangiferin in the prevention of experimentally induced iron overload in an animal model. Drug Research. 2019;69:234-40.",
"DOI": null,
"article": 319
},
{
"id": 13266,
"serial_number": 49,
"pmc": null,
"reference": "Yong Z, Ruiqi W, et al. Mangiferin ameliorates hfd-induced nafld through regulation of the ampk and nlrp3 inflammasome signal pathways. Journal of Immunology Research. 2021;2021:1-17.",
"DOI": null,
"article": 319
},
{
"id": 13267,
"serial_number": 50,
"pmc": null,
"reference": "Mahali SK, Verma N, et al. Advanced glycation end products induce lipogenesis: Regulation by natural xanthone through inhibition of erk and nf-κb. Journal of Cellular Physiology. 2014;229:1972-80.",
"DOI": null,
"article": 319
},
{
"id": 13268,
"serial_number": 51,
"pmc": null,
"reference": "Wu Z-t, Qi X-m, et al. Timosaponin a3 induces hepatotoxicity in rats through inducing oxidative stress and down-regulating bile acid transporters. Acta Pharmacologica Sinica. 2014;35:1188-98.",
"DOI": null,
"article": 319
},
{
"id": 13269,
"serial_number": 52,
"pmc": null,
"reference": "Li S, Jin S, et al. Mangiferin alleviates endoplasmic reticulum stress in acute liver injury by regulating the mir-20a/mir-101a-nrf2 axis. The Journal of Biochemistry. 2020;168:365-74.",
"DOI": null,
"article": 319
},
{
"id": 13270,
"serial_number": 53,
"pmc": null,
"reference": "Joe Y, Zheng M, et al. Cilostazol attenuates murine hepatic ischemia and reperfusion injury via heme oxygenase-dependent activation of mitochondrial biogenesis. American Journal of Physiology-Gastrointestinal and Liver Physiology. 2015;309:G21-G9.",
"DOI": null,
"article": 319
},
{
"id": 13271,
"serial_number": 54,
"pmc": null,
"reference": "Uddin MJ, Li C-s, et al. Carbon monoxide inhibits tenascin-c mediated inflammation via il-10 expression in a septic mouse model. Mediators of Inflammation. 2015;2015:1-14.",
"DOI": null,
"article": 319
},
{
"id": 13272,
"serial_number": 55,
"pmc": null,
"reference": "Brenner C, Galluzzi L, et al. Decoding cell death signals in liver inflammation. Journal of Hepatology. 2013;59:583-94.",
"DOI": null,
"article": 319
},
{
"id": 13273,
"serial_number": 56,
"pmc": null,
"reference": "Sikder B, Akter F, et al. Hmg-coa reductase inhibitor, rosuvastatin averted carbon tetrachloride -induced oxidative stress, inflammation and fibrosis in the liver of rats. J Adv Biotechnol Exp Ther. 2020;3:01-8.",
"DOI": null,
"article": 319
},
{
"id": 13274,
"serial_number": 57,
"pmc": null,
"reference": "Uddin MJ, Kim EH, et al. Pharmacotherapy against oxidative stress in chronic kidney disease: Promising small molecule natural products targeting nrf2-ho-1 signaling. Antioxidants. 2021;10:258-.",
"DOI": null,
"article": 319
},
{
"id": 13275,
"serial_number": 58,
"pmc": null,
"reference": "English AR, Zurek N, et al. Peripheral er structure and function. Current Opinion in Cell Biology. 2009;21:596-602.",
"DOI": null,
"article": 319
},
{
"id": 13276,
"serial_number": 59,
"pmc": null,
"reference": "Corazzari M, Gagliardi M, et al. Endoplasmic reticulum stress, unfolded protein response, and cancer cell fate. Frontiers in Oncology. 2017;7:78-.",
"DOI": null,
"article": 319
},
{
"id": 13277,
"serial_number": 60,
"pmc": null,
"reference": "Zheng M, Zhang Q, et al. Carbon monoxide-releasing molecules reverse leptin resistance induced by endoplasmic reticulum stress. American Journal of Physiology-Endocrinology and Metabolism. 2013;304:E780-E8.",
"DOI": null,
"article": 319
},
{
"id": 13278,
"serial_number": 61,
"pmc": null,
"reference": "Wang XZ. Cloning of mammalian ire1 reveals diversity in the er stress responses. The EMBO Journal. 1998;17:5708-17.",
"DOI": null,
"article": 319
},
{
"id": 13279,
"serial_number": 62,
"pmc": null,
"reference": "Huang G, Yao J, et al. Er stress disrupts ca2+-signaling complexes and ca2+ regulation in secretory and muscle cells from perk-knockout mice. Journal of Cell Science. 2006;119:153-61.",
"DOI": null,
"article": 319
},
{
"id": 13280,
"serial_number": 63,
"pmc": null,
"reference": "Haze K, Yoshida H, et al. Mammalian transcription factor atf6 is synthesized as a transmembrane protein and activated by proteolysis in response to endoplasmic reticulum stress. Molecular Biology of the Cell. 1999;10:3787-99.",
"DOI": null,
"article": 319
},
{
"id": 13281,
"serial_number": 64,
"pmc": null,
"reference": "Liu X, Green RM. Endoplasmic reticulum stress and liver diseases. Liver Research. 2019;3:55-64.",
"DOI": null,
"article": 319
},
{
"id": 13282,
"serial_number": 65,
"pmc": null,
"reference": "Jo H, Choe SS, et al. Endoplasmic reticulum stress induces hepatic steatosis via increased expression of the hepatic very low‐density lipoprotein receptor. Hepatology. 2013;57:1366-77.",
"DOI": null,
"article": 319
},
{
"id": 13283,
"serial_number": 66,
"pmc": null,
"reference": "Angulo P. Nonalcoholic fatty liver disease. New England Journal of Medicine. 2002;346:1221-31.",
"DOI": null,
"article": 319
},
{
"id": 13284,
"serial_number": 67,
"pmc": null,
"reference": "Balakina A, Trusov N, et al. Effect of lipoic acid on the expression of nonalcoholic fatty liver di sease-associated genes in the liver of rats fed a hypercaloric choline -deficient diet. J Adv Biotechnol Exp Ther. 2024;7:612-9.",
"DOI": null,
"article": 319
},
{
"id": 13285,
"serial_number": 68,
"pmc": null,
"reference": "Longato L, Ripp K, et al. Insulin resistance, ceramide accumulation, and endoplasmic reticulum stress in human chronic alcohol-related liver disease. Oxidative Medicine and Cellular Longevity. 2012;2012:1-17.",
"DOI": null,
"article": 319
},
{
"id": 13286,
"serial_number": 69,
"pmc": null,
"reference": "Hwang I, Uddin MJ, et al. The impaired redox balance in peroxisomes of catalase knockout mice accelerates nonalcoholic fatty liver disease through endoplasmic reticulum stress. Free Radical Biology and Medicine. 2020;148:22-32.",
"DOI": null,
"article": 319
},
{
"id": 13287,
"serial_number": 70,
"pmc": null,
"reference": "Kovacs WJ, Charles KN, et al. Peroxisome deficiency-induced er stress and srebp-2 pathway activation in the liver of newborn pex2 knock-out mice. Biochimica et Biophysica Acta (BBA) - Molecular and Cell Biology of Lipids. 2012;1821:895-907.",
"DOI": null,
"article": 319
},
{
"id": 13288,
"serial_number": 71,
"pmc": null,
"reference": "Mei T, Liu Y, et al. Mir‑340‑5p: A potential direct regulator of nrf2 expression in the post‑exercise skeletal muscle of mice. Molecular Medicine Reports. 2018;19:1340-8.",
"DOI": null,
"article": 319
},
{
"id": 13289,
"serial_number": 72,
"pmc": null,
"reference": "Xu X, Chen Y, et al. Mangiferin suppresses endoplasmic reticulum stress in perivascular adipose tissue and prevents insulin resistance in the endothelium. European Journal of Nutrition. 2018;57:1563-75.",
"DOI": null,
"article": 319
},
{
"id": 13290,
"serial_number": 73,
"pmc": null,
"reference": "Liu M, Liu Y, et al. Solubility, antioxidation, and oral bioavailability improvement of mangiferin microparticles prepared using the supercritical antisolvent method. Pharmaceutics. 2020;12:90-.",
"DOI": null,
"article": 319
},
{
"id": 13291,
"serial_number": 74,
"pmc": null,
"reference": "Lin H, Teng H, et al. Pharmacokinetic and metabolomic analyses of mangiferin calcium salt in rat models of type 2 diabetes and non-alcoholic fatty liver disease. BMC Pharmacology and Toxicology. 2020;21:59-.",
"DOI": null,
"article": 319
},
{
"id": 13292,
"serial_number": 75,
"pmc": null,
"reference": "Sguizzato M, Ferrara F, et al. “Plurethosome” as vesicular system for cutaneous administration of mangiferin: Formulative study and 3d skin tissue evaluation. Pharmaceutics. 2021;13:1124-.",
"DOI": null,
"article": 319
},
{
"id": 13293,
"serial_number": 76,
"pmc": null,
"reference": "Wang Y, Karmakar T, et al. Targeting mangiferin loaded n-succinyl chitosan-alginate grafted nanoparticles against atherosclerosis – a case study against diabetes mediated hyperlipidemia in rat. Food Chemistry. 2022;370:131376-.",
"DOI": null,
"article": 319
},
{
"id": 13294,
"serial_number": 77,
"pmc": null,
"reference": "Zhao Q, Yang J, et al. Exosomes derived from mangiferin‑stimulated perivascular adipose tissue ameliorate endothelial dysfunction. Molecular Medicine Reports. 2019;19:4797-805.",
"DOI": null,
"article": 319
}
]
},
{
"id": 318,
"slug": "178-1719701008-investigation-on-the-effectiveness-of-progranulin-as-a-novel-predictive-biomarker-for-allergic-disorders",
"featured": false,
"slider": false,
"issue": "Vol8 Issue1",
"type": "original_article",
"manuscript_id": "178-1719701008",
"recieved": "2024-06-29",
"revised": null,
"accepted": "2024-11-16",
"published": "2024-12-22",
"pdf_file": "https://jabet.bsmiab.org/media/pdf_file/2024/38/178-1719701008.pdf",
"title": "Investigation on the effectiveness of progranulin as a novel predictive biomarker for allergic disorders",
"abstract": "<p>Progranulin (PGRN) has been implicated in the emergence of several inflammatory conditions. However, the function of PGRN in allergy-related conditions has not been clearly elucidated. Thus, the current study aimed to investigate the effectiveness of PGRN as a biomarker in allergic disorders. A total of 124 participants (84 with allergic disorders and 40 healthy individuals) were included in this study. Patients were divided into two groups, 38 were classified as having allergies related to the respiratory system and 46 with allergies related to the skin, based on their clinical diagnosis. This categorization was confirmed by serological diagnosis by estimating the levels of immunoglobulin E (IgE). Additionally, C-reactive protein (CRP) levels were measured for the detection of inflammation. Serum PGRN level was estimated by the enzyme-linked immunosorbent assay (ELISA) technique, while interleukin-6 (IL-6) concentration was determined by the fluorescent immunoassay technique. Serum PGRN levels were significantly increased (p>0.05) in all patient groups as compared with controls. Adult patients recorded a significant elevation in PGRN level (p<0.05) compared to the children, while no significant difference (p>0.05) was recorded in terms of disease type (respiratory tract and skin allergies) or gender. Additionally, the results of Spearman’s correlation test revealed that there was no significant correlation between PGRN and each of IgE, CRP, and IL-6. Thus, the current study concluded that PGRN had efficacy as a predictive biomarker for various allergic disorders.<strong> </strong></p>",
"journal_reference": "J Adv Biotechnol Exp Ther. 2025; 8(1): 116-124",
"academic_editor": "Md Jamal Uddin, PhD; ABEx Bio-Research Center, Dhaka, Bangladesh",
"cite_info": "Mustafa NW, Elia ZN, et al. Investigation on the effectiveness of progranulin as a novel predictive biomarker for allergic disorders. J Adv Biotechnol Exp Ther. 2025; 8(1): 116-124.",
"keywords": [
"Progranulin",
"Skin allergy",
"Biomarkers",
"Respiratory allergy"
],
"DOI": "10.5455/jabet.2025.10",
"sections": [
{
"section_number": 1,
"section_title": "INTRODUCTION",
"body": "<p>Allergy-related diseases are one of the most prevalent chronic conditions worldwide, affecting people of all ages, from infancy to old age, and they have emerged as one of the 21<sup>st</sup> century’s epidemics [<a href=\"#r-1\">1</a>]. An allergic reaction involves a misguided immune response to harmless dietary and environmental antigens called allergens [<a href=\"#r-2\">2</a>].</p>\r\n\r\n<p>Allergens differ in source and nature, causing mild to severe cutaneous and systemic symptoms based on the exposure mechanism and route of sensitization. These can come into contact with the skin, be breathed in, or be ingested [<a href=\"#r-3\">3</a>]. Numerous immune system components are crucial in mediating allergic disorders; however, immunoglobulin E (IgE) is considered one of the main drivers [<a href=\"#r-4\">4</a>]. Following exposure to the allergen, allergen-specific IgE binds to the allergen, activating mast cells that then rapidly release histamine and other mediators, resulting in symptoms [<a href=\"#r-5\">5</a>]. Aeroallergen inhalation results in allergic asthma and allergic rhinitis, whereas contact with allergens causes cutaneous allergies [<a href=\"#r-3\">3</a>].</p>\r\n\r\n<p>On the other hand, biomarkers are known as either quantitative or qualitative indicators of a biological state or condition that are related to the occurrence, severity, pathogenesis, progression, and treatment response of a certain disease [<a href=\"#r-6\">6</a>]. Thus, the evaluation of biomarkers could be a useful tool for establishing accurate diagnosis, selecting the most effective treatment, and reducing future adverse clinical outcomes [<a href=\"#r-7\">7</a>]. Several biomarkers have been investigated in allergic disorders, but the most thoroughly available for clinical use is the blood IgE level. Importantly, the elevated IgE levels typically signify allergic disorders [<a href=\"#r-8\">8</a>].</p>\r\n\r\n<p>Furthermore, progranulin (PGRN) is a protein having anti-inflammatory and immunomodulatory characteristics that is mainly produced by immunological and epithelial cells [<a href=\"#r-9\">9</a>]. Increased levels of PGRN in the serum are thought to be a useful nonspecific inflammatory marker for both acute and chronic inflammations, and they have recently been linked to diseases caused by a variety of etiologies [<a href=\"#r-10\">10</a>]. Thus, the present study aimed to investigate the efficacy of PGRN as a novel biomarker in different allergic disorders and to find out whether it is specific to a particular type of allergy or not.</p>"
},
{
"section_number": 2,
"section_title": "MATERIALS AND METHODS",
"body": "<p><strong>Study design and participants</strong></p>\r\n\r\n<p>During the period from February to August 2023, a total of 84 patients (40 females and 44 males, aged 4-73 years) who were clinically diagnosed as having allergic disorders were included in this study. Further, the patients were split into two groups: 38 with respiratory allergies and 46 with skin allergies. Another 40 healthy individuals without any evidence of allergic diseases were also enrolled as a control group.</p>\r\n\r\n<p><strong> </strong></p>\r\n\r\n<p><strong>Ethical approval </strong></p>\r\n\r\n<p>The study methodology was confirmed by the medical ethics committee of Erbil Polytechnic University, Iraq (permission no.: 24/0016HRE in 2023/4/8). Additionally, all participants provided verbal consent.</p>\r\n\r\n<p><strong> </strong></p>\r\n\r\n<p><strong>Sample collection and laboratory assays</strong></p>\r\n\r\n<p>Blood samples were collected from all participants by vein puncture and allowed to clot. The sera were separated using centrifugation at 4000 rpm for 15 minutes, and they were kept at -20 °C until they were utilized in subsequent assays. To confirm the clinical diagnosis of allergic cases, total serum IgE levels were measured using the ichroma™ II (Boditech, Korea), which calculates and displays the result automatically in terms of IU/mL.</p>\r\n\r\n<p>Furthermore, latex immunoassay using Architect Abbot c4000 (Abbott, USA) was employed to estimate the levels of CRP. 10 μL of serum was added to the glycine buffer. Then, anti-human CRP rabbit serum was added and mixed. After that, the mixture was determined by measuring the decrease of transmitted light at a wavelength of 572 nm.</p>\r\n\r\n<p>Serum PGRN levels were estimated by the sandwich enzyme-linked immunosorbent assay (ELISA) technique utilizing the Human PGRN ELISA Kit (MyBiosource/USA). Anti-PRGN antibody was pre-coated onto the micro-ELISA plates. The biotin-conjugated anti-PRGN antibody was utilized as a detecting antibody. The standards and test samples were added to the wells, incubated for 60 minutes, and then rinsed with wash buffer. Biotin-conjugated detection antibody was added and incubated, and the unbound conjugates were removed using a wash buffer. Finally, horseradish peroxidase (HRP)-Streptavidin was added, followed by an acidic stop solution. The results were read using a Thermo Scientific microplate reader (Multiskan FC-USA) at an absorbance of 450 nm.</p>\r\n\r\n<p>Serum concentrations of IL-6 were determined with an automatic biochemical analyzer (Cobas® 6000; Roche, Germany), in which serum samples were incubated with biotinylated monoclonal IL-6-specific antibody and detected by fluorescent immunoassay technique. Every assay was carried out in accordance with the guidelines provided by the manufacturers.</p>\r\n\r\n<p> </p>\r\n\r\n<p><strong>Statistical analysis</strong></p>\r\n\r\n<p>GraphPad Prism Software Version 8 was used to analyze the data. The independent t-test, Mann-Whitney U test, and Spearman's correlation were used to estimate the differences between the variant groups. A p value of less than 0.05 (p < 0.05) was considered statistically significant, and all data are presented as mean ± standard deviation (SD).</p>"
},
{
"section_number": 3,
"section_title": "RESULTS",
"body": "<p><strong>Serological characteristics of allergic patients</strong></p>\r\n\r\n<p>During the study period, 84 patients clinically diagnosed with allergic disorders were recruited into this research, and they were categorized into respiratory and skin allergic groups. Levels of serum IgE as a common biomarker were estimated to approve the diagnosis. The result revealed higher serum IgE levels (> 100 IU/ml) in patients with skin allergies. However, no significant differences (p > 0.05) regarding allergy type and gender were found between different groups in the serum IgE levels (IU/ml), while the differences were significant regarding age (<a href=\"#Table-1\">Table 1</a>).</p>\r\n\r\n<p style=\"text-align:center\"><strong>Table 1.</strong> Differences in serum IgE levels among patient groups.</p>\r\n\r\n<div id=\"Table-1\">\r\n<p style=\"text-align:center\"><a href=\"https://jabet.bsmiab.org/table/178-1719701008-table1/\">Table-1</a></p>\r\n</div>\r\n\r\n<p> </p>\r\n\r\n<p><strong>Serum levels</strong><strong> of </strong><strong>CRP</strong><strong> in </strong><strong>allergic patients</strong></p>\r\n\r\n<p>CRP had been measured in the serum of patients with allergic disease. It is used to determine whether allergic symptoms are related to an inflammatory or non-inflammatory condition. Results that are 10 mg/L or more were considered positive. It was found that the mean serum CRP levels were positive for all patient groups, while no statistically significant differences were found between various patient groups according to allergy type, age, and gender (<a href=\"#Table-2\">Table 2</a>).</p>\r\n\r\n<p style=\"text-align:center\"><strong>Table 2.</strong> Differences in serum CRP levels among patient groups.</p>\r\n\r\n<div id=\"Table-2\">\r\n<p style=\"text-align:center\"><a href=\"https://jabet.bsmiab.org/table/178-1719701008-table2/\">Table-2</a></p>\r\n</div>\r\n\r\n<p> </p>\r\n\r\n<p><strong>Serum levels of PRGN and IL-6 in allergic patients</strong></p>\r\n\r\n<p>As shown in <a href=\"#figure1\">Figure 1</a>, serum PGRN levels in the patient groups, respiratory and skin allergic disorders, were significantly elevated as compared with healthy controls (10.43±4.042 ng/ml and 9.924±4.303 ng/ml, respectively <em>vs</em> 1.422±0.374 ng/ml; p < 0.05). Additionally, when serum PGRN levels were evaluated in patients with normal CRP and those with elevated CRP in comparison with the control group, they both displayed significantly greater values than controls (<a href=\"#figure1\">Figure 1</a>).</p>\r\n\r\n<p>Moreover, <a href=\"#Table-3\">Table 3</a> shows comparisons in serum PRGN levels among patient groups. With respect to allergy type, gender, and CRP level, there were no statistically significant variations. Interestingly, there was a significant difference between adults and children in serum PRGN levels (11.04±3.773 <em>vs</em> 6.267±3.75 ng/ml, respectively; p < 0.05).</p>\r\n\r\n<p>On the other hand, serum IL-6 levels were also determined in patients with allergies. Considerably high serum IL-6 levels (> 5 pg/ml) in patients with allergies were detected. Regarding allergy type, the differences in the IL-6 levels between patients with respiratory allergy and skin allergy were statistically significant (8.013±1.942 and 6.687±1.467, respectively; p > 0.05) (<a href=\"#Table-4\">Table 4</a>). However, there were no significant differences in mean serum IL-6 levels regarding gender and age (<a href=\"#Table-4\">Table 4</a>). </p>\r\n\r\n<div id=\"figure1\">\r\n<figure class=\"image\"><img alt=\"\" height=\"506\" src=\"/media/article_images/2024/53/24/178-1719701008-Figure1.jpg\" width=\"500\" />\r\n<figcaption><strong>Figure 1.</strong> Comparison of serum PGRN levels (ng/ml) among patient groups and control. Serum PGRN levels were significantly elevated (****p-value ≤ 0.0001) in patients with allergies compared with controls. (A) total patients. (B) Patients with respiratory allergic conditions. (C) Patients with skin allergic conditions. (D) Patients with normal CRP levels. (E) Patients with elevated CRP levels. PGRN, progranulin; CRP, C-reactive protein.</figcaption>\r\n</figure>\r\n\r\n<p> </p>\r\n</div>\r\n\r\n<p style=\"text-align:center\"><strong>Table 3.</strong> Differences in mean serum PGRN levels among patient groups.</p>\r\n\r\n<div id=\"Table-3\">\r\n<p style=\"text-align:center\"><a href=\"https://jabet.bsmiab.org/table/178-1719701008-table3/\">Table-3</a></p>\r\n</div>\r\n\r\n<p> </p>\r\n\r\n<p style=\"text-align:center\"><strong>Table 4.</strong> Differences in mean serum IL-6 levels among patient groups.</p>\r\n\r\n<div id=\"Table-4\">\r\n<p style=\"text-align:center\"><a href=\"https://jabet.bsmiab.org/table/178-1719701008-table4/\">Table-4</a></p>\r\n</div>\r\n\r\n<p> </p>\r\n\r\n<p><strong>Correlation between PGRN levels and the other biomarkers in allergic patients</strong></p>\r\n\r\n<p>According to the results, PGRN levels exhibited no considerable correlations with IgE levels (r = 0.09374; p < 0.586), CRP levels (r = -0.2281; p < 0.472), and IL-6 levels (r = 0.2437; p < 0.300) in patients with allergic disorders (<a href=\"#figure2\">Figure 2</a>).</p>\r\n\r\n<div id=\"figure2\">\r\n<figure class=\"image\"><img alt=\"\" height=\"362\" src=\"/media/article_images/2024/53/24/178-1719701008-Figure2.jpg\" width=\"500\" />\r\n<figcaption><strong>Figure 2. </strong>Correlation between PGRN levels and biomarkers of allergies and inflammations. PGRN levels exhibited no correlations with A) IgE levels (r = 0.09374; p < 0.586), B) CRP levels (r = -0.2281; p < 0.472), and C) IL-6 levels (r = 0.2437; p < 0.300) in patients with allergic disorders. PGRN: Progranulin, IgE: Immunoglobulin E, CRP: C-Reactive protein, IL-6: Interleukin-6.</figcaption>\r\n</figure>\r\n</div>"
},
{
"section_number": 4,
"section_title": "DISCUSSION",
"body": "<p>The constantly rising incidence rates and significant recurrence rates of allergic disorders are recently garnering more attention [<a href=\"#r-1\">1</a>]. Therefore, it is becoming increasingly important to develop diagnostic tools for allergic disorders, and the purpose of this study was to investigate the effectiveness of PGRN as a novel biomarker in allergic disorders and ascertain whether it is specific to a certain type of allergy or not. Consequently, this study has covered airway and skin allergies. Biomarkers have always been an essential part of more recent and advanced therapeutic approaches for the diagnosis, prognosis, and treatment of diverse diseases [<a href=\"#r-7\">7</a>].</p>\r\n\r\n<p>In this study, IgE levels were elevated in all patient groups; this result emphasized the presence of allergic reactions in all patients. Kostova et al. reported that one of the main indicators of allergic disorders is elevated IgE [<a href=\"#r-8\">8</a>]. Patients with symptoms of asthma, allergic rhinitis, and atopic dermatitis can be identified as allergic by measuring their total IgE [<a href=\"#r-11\">11</a>, <a href=\"#r-12\">12</a>]. Moreover, CRP is a benchmark for physicians to detect or rule out inflammation and infection [<a href=\"#r-13\">13, 14</a>]. Hence, in this study, CRP was measured to detect the inflammation status in allergic patients. There were no significant differences in the levels of CRP between groups according to allergy type, age, and gender despite the elevating mean levels of CRP that have been recorded in allergic patients. Similar results were obtained from previous studies that concluded increasing serum CRP concentrations in patients with allergic diseases compared to controls [<a href=\"#r-15\">15, 16</a>]. Additionally, chronic allergies, particularly those that contribute to asthma or eczema, can cause a continuous low-grade inflammatory state, and this persistent inflammation might lead to a mild to moderate increase in CRP levels over time [<a href=\"#r-17\">17</a>].</p>\r\n\r\n<p>PGRN is a crucial modulator of inflammation and immunity [<a href=\"#r-18\">18</a>]. Numerous studies have demonstrated the critical role that PGRN plays in the human body, including its involvement in angiogenesis, wound healing, cell formation, neoplasia, cell cycle regulation, embryogenesis, and the modulation of autoimmune responses [<a href=\"#r-10\">10</a>, <a href=\"#r-19\">19-23</a>]. Despite that, little data has been published regarding PGRN in relation to allergic disorders, particularly skin allergies.</p>\r\n\r\n<p>In this study, patients with allergic diseases had considerably higher serum PGRN levels than healthy controls. To our knowledge, this is the first study to reveal that patients with allergies, especially those with skin allergies, had considerably higher levels of PGRN in their sera. However, in line with this finding, Choi and colleagues investigated the role of PGRN in the etiology of allergic asthma in mice and showed that, upon exposure to allergens, macrophage-derived PGRN stimulated the production of type 2 cytokines in natural killer (NK) T cells and epithelial cells during the initial sensitization phase [<a href=\"#r-24\">24</a>]. In contrast, Park et al., found that the asthma group had considerably lower blood PGRN levels than the healthy group and they suggested that serum PGRN could be an indication of severe asthma [<a href=\"#r-25\">25</a>]. In this study also, PGRN levels of the respiratory allergy group were comparable to those in skin allergy; the differences between them were found to be non-significant. According to the findings of a prior study conducted by Mustafa et al., this could be connected to the non-specific function of PGRN that affects various inflammatory conditions in a similar way [<a href=\"#r-10\">10</a>]. Likewise, considering the serum levels of CRP, the differences in PGRN levels between these groups were also non-significant. In a prior study, PGRN levels were linked to pulmonary cell damage caused by the inflammatory process and corresponded with activity markers like CRP [<a href=\"#r-26\">26</a>]. On the other hand, it is important to note that serum PRGN was independent of the patient’s gender [<a href=\"#r-27\">27</a>]. In the current study, there was no statistical difference in serum PGRN levels between males and females. Furthermore, the mean serum PGRN levels were higher in adults than in children, supporting the previous reports that PGRN levels increased with age [<a href=\"#r-28\">28, 29</a>]. However, Gunes et al. showed no correlations between PGRN serum levels and age [<a href=\"#r-30\">30</a>]. Moreover, the current study has shown that individuals with respiratory allergic conditions have statistically significant elevations in serum IL-6 levels compared to those with skin allergies. This could be due to the localized nature of skin allergic reactions compared to the more systemic nature of respiratory allergies. Similarly, Gubernatorova and colleagues reported that allergic asthma is characterized by an elevation in IL-6 levels, which is similar to other pro-inflammatory cytokines and is important in the pathogenesis of this disease [<a href=\"#r-31\">31</a>]. On the other hand, even though all patient groups in the current study had elevated serum levels of IgE, CRP, and IL-6, PGRN levels did not show significant relationships with any of them. This could be due to the different functions and mechanisms these biomarkers play in the inflammatory process. In the last few decades, several studies have shown that IgE, IL-6, CRP, and recently the PGRN are components of an immunological and inflammatory response network that interact in allergic disorders [<a href=\"#r-32\">32</a>]. PGRN may influence IL-6 levels by modulating immunological responses and inflammation. IL-6 enhances the inflammatory response and accelerates Th2 cell differentiation by stimulating CD4 T cells to produce more IL-4, which promotes IgE production. CRP is induced by IL-6, and increased IL-6 can raise CRP levels, which are indicators of systemic inflammation [<a href=\"#r-14\">14</a>, <a href=\"#r-18\">18</a>, <a href=\"#r-33\">33</a>, <a href=\"#r-34\">34</a>].</p>\r\n\r\n<p>The relatively small sample size and the restricted previous data were realized as potential limitations of this investigation. Therefore, large and in-depth studies are required to confirm the findings of the current study and to fully understand the role of PGRN in allergic conditions, particularly in skin allergies.</p>"
},
{
"section_number": 5,
"section_title": "CONCLUSIONS",
"body": "<p>In summary, this study has shown that PGRN levels are raised in individuals with both respiratory and skin allergic disorders and suggests that PGRN has the efficiency to be a novel, non-specific, and useful biomarker of various allergies. Furthermore, there is no correlation found between the PGRN and increasing IgE, CRP, and IL-6 within these patient populations.</p>"
},
{
"section_number": 6,
"section_title": "ACKNOWLEDGEMENTS",
"body": "<p>None.</p>"
},
{
"section_number": 7,
"section_title": "AUTHOR CONTRIBUTIONS",
"body": "<p>NWM and ZNE participated in the study's design. SFN and SHH performed the patients’ clinical examination. The laboratory testing was done by AMA and ZNE. NWM conducted the statistical analysis for this study. SFJ wrote this article and assumed charge of the manuscript's revision. All authors have read and approved the final manuscript.</p>"
},
{
"section_number": 8,
"section_title": "CONFLICTS OF INTEREST",
"body": "<p>There is no conflict of interest among the authors.</p>"
}
],
"figures": [
{
"figure": "https://jabet.bsmiab.org/media/article_images/2024/53/24/178-1719701008-Figure1.jpg",
"caption": "Figure 1. Comparison of serum PGRN levels (ng/ml) among patient groups and control. Serum PGRN levels were significantly elevated (****p-value ≤ 0.0001) in patients with allergies compared with controls. (A) total patients. (B) Patients with respiratory allergic conditions. (C) Patients with skin allergic conditions. (D) Patients with normal CRP levels. (E) Patients with elevated CRP levels. PGRN, progranulin; CRP, C-reactive protein.",
"featured": true
},
{
"figure": "https://jabet.bsmiab.org/media/article_images/2024/53/24/178-1719701008-Figure2.jpg",
"caption": "Figure 2. Correlation between PGRN levels and biomarkers of allergies and inflammations. PGRN levels exhibited no correlations with A) IgE levels (r = 0.09374; p < 0.586), B) CRP levels (r = -0.2281; p < 0.472), and C) IL-6 levels (r = 0.2437; p < 0.300) in patients with allergic disorders. PGRN: Progranulin, IgE: Immunoglobulin E, CRP: C-Reactive protein, IL-6: Interleukin-6.",
"featured": false
}
],
"authors": [
{
"id": 1572,
"affiliation": [
{
"affiliation": "Department of Clinical Pharmacy, College of Pharmacy, University of Basrah, Iraq"
}
],
"first_name": "Nisreen W.",
"family_name": "Mustafa",
"email": "nisrenw@yahoo.com",
"author_order": 1,
"ORCID": "https://orcid.org/0000-0002-9477-9371",
"corresponding": true,
"co_first_author": false,
"co_author": false,
"corresponding_author_info": "Nisreen W. Mustafa, Department of Clinical Pharmacy, College of Pharmacy, University of Basrah, Iraq. Email: nisrenw@yahoo.com",
"article": 318
},
{
"id": 1573,
"affiliation": [
{
"affiliation": "Department of Medical Laboratory Technology, Erbil Technical Health and Medical College, Erbil Polytechnic University, Erbil, Iraq"
}
],
"first_name": "Zaid N.",
"family_name": "Elia",
"email": null,
"author_order": 2,
"ORCID": null,
"corresponding": false,
"co_first_author": false,
"co_author": false,
"corresponding_author_info": "",
"article": 318
},
{
"id": 1574,
"affiliation": [
{
"affiliation": "Pharmaceutical Department, Pharmacy College, Ninevah University, Iraq"
}
],
"first_name": "Abeer M. Abdel",
"family_name": "Rasool",
"email": null,
"author_order": 3,
"ORCID": null,
"corresponding": false,
"co_first_author": false,
"co_author": false,
"corresponding_author_info": "",
"article": 318
},
{
"id": 1575,
"affiliation": [
{
"affiliation": "Department of Medical Laboratory Technology, Erbil Technical Health and Medical College, Erbil Polytechnic University, Erbil, Iraq"
}
],
"first_name": "Sanaria F.",
"family_name": "Jarjes",
"email": null,
"author_order": 4,
"ORCID": null,
"corresponding": false,
"co_first_author": false,
"co_author": false,
"corresponding_author_info": "",
"article": 318
},
{
"id": 1576,
"affiliation": [
{
"affiliation": "Department of Medicine, College of Medicine, University of Mosul, Iraq"
}
],
"first_name": "Salam F.",
"family_name": "Nawara",
"email": null,
"author_order": 5,
"ORCID": null,
"corresponding": false,
"co_first_author": false,
"co_author": false,
"corresponding_author_info": "",
"article": 318
},
{
"id": 1577,
"affiliation": [
{
"affiliation": "Erbil Dermatologic Teaching Center, Iraq"
}
],
"first_name": "Shakhawan H.",
"family_name": "Hamid",
"email": null,
"author_order": 6,
"ORCID": null,
"corresponding": false,
"co_first_author": false,
"co_author": false,
"corresponding_author_info": "",
"article": 318
}
],
"views": 607,
"downloads": 96,
"references": [
{
"id": 13184,
"serial_number": 1,
"pmc": null,
"reference": "Wang J, Zhou Y, et al. Pathogenesis of allergic diseases and implications for therapeutic interventions. Signal transduction and targeted therapy. 2023;8:138.",
"DOI": null,
"article": 318
},
{
"id": 13185,
"serial_number": 2,
"pmc": null,
"reference": "Falcon RMG, Caoili SEC. Immunologic, genetic, and ecological interplay of factors involved in allergic diseases. Frontiers in allergy. 2023;4:1215616.",
"DOI": null,
"article": 318
},
{
"id": 13186,
"serial_number": 3,
"pmc": null,
"reference": "Mir MA, Mehraj U, et al. Hypersensitivity reaction. The Fundamentals of Hypersensitivities and Allergies; Nova Science Publishers Inc: New York, NY, USA. 2020:1-34.",
"DOI": null,
"article": 318
},
{
"id": 13187,
"serial_number": 4,
"pmc": null,
"reference": "Hostoffer RW, Joseph NI. Immunoglobulin e. Statpearls. Treasure Island (FL) ineligible companies. Disclosure: Nancy Joseph declares no relevant financial relationships with ineligible companies.: StatPearls Publishing, Copyright © 2024, StatPearls Publishing LLC.; 2024.",
"DOI": null,
"article": 318
},
{
"id": 13188,
"serial_number": 5,
"pmc": null,
"reference": "Fernandez J. Overview of allergic and atopic disorders. MSD Manual Professional Edition: MSD Manual; 2024.",
"DOI": null,
"article": 318
},
{
"id": 13189,
"serial_number": 6,
"pmc": null,
"reference": "Califf RM. Biomarker definitions and their applications. Experimental biology and medicine (Maywood, NJ). 2018;243:213-21.",
"DOI": null,
"article": 318
},
{
"id": 13190,
"serial_number": 7,
"pmc": null,
"reference": "Ahmad A, Imran M, et al. Biomarkers as biomedical bioindicators: Approaches and techniques for the detection, analysis, and validation of novel biomarkers of diseases. Pharmaceutics. 2023;15:1630.",
"DOI": null,
"article": 318
},
{
"id": 13191,
"serial_number": 8,
"pmc": null,
"reference": "Kostova P, Papochieva V, et al. Elevated ige levels-an allergy or an underlying inborn error of immunity in children with recurrent infections? Antibodies (Basel, Switzerland). 2023;12.",
"DOI": null,
"article": 318
},
{
"id": 13192,
"serial_number": 9,
"pmc": null,
"reference": "Fan Y, Ming-Han C, et al. Progranulin: A promising biomarker and therapeutic target for fibrotic diseases. Acta Pharmaceutica Sinica B. 2024;14:3312-26.",
"DOI": null,
"article": 318
},
{
"id": 13193,
"serial_number": 10,
"pmc": null,
"reference": "Mustafa N, Naser O, et al. Evaluation of the inflammatory predictive efficiency of progranulin as compared with common pro-inflammatory regulators. J Adv Biotechnol Exp Ther. 2023;6:316.",
"DOI": null,
"article": 318
},
{
"id": 13194,
"serial_number": 11,
"pmc": null,
"reference": "Saglam NO, Ozkars MY, et al. Evaluation of the predictive value of total ige and absolute eosinophil levels on allergy test positivity. Northern clinics of Istanbul. 2023;10:602-8.",
"DOI": null,
"article": 318
},
{
"id": 13195,
"serial_number": 12,
"pmc": null,
"reference": "Blöndal V, Sundbom F, et al. Allergic sensitisation and type-2 inflammation is associated with new-onset and persistent allergic disease. Clinical and translational allergy. 2023;13:e12240.",
"DOI": null,
"article": 318
},
{
"id": 13196,
"serial_number": 13,
"pmc": null,
"reference": "Mouliou DS. C-reactive protein: Pathophysiology, diagnosis, false test results and a novel diagnostic algorithm for clinicians. Diseases (Basel, Switzerland). 2023;11.",
"DOI": null,
"article": 318
},
{
"id": 13197,
"serial_number": 14,
"pmc": null,
"reference": "Sproston NR, Ashworth JJ. Role of c-reactive protein at sites of inflammation and infection. Frontiers in immunology. 2018;9:754.",
"DOI": null,
"article": 318
},
{
"id": 13198,
"serial_number": 15,
"pmc": null,
"reference": "Galez D, Dodig S, et al. C-reactive protein in children with asthma and allergic rhinitis. Biochemia Medica. 2006;16:163-9.",
"DOI": null,
"article": 318
},
{
"id": 13199,
"serial_number": 16,
"pmc": null,
"reference": "Vekaria AS, Brunner PM, et al. Moderate-to-severe atopic dermatitis patients show increases in serum c-reactive protein levels, correlating with skin disease activity. F1000Research. 2017;6:1712.",
"DOI": null,
"article": 318
},
{
"id": 13200,
"serial_number": 17,
"pmc": null,
"reference": "Sinikumpu SP, Huilaja L, et al. The association between low grade systemic inflammation and skin diseases: A cross-sectional survey in the northern finland birth cohort 1966. Acta dermato-venereologica. 2018;98:65-9.",
"DOI": null,
"article": 318
},
{
"id": 13201,
"serial_number": 18,
"pmc": null,
"reference": "Lan Y-J, Sam NB, et al. Progranulin as a potential therapeutic target in immune-mediated diseases. Journal of Inflammation Research. 2021:6543-56.",
"DOI": null,
"article": 318
},
{
"id": 13202,
"serial_number": 19,
"pmc": null,
"reference": "Cerezo LA, Kuklová M, et al. Progranulin is associated with disease activity in patients with rheumatoid arthritis. Mediators Inflamm. 2015;2015:740357.",
"DOI": null,
"article": 318
},
{
"id": 13203,
"serial_number": 20,
"pmc": null,
"reference": "Tian R, Li Y, et al. Pgrn suppresses inflammation and promotes autophagy in keratinocytes through the wnt/β-catenin signaling pathway. Inflammation. 2016;39:1387-94.",
"DOI": null,
"article": 318
},
{
"id": 13204,
"serial_number": 21,
"pmc": null,
"reference": "Xu X, Gou L, et al. Progranulin protects against endotoxin-induced acute kidney injury by downregulating renal cell death and inflammatory responses in mice. International immunopharmacology. 2016;38:409-19.",
"DOI": null,
"article": 318
},
{
"id": 13205,
"serial_number": 22,
"pmc": null,
"reference": "Fujii A, Mizutani YH, et al. Serum progranulin level is a novel tool for monitoring disease activity of dermatomyositis with antimelanoma differentiation-associated protein 5 antibodies. Journal of Cutaneous Immunology and Allergy. 2021;4:50-6.",
"DOI": null,
"article": 318
},
{
"id": 13206,
"serial_number": 23,
"pmc": null,
"reference": "Alkyoon F, Dananah F. Correlation between serum levels of progranulin and spirometric readings in patients with chronic obstructive pulmonary disease. Journal of Prevention, Diagnosis and Management of Human Diseases. 2024;4:21-8.",
"DOI": null,
"article": 318
},
{
"id": 13207,
"serial_number": 24,
"pmc": null,
"reference": "Choi JP, Park SY, et al. Macrophage-derived progranulin promotes allergen-induced airway inflammation. Allergy. 2020;75:1133-45.",
"DOI": null,
"article": 318
},
{
"id": 13208,
"serial_number": 25,
"pmc": null,
"reference": "Park SY, Hong GH, et al. Serum progranulin as an indicator of neutrophilic airway inflammation and asthma severity. Annals of allergy, asthma & immunology : official publication of the American College of Allergy, Asthma, & Immunology. 2016;117:646-50.",
"DOI": null,
"article": 318
},
{
"id": 13209,
"serial_number": 26,
"pmc": null,
"reference": "Tanaka A, Tsukamoto H, et al. Serum progranulin levels are elevated in dermatomyositis patients with acute interstitial lung disease, predicting prognosis. Arthritis research & therapy. 2015;17:27.",
"DOI": null,
"article": 318
},
{
"id": 13210,
"serial_number": 27,
"pmc": null,
"reference": "Tóth NM, Müller V, et al. Serum progranulin level might differentiate non-ipf ild from ipf. International journal of molecular sciences. 2023;24.",
"DOI": null,
"article": 318
},
{
"id": 13211,
"serial_number": 28,
"pmc": null,
"reference": "Liu P, Li Y, et al. Serum progranulin as a potential biomarker for frailty in chinese older adults. Aging clinical and experimental research. 2023;35:399-406.",
"DOI": null,
"article": 318
},
{
"id": 13212,
"serial_number": 29,
"pmc": null,
"reference": "Nguyen A, Malmstrom T, et al. Serum progranulin levels are associated with frailty in middle-aged individuals. PloS one. 2020;15:e0238877.",
"DOI": null,
"article": 318
},
{
"id": 13213,
"serial_number": 30,
"pmc": null,
"reference": "Gunes R, Uysal PI, et al. Evaluation of serum progranulin levels in patients with psoriasis: A case-control study. Turkish Journal of Dermatology. 2022;16:52-6.",
"DOI": null,
"article": 318
},
{
"id": 13214,
"serial_number": 31,
"pmc": null,
"reference": "Gubernatorova EO, Gorshkova EA, et al. Non-redundant functions of il-6 produced by macrophages and dendritic cells in allergic airway inflammation. Frontiers in immunology. 2018;9:2718.",
"DOI": null,
"article": 318
},
{
"id": 13215,
"serial_number": 32,
"pmc": null,
"reference": "Del Giudice M, Gangestad SW. Rethinking il-6 and crp: Why they are more than inflammatory biomarkers, and why it matters. Brain, behavior, and immunity. 2018;70:61-75.",
"DOI": null,
"article": 318
},
{
"id": 13216,
"serial_number": 33,
"pmc": null,
"reference": "Pogonowska M, Poniatowski Ł A, et al. The role of progranulin (pgrn) in the modulation of anti-inflammatory response in asthma. Central-European journal of immunology. 2019;44:97-101.",
"DOI": null,
"article": 318
},
{
"id": 13217,
"serial_number": 34,
"pmc": null,
"reference": "Rincon M, Irvin CG. Role of il-6 in asthma and other inflammatory pulmonary diseases. International journal of biological sciences. 2012;8:1281-90.",
"DOI": null,
"article": 318
}
]
},
{
"id": 317,
"slug": "178-1728556935-assessment-of-aluminium-level-in-commercial-pasteurized-and-uht-milk-in-bangladesh-and-their-potential-health-risks",
"featured": false,
"slider": false,
"issue": "Vol8 Issue1",
"type": "short_communication",
"manuscript_id": "178-1728556935",
"recieved": "2024-10-10",
"revised": null,
"accepted": "2024-12-14",
"published": "2024-12-21",
"pdf_file": "https://jabet.bsmiab.org/media/pdf_file/2024/19/178-1728556935.pdf",
"title": "Assessment of aluminium level in commercial pasteurized and UHT milk in Bangladesh and their potential health risks",
"abstract": "<p>Aluminium (Al) contamination in the dairy industry is an emerging concern due to potential health risks. With the increasing consumption of pasteurized and UHT milk in Bangladesh, monitoring Al levels has become crucial. This study aimed to measure Al concentrations in these processed products using inductively coupled plasma mass spectrometry (ICP-MS) and assess the associated health risks. Milk samples from 10 brands, including three different production lots, were collected from supermarkets. The instrumental precision for Al was 0.0212 mg/kg as a limit of detection (LOD) and 0.0643 mg/kg as a limit of quantification (LOQ), with a relative standard deviation (RSD) of 3.2%. The multi-element standard containing Al exhibited linearity in the concentration ranged from 0-0.5 mg/kg with a correlation coefficient value of 0.9994. Among the 30 samples analyzed, 13, including both pasteurized and UHT milks, were contaminated with Al. The mean Al concentrations in the contaminated samples were 0.46±0.5, 0.71±0.6, and 0.47±0.4 mg/kg in lots 1, 2, and 3, respectively, indicating variation across production lots. The estimated daily Al intake ranged from 2.00E-03 to 3.00E-03 mg/kg body weight, contributing 1.4 to 2.1% of the provisional tolerable weekly intake. The target hazard quotient (THQ) for the contaminated samples ranged from 0.045 to 0.070 (THQ < 1), suggesting that the Al levels pose no significant health risk. Thus, the Al content in pasteurized and UHT milk may be considered safe for consumption, albeit with the limitation of a small sample size in this study.<strong> </strong></p>",
"journal_reference": "J Adv Biotechnol Exp Ther. 2025; 8(1): 105-115",
"academic_editor": "Md Jamal Uddin, PhD; ABEx Bio-Research Center, Dhaka, Bangladesh",
"cite_info": "Jahan I, Al-Noman KM, et al. Assessment of aluminium level in commercial pasteurized and UHT milk in Bangladesh and their potential health risks. J Adv Biotechnol Exp Ther. 2025; 8(1): 105-115.",
"keywords": [
"Bangladesh",
"Aluminium",
"UHT",
"Milk",
"Health risk",
"Contamination"
],
"DOI": "10.5455/jabet.2025.09",
"sections": [
{
"section_number": 1,
"section_title": "INTRODUCTION",
"body": "<p>Aluminium (Al) constitutes approximately 8.0% of the Earth's crust, making it the third most abundant element in the environment [<a href=\"#r-1\">1</a>,<a href=\"#r-2\">2</a>]. The element is naturally found in soil, minerals, rocks, water, and food [<a href=\"#r-2\">2</a>]. However, despite its prevalence, Al does not fulfill any essential biological function in the human body rather linked to various health risks as reviewed by Klotz <em>et al.</em> [<a href=\"#r-3\">3</a>]. The ubiquitous presence of Al in everyday products prompts ongoing investigations into its potential impact on human health [<a href=\"#r-4\">4</a>]. In addition, the free metal cation of Al, which has high biological reactivity, is unnecessary and essentially toxic. People are consistently exposed to Al through different sources such as vaccinations, antacids, antiperspirants, and food, and this exposure is linked to inflammatory responses, oxidative damage, and disruptions in iron metabolism [<a href=\"#r-5\">5</a>]. Chronic exposure to Al has raised concerns about its potential association with neurodegenerative diseases, including Parkinson's and Alzheimer's [<a href=\"#r-6\">6</a>]. Beyond neurotoxicity, Al exposure has been linked to several other health issues such as bone injury, respiratory disorders, kidney damage, and potential carcinogenic effects [<a href=\"#r-7\">7</a>]. Published research frequently indicates that diet is the primary source of Al exposure, with gastrointestinal absorption being the main pathway for Al entering the body [<a href=\"#r-8\">8</a>]. The era of Al exposure has revealed that while chronic Al toxicity is not inevitable, it remains a potential risk. The extent of Al toxicity depends on their forms, exposure routes, and mode of delivery to the target sites [<a href=\"#r-4\">4</a>]. This risk requires rigorous investigation and should not be underestimated.</p>\r\n\r\n<p>Al is a widespread contaminant in the food industry, primarily due to its extensive use in food additives, packaging, and cooking equipment [<a href=\"#r-9\">9</a>]. Furthermore, Al can naturally occur in certain foods, including vegetables, cereals, and dairy products [<a href=\"#r-10\">10</a>]. Al-containing additives are commonly used to enhance the texture and appearance of many processed foods. These include anticaking agents and colorants, which can significantly increase Al levels in food products [<a href=\"#r-9\">9,10</a>]. The use of Al foil and cookware can lead to the leaching of Al into food during cooking or storage. Foods that are acidic or salty can exacerbate this leaching process [<a href=\"#r-11\">11</a>]. In Bangladesh, Al cookware is commonly used due to its affordability and good heat conduction properties. Studies indicate that approximately 97.56% of people use Al utensils, which can leach Al into food, especially during cooking processes involving acidic or salty foods [<a href=\"#r-12\">12</a>].</p>\r\n\r\n<p>Consumer preference for milk and milk products that provide superior nutrition, high biological value, and assurance of no associated health risks has been increasing [<a href=\"#r-13\">13</a>]. The mineral content of milk is considered a direct indicator of the milk's hygienic quality and an indirect indicator of the environmental contamination at the production site [<a href=\"#r-14\">14</a>]. Milk can be contaminated both before and after processing. Consequently, various toxic elements, such as Al, may be present in milk and milk products, leading to serious health issues for infants, children, and the elderly [<a href=\"#r-15\">15</a>]. Several studies have reported that Al concentration in milk and milk products ranges from 0.003 to 3.4 mg/kg [<a href=\"#r-16\">16-20</a>]. Al can enter milk through various sources, including the feed and fodder provided to animals, during the processing stage or through contamination from equipment made of metal [<a href=\"#r-21\">21</a>]. The Al levels in milk can increase if aluminum-based utensils are used at any stage of milk processing or storage [<a href=\"#r-22\">22</a>]. The leaching of Al from utensils depends on the quality of the containers, the pH levels maintained, the conditions during preparation, and the presence of chelating agents [<a href=\"#r-23\">23</a>]. Pasteurized milk undergoes a heating process of 72°C for 15 seconds (High Temperature Short Time Pasteurization) or 63°C for 30 minutes (Vat Pasteurization). In contrast, ultra-high temperature (UHT) milk is subjected to 138°C for 2 seconds. Pasteurization can potentially increase Al leaching into milk, particularly if high temperatures, acidic conditions, or Al-containing equipment are involved. The human body can excrete small amounts of Al very efficiently. The Joint FAO/WHO Expert Committee on Food Additives (JECFA) has set a provisional tolerable weekly intake for Al at 2 mg/kg body weight [<a href=\"#r-24\">24</a>]. In contrast, the European Food Safety Authority (EFSA) has established a lower tolerable weekly intake of 1 mg/kg body weight per week [<a href=\"#r-25\">25</a>]. Therefore, the current study aimed to quantify the Al content in commercially available pasteurized and UHT milk in Bangladesh, following the validation of the analytical method. Furthermore, it intended to estimate the daily Al intake (DAI) and target hazard quotient (THQ).</p>"
},
{
"section_number": 2,
"section_title": "MATERIALS AND METHODS",
"body": "<p><strong>Sample collection</strong></p>\r\n\r\n<p>Commercially available pasteurized and UHT milk from 10 different brands were collected from supermarkets located in Dhaka and Gazipur district and labeled as A, B, C, D, E, F, G, H, I, and J. Of these, eight samples were pasteurized, and two were UHT milk. The milk samples of similar brands were further collected from analogous shops at three different times to confirm the differences in the production lot of the target samples. Thus, a total of 30 milk samples were obtained. After procuring, the milk samples were transferred to the laboratory in their original packaging using an ice box, appropriately labeled, and stored in a laboratory refrigerator (4°C). The samples were then analyzed within the recommended storage period.</p>\r\n\r\n<p><strong> </strong></p>\r\n\r\n<p><strong>Instrumentation </strong></p>\r\n\r\n<p>The quadrupole inductively coupled plasma-mass spectrometer (ICP-MS) used in this study was a NexION 1000 (PerkinElmer Inc., Waltham, USA). The system was equipped with a high-efficiency sample introduction desolvating system featuring a quartz cyclonic spray chamber. Additionally, it included a mixing chamber designed to further homogenize and stabilize the sample aerosol stream, ensuring a more consistent signal from the ICP-MS. The system employed a PFA-ST nebulizer operating with a peristaltic pump. Before each experiment, the instrument was tuned for optimal performance as recommended by the manufacturer. The instrument settings and operating conditions are detailed in <a href=\"#Table-1\">Table 1</a>.</p>\r\n\r\n<p style=\"text-align:center\"><strong>Table 1. </strong>Parameters of ICP-MS for milk analysis.<strong> </strong></p>\r\n\r\n<div id=\"Table-1\">\r\n<p style=\"text-align:center\"><a href=\"https://jabet.bsmiab.org/table/178-1728556935-table1/\">Table-1</a> </p>\r\n</div>\r\n\r\n<p><strong>Preparation of rinse solution, calibration standard, and blank </strong></p>\r\n\r\n<p>A rinse solution was prepared for the autosampler rinse port, consisting of 20 ml of ultrapure nitric acid (60%; Suprapur, Supelco, Sigma-Aldrich Chemie GmbH, Taufkirchen, Germany), 20 ml of Tergitol solution (70%; Sigma-Aldrich Chemie GmbH, Taufkirchen, Germany), and ultrapure water (Smart2Pure Water Purification System, Thermo Fisher Scientific, Budapest, Hungary) added to a final volume of 1000 ml. All calibration standard solutions were prepared from a 10 mg/l multi-element standard solution (Periodic table mix 1 for ICP, Sigma-Aldrich Chemie GmbH, Taufkirchen, Germany). In order to prepare 1 mg/l or 1000 µg/l stock solution, 1 ml of certified standard solution was mixed with 9 ml of 5% nitric acid. The standard solutions of varying concentrations (std 1, std 2, std 3, std 4, std 5, std 6) were subsequently prepared by diluting the stock solution with 5% nitric acid to a final volume of 10 ml, as shown in <a href=\"#Table-2\">Table 2</a>. For the standard blank solution, only 5% of nitric acid was used.</p>\r\n\r\n<p style=\"text-align:center\"><strong>Table 2. </strong>Composition of standard solutions.</p>\r\n\r\n<div id=\"Table-2\">\r\n<p style=\"text-align:center\"><a href=\"https://jabet.bsmiab.org/table/178-1728556935-table2/\">Table-2</a></p>\r\n</div>\r\n\r\n<p> </p>\r\n\r\n<p><strong>Sample preparation and digestion</strong></p>\r\n\r\n<p>During sample preparation, the milk samples were taken out from the refrigerator to equilibrate to room temperature. The Microwave Sample Preparation System (Titan MPS, PerkinElmer, Inc., Waltham, USA) with 75 ml vessels was used for the digestion process. Initially, 3 ml of each milk sample was placed into separate vessels in triplicate. Subsequently, 5 ml of ultrapure concentrated nitric acid (60%; Ultrpur, Sigma-Aldrich Chemie GmbH, Taufkirchen, Germany) and 2 ml of 30% hydrogen peroxide (Sigma-Aldrich Chemie GmbH, Taufkirchen, Germany) were added to each vessel. The sample blank solution was prepared by combining 5 ml of ultrapure concentrated nitric acid, 3 ml of ultrapure water, and 2 ml of 30% hydrogen peroxide. The vessels were then sealed and placed in a microwave digester, where a specific heating program (as outlined in <a href=\"#Table-3\">Table 3</a>) was applied for the digestion of the milk samples. The temperature was gradually increased from 140°C to 195°C, followed by a gradual decrease to 50°C. After placing the sample into the digester, the digestion process was completed within 90 min. Upon completion of digestion, the samples were allowed to cool for a designated period in a fume hood. The vessel caps were then gradually unscrewed to release any built-up pressure, after which the caps were fully removed.</p>\r\n\r\n<p style=\"text-align:center\"><strong>Table 3. </strong>Temperature program for microwave digestion.</p>\r\n\r\n<div id=\"Table-3\">\r\n<p style=\"text-align:center\"><a href=\"https://jabet.bsmiab.org/table/178-1728556935-table3/\"> Table-3</a></p>\r\n</div>\r\n\r\n<p> </p>\r\n\r\n<p><strong>Analysis of samples</strong></p>\r\n\r\n<p>Prior to analysis, all digested samples were carefully filtered (Whatman filter paper, No. 1, Cytiva, Buckinghamshire, UK) to minimize contamination and transferred to 50 ml volumetric tubes. In accordance with the design, the instrument was turned into the appropriate “Standard” mode to achieve optimum sensitivity. All the standards, blanks, and samples were marked properly and then placed into the test tube holder. The digested milk samples were analyzed directly without undergoing any further dilution. A total of 30 samples and six standards, along with corresponding blanks, were analyzed using standard mode. The blank solution and standard solutions were also analyzed at regular intervals to observe the drift. The calibration standards were followed by the rinsing process, standard blank checks, sample blank checks, and, subsequently, the analysis of the milk samples.</p>\r\n\r\n<p> </p>\r\n\r\n<p><strong>V</strong><strong>alidation of </strong><strong>method</strong></p>\r\n\r\n<p>Linearity, accuracy, and precision were used for method validation. Calibration curves were prepared using standard solutions at various concentrations (0, 1, 20, 100, 300, 500 µg/l) and analyzed with an ICP-MS instrument. A standard curve for Al was subsequently constructed, from which the R² value and the linear regression equation were derived. After running the 6 standards on ICP-MS, the standard calibration curves of Al were generated. As shown in <a href=\"#figure1\">Figure 1</a>, Al had a good linear relationship with R<sup>2</sup> value of 0.9994.</p>\r\n\r\n<p>The precision of the instrument and sample digestion was assessed by determining the limits of detection (LOD), limits of quantification (LOQ), precision, and recovery percentages. The LOD and LOQ were calculated using the equations LOD = 3.3 × N/B and LOQ = 10 × N/B, where 'N' represents the standard deviation of intercept of Al (n = 3), and 'B' is the slope of the corresponding calibration curve. The instrumental precision analysis, as shown in <a href=\"#Table-4\">Table 4</a>, revealed a LOD for Al at 0.0212 µg/kg. The LOQ for Al was determined to be 0.0643 µg/kg (<a href=\"#Table-4\">Table 4</a>). Additionally, the relative standard deviation (RSD%) was calculated to be 3.2%. The method demonstrated efficiency in recovering the spiked Al, with a mean recovery of 100.8% (<a href=\"#Table-4\">Table 4</a>). These results were derived from the mean of six replicates, thereby ensuring the reliability and reproducibility of the method employed for determining Al in milk samples.</p>\r\n\r\n<p><a href=\"#Table-5\">Table 5</a> illustrates the method validation results for the determination of Al in milk samples through the analysis of the precision of the digestion method.</p>\r\n\r\n<p>The average concentration of Al detected in a milk sample with five replications was 0.38 ± 0.5 mg/kg. The addition of 0.2 mg/kg Al to the milk samples resulted in a mean spiked concentration of 0.58 ± 0.5 mg/kg. The average concentration of Al recovered from the spiked samples was 0.57 ± 0.5 mg/kg, with an average recovery percentage of 98.83 and an RSD value of 2.2%.</p>\r\n\r\n<div id=\"figure1\">\r\n<figure class=\"image\"><img alt=\"\" height=\"365\" src=\"/media/article_images/2024/45/21/178-1728556935-Figure1.jpg\" width=\"500\" />\r\n<figcaption><strong>Figure 1. </strong>Calibration curve of Al using multi-element standard solution at six various concentrations (0, 1, 20, 100, 300, 500 µg/l).</figcaption>\r\n</figure>\r\n\r\n<p> </p>\r\n</div>\r\n\r\n<p style=\"text-align:center\"><strong>Table 4.</strong> Method validation through instrumental precision analysis.</p>\r\n\r\n<div id=\"Table-4\">\r\n<p style=\"text-align:center\"><a href=\"https://jabet.bsmiab.org/table/178-1728556935-table4/\">Table-4</a></p>\r\n</div>\r\n\r\n<p><strong> </strong></p>\r\n\r\n<p style=\"text-align:center\"><strong>Table 5.</strong> Method validation through analyzing the precision of the digestion method.</p>\r\n\r\n<div id=\"Table-5\">\r\n<p style=\"text-align:center\"><a href=\"https://jabet.bsmiab.org/table/178-1728556935-table5/\">Table-5</a></p>\r\n</div>\r\n\r\n<p> </p>\r\n\r\n<p><strong>Assessment of human health risk</strong></p>\r\n\r\n<p>The human health risk assessment was performed as described in the published literature [<a href=\"#r-26\">26</a>]. The daily Al intake (DAI), weekly Al intake (WAI), and THQ were calculated by the following equa:</p>\r\n\r\n<p><img alt=\"\" height=\"34\" src=\"https://jabet.bsmiab.org/media/ck_uploads/2024/12/21/image-20241221220019-1.png\" width=\"406\" /></p>\r\n\r\n<p><img alt=\"\" height=\"36\" src=\"https://jabet.bsmiab.org/media/ck_uploads/2024/12/21/image-20241221220112-2.png\" width=\"396\" /></p>\r\n\r\n<p>Milk availability in Bangladesh was reported to be 234.45 ml per day per capita [<a href=\"#r-27\">27</a>]. The average body weight of adults in Bangladesh is 55 kg [<a href=\"#r-28\">28</a>]. The THQ was calculated using DAI and Referred oral dose (RfDo). A THQ value of less than 1 indicates that the exposed population is considered to be within a safe range. The RfDo for Al was not available; however, the Environmental Protection Agency (EPA) proposed a value of 0.043 mg/kg/day body weight for Al phosphide [<a href=\"#r-2\">2</a>], which was used to calculate THQ. The RfDo for Al is not available; however, the EPA has proposed a value of 0.043 mg/kg/day for Al phosphide, which was used in the calculation of the THQ. Since the health risk results presented in the study were entirely based on calculated values, ethical approval was not sought during the study.</p>\r\n\r\n<p><strong> </strong></p>\r\n\r\n<p><strong>Statistical analysis</strong></p>\r\n\r\n<p>The data generated in this study were recorded in an open-source tabulation software. One-way analysis of variance (ANOVA) with Duncan's Multiple Range Tests (DMRT) among means was performed using an add-in software, yStat 2008 [Shinya Yamazaki, Koriyama, Japan], followed by comparisons. All statistical tests were two-tailed, and a p-value of less than 0.05 was considered statistically significant.</p>"
},
{
"section_number": 3,
"section_title": "RESULTS",
"body": "<p><strong>Presence of Al concentrations in milk samples</strong></p>\r\n\r\n<p>The average Al concentration in milk samples from 10 brands (A–J) across three separate production lots is depicted in <a href=\"#Table-6\">Table 6</a>. Among 30 samples, 17 had no detectable Al, while others showed varying levels of Al concentration (0.05-1.74 mg/kg, on a fresh basis). Al was not detected in samples A, B, E, F, and G across all production lots. However, sample H from production lot-2 exhibited an Al concentration of 0.07 mg/kg, with an RSD value of 7.6%. Considering the Al concentration across all three production lots, brand C exhibited the highest Al concentration (1.12-1.74 mg/kg), followed closely by brand D (0.51-0.95 mg/kg), with no statistically significant differences observed (p < 0.05). Brand J (0.09-0.46 mg/kg) displayed the second highest concentration, while brand H (0.00-0.07 mg/kg) recorded the lowest Al concentration. The Al concentration in brand I (0.07-0.32 mg/kg) did not significantly differ from that of brands H and J. A comparison of Al concentrations among milk samples from different brands within individual production lots revealed that samples from brand C had the highest Al concentration, followed by those from brand D. Although a significant difference was observed between the two brands, no significant difference was detected in their overall Al concentrations (<a href=\"#Table-6\">Table 6</a>). The Al concentrations in milk samples from brands I and J showed a significant difference in production lot-2 and lot-3. However, no significant variation in Al concentration was observed between the samples from these brands in lot-1. Al was detected in brand H exclusively in lot-2 and differed significantly from other brands (<a href=\"#Table-6\">Table 6</a>).</p>\r\n\r\n<p style=\"text-align:center\"><strong>Table 6.</strong> Measured Al concentrations in milk samples from various brands and production lots.</p>\r\n\r\n<div id=\"Table-6\">\r\n<p style=\"text-align:center\"><a href=\"https://jabet.bsmiab.org/table/178-1728556935-table6/\">Table-6</a></p>\r\n</div>\r\n\r\n<p><strong> </strong></p>\r\n\r\n<p><strong>Profile of Al contaminated milk samples and their health risk</strong></p>\r\n\r\n<p>The profile of Al-contaminated milk samples, along with their associated human health risks, was presented in <a href=\"#Table-7\">Table 7</a>. A total of 13 samples represented five brands and three production lots were identified as Al-contaminated. In Lot-1, 40% of the samples from brands C, D, I, and J were found to be contaminated with Al. The Al concentration ranged from 0.07 to 1.3 mg/kg, with a mean concentration of 0.46 ± 0.5 mg/kg. The DAI was calculated as 0.002 mg/kg body weight. The contribution to the Provincial Tolerable Weekly Intake (PTWI) was 1.37%, and the THQ value was determined 0.045. In contrast, Lot-2 exhibited contamination in five out of ten samples (50%), specifically from brands C, D, H, I, and J. The Al concentration in the contaminated samples ranged from 0.07 to 1.8 mg/kg, with a mean of 0.71 ± 0.6 mg/kg. The DAI from these contaminated samples was determined to be 0.003 mg/kg body weight. The contribution to the PTWI was 2.12% and the THQ value for Al in these samples was calculated to be 0.07. Similar to lot-1, 40% of the samples from brands C, D, I, and J in Lot-3 were found to be contaminated with Al. The calculated mean concentration of Al was 0.47 ± 0.4 mg/kg, with a range from 0.07 to 1.2 mg/kg. The DAI was calculated as 0.002 mg/kg body weight. The contribution to the PTWI was 1.4% and the THQ value was determined 0.047. In Lot-1, 40% of the samples from brands C, D, I, and J were identified as contaminated with Al. In Lot-2, contamination was observed in five out of ten samples (50%), specifically from brands C, D, H, I, and J. Similar to lot-1, 40% of the samples from brands C, D, I, and J were found to be contaminated with Al in lot-3. </p>\r\n\r\n<p style=\"text-align:center\"><strong>Table 7.</strong> Profile of Al contaminated milk samples and their health risk.</p>\r\n\r\n<div id=\"Table-7\">\r\n<p style=\"text-align:center\"><a href=\"https://jabet.bsmiab.org/table/178-1728556935-table7/\">Table-7</a></p>\r\n</div>"
},
{
"section_number": 4,
"section_title": "DISCUSSION",
"body": "<p>A recent review covering articles published between 2000 and 2021 indicates that 63% of the studies use microwave-assisted digestion, and 40% employ ICP-MS to analyze milk and dairy products [<a href=\"#r-29\">29</a>]. Validation of an analytical method is a critical step to ensure the accuracy and reliability of results. In this study, the method used to measure Al concentration in pasteurized and UHT milk samples is validated by assessing the precision of both the instrument and the digestion procedure. Additionally, spike and recovery tests, which are essential for evaluating the accuracy of analytical methods [<a href=\"#r-30\">30</a>], are performed as part of the validation process. Our study demonstrates that the instrument can accurately detect a minimum Al concentration of 0.0212 mg/kg (LOD) and reliably quantify concentrations as low as 0.0643 mg/kg (LOQ), with an RSD of 3.2%. The high mean spiked recovery rate (100.8 and 98.8%) achieved for instrumental and digestion precision analysis in this study confirms the reliability and reproducibility of the method used for determining Al concentrations in milk samples. A comparison of the current findings with previously published studies indicates that the LOD and LOQ for Al in milk and dairy products range from 1.2 to 500 and 4.0 to 1000 µg/l or µg/kg, respectively [<a href=\"#r-16\">16-18</a>], which are higher than those observed in our study. This suggests that the method employed in our study demonstrates a higher precision. The variations in LOD and LOQ values across different studies may be due to the instrumentation and conditions of the analysis. The average Al concentrations in 30 milk samples analyzed in the present study is 0.31 mg/kg. Several studies have reported Al concentrations in milk using ICP-MS. These studies reveal Al concentrations in cow's milk from China, Egypt, Italy, and Turkey, ranging from 0.00293 to 0.493 mg/kg [<a href=\"#r-16\">16-19</a>].</p>\r\n\r\n<p>Additionally, a recent systematic review [<a href=\"#r-20\">20</a>] of studies published between 1993 and 2021 indicates that Al concentrations in pasteurized and sterilized milk from China, Egypt, Pakistan, Spain, and Turkey as determined by ICP-MS, range from 0.06 to 3.35 mg/kg. Our study demonstrates that the DAI for the tested milk samples ranges from 0.002 to 0.003 mg/kg body weight, contributing 1.37 to 2.12% of the PTWI. Based on the RfDo of 0.043 mg/kg/day, the calculated THQ value ranges from 0.047 to 0.070. Al contamination in milk and dairy products can originate from multiple sources. Studies demonstrate that Al may enter the milk supply through contaminated feeds and fodder consumed by lactating cows, as well as during the processing and storage stages through the use of metal-based equipment [<a href=\"#r-21\">21,22</a>]. In Bangladesh, there are no available reports on the Al content in feeds, fodder, and milk before and after processing. However, due to the widespread use of Al-based cookware in everyday activities, there is significant potential for Al leaching from utensils at various stages of milk production and processing. This may account for the high percentage (43%) of Al-contaminated pasteurized and UHT milk samples observed.</p>\r\n\r\n<p>According to the Agency for Toxic Substances and Disease Registry (ATSDR) [<a href=\"#r-2\">2</a>], a minimal risk level (MRL) of 1 mg Al/kg/day is established for both chronic (≥365 days) and intermediate (15–364 days) durations of oral exposure to Al. The estimated DAI from our study indicates a lower level of Al intake through pasteurized and UHT milk. Although there is no permissible level of Al in pasteurized milk, the Food and Drug Administration (FDA) sets a limit of 0.2 mg/l for bottled water [<a href=\"#r-2\">2</a>]. The Egyptian Organization for Standards & Quality (EOSQ) reports a permissible level of 50 µg/l for Al, as cited by Amer <em>et al.</em> [<a href=\"#r-9\">19</a>]. In contrast, the Turkish Food Codex stipulates that the maximum allowable Al concentration in food products should not exceed 1500 µg/kg [<a href=\"#r-31\">31</a>]. The THQ value serves as an important metric for assessing the health risks linked to the intake of food contaminated with metals. This offers a measurable assessment of the possible non-carcinogenic impacts resulting from prolonged exposure to toxic substances, especially via dietary consumption. The findings of the current study revealed that a THQ value for Al in the milk samples analyzed is below 1, suggesting that the Al levels are within safe limits. Consequently, the concentrations of Al in these milk samples are unlikely to pose significant health risks to consumers. However, it is important to acknowledge the limitations associated with the relatively small sample size, which may affect the applicability of the results to a broader population.</p>"
},
{
"section_number": 5,
"section_title": "CONCLUSIONS",
"body": "<p>The present study represents the report on Al concentrations in commercially available pasteurized and UHT milk in Bangladesh. The findings indicate that 43% of the tested milk samples were Al contaminated. However, based on the estimated DAI and THQ values, these samples are deemed safe for consumption. Despite this, even low levels of Al in milk could pose potential health risks with long-term, high-volume consumption. Therefore, it is crucial to monitor the sources of Al in dairy food matrices and perform regular assessments using validated methods to ensure consumer safety.</p>"
},
{
"section_number": 6,
"section_title": "ACKNOWLEDGMENTS",
"body": "<p>The authors would like to thank the Research Management Wing of Bangabandhu Sheikh Mujibur Rahman Agricultural University (BSMRAU RMW-UGC Funded Project: ID 30, 2020-2023) for financial support and Mr. Sujan Kumar Das, Assistant Instrument Engineer (Electronics), Dr. M. A. Wazed Mia, Central Laboratory, BSMRAU for his technical support.</p>"
},
{
"section_number": 7,
"section_title": "AUTHOR CONTRIBUTIONS",
"body": "<p>MMR and SA were involved in the conception and design of the experiments. IJ and MUH contributed to performing the experiments. KMA and MMR analyzed data. KMA, IJ, and SA contributed to drafting the article. SAMH, ASMS, and MMR contributed to revising it critically for important intellectual content. All authors made the final approval of the version to be published.</p>"
},
{
"section_number": 8,
"section_title": "CONFLICTS OF INTEREST",
"body": "<p>There is no conflict of interest among the authors.</p>"
}
],
"figures": [
{
"figure": "https://jabet.bsmiab.org/media/article_images/2024/45/21/178-1728556935-Figure1.jpg",
"caption": "Figure 1. Calibration curve of Al using multi-element standard solution at six various concentrations (0, 1, 20, 100, 300, 500 µg/l).",
"featured": true
}
],
"authors": [
{
"id": 1565,
"affiliation": [
{
"affiliation": "Department of Dairy and Poultry Science, Bangabandhu Sheikh Mujibur Rahman Agricultural University, Gazipur-1706, Bangladesh"
},
{
"affiliation": "Department of Dairy and Poultry Science, Hajee Mohammad Danesh Science and Technology University, Dinajpur 5200, Bangladesh"
}
],
"first_name": "Ishrat",
"family_name": "Jahan",
"email": null,
"author_order": 1,
"ORCID": "https://orcid.org/0009-0000-7742-4467",
"corresponding": false,
"co_first_author": true,
"co_author": false,
"corresponding_author_info": "",
"article": 317
},
{
"id": 1566,
"affiliation": [
{
"affiliation": "Department of Dairy and Poultry Science, Bangabandhu Sheikh Mujibur Rahman Agricultural University, Gazipur-1706, Bangladesh"
},
{
"affiliation": "Department of Animal Production, Gono Bishwabidyalay, Dhaka-1344, Bangladesh"
}
],
"first_name": "Kazi Md.",
"family_name": "Al-Noman",
"email": null,
"author_order": 2,
"ORCID": "https://orcid.org/0000-0002-2001-6232",
"corresponding": false,
"co_first_author": true,
"co_author": false,
"corresponding_author_info": "",
"article": 317
},
{
"id": 1567,
"affiliation": [
{
"affiliation": "Department of Dairy and Poultry Science, Bangabandhu Sheikh Mujibur Rahman Agricultural University, Gazipur-1706, Bangladesh"
}
],
"first_name": "Shabbir",
"family_name": "Ahmed",
"email": null,
"author_order": 3,
"ORCID": "https://orcid.org/0000-0003-2209-3837",
"corresponding": false,
"co_first_author": false,
"co_author": false,
"corresponding_author_info": "",
"article": 317
},
{
"id": 1568,
"affiliation": [
{
"affiliation": "Department of Dairy and Poultry Science, Bangabandhu Sheikh Mujibur Rahman Agricultural University, Gazipur-1706, Bangladesh"
}
],
"first_name": "Mst. Umme",
"family_name": "Habiba",
"email": null,
"author_order": 4,
"ORCID": "https://orcid.org/0000-0002-7856-1831",
"corresponding": false,
"co_first_author": false,
"co_author": false,
"corresponding_author_info": "",
"article": 317
},
{
"id": 1569,
"affiliation": [
{
"affiliation": "Department of Animal Breeding and Genetics, Bangabandhu Sheikh Mujibur Rahman Agricultural University, Gazipur-1706, Bangladesh"
}
],
"first_name": "S. A. Masudul",
"family_name": "Hoque",
"email": null,
"author_order": 5,
"ORCID": "https://orcid.org/0000-0003-3537-5892",
"corresponding": false,
"co_first_author": false,
"co_author": false,
"corresponding_author_info": "",
"article": 317
},
{
"id": 1570,
"affiliation": [
{
"affiliation": "Department of Animal Science and Nutrition, Bangabandhu Sheikh Mujibur Rahman Agricultural University, Gazipur-1706, Bangladesh"
}
],
"first_name": "Abu Sadeque Md.",
"family_name": "Selim",
"email": null,
"author_order": 6,
"ORCID": "https://orcid.org/0000-0001-8457-4631",
"corresponding": false,
"co_first_author": false,
"co_author": false,
"corresponding_author_info": "",
"article": 317
},
{
"id": 1571,
"affiliation": [
{
"affiliation": "Department of Dairy and Poultry Science, Bangabandhu Sheikh Mujibur Rahman Agricultural University, Gazipur-1706, Bangladesh"
},
{
"affiliation": "Institute of Food Safety and Processing, Bangabandhu Sheikh Mujibur Rahman Agricultural University, Gazipur-1706, Bangladesh"
}
],
"first_name": "Md. Morshedur",
"family_name": "Rahman",
"email": "morshed@bsmrau.edu.bd",
"author_order": 7,
"ORCID": "https://orcid.org/0000-0002-6474-8902",
"corresponding": true,
"co_first_author": false,
"co_author": false,
"corresponding_author_info": "Md. Morshedur Rahman, PhD; Department of Dairy and Poultry Science, Bangabandhu Sheikh Mujibur Rahman Agricultural University, Salna, Gazipur-1706, Bangladesh. Email: morshed@bsmrau.edu.bd",
"article": 317
}
],
"views": 611,
"downloads": 95,
"references": [
{
"id": 13153,
"serial_number": 1,
"pmc": null,
"reference": "Rabinovich D. The allure of aluminium. Nature Chemistry. 2013; 5: 76.",
"DOI": null,
"article": 317
},
{
"id": 13154,
"serial_number": 2,
"pmc": null,
"reference": "ATSDR (2008). Toxicological profile for aluminum. Available at: https://www.atsdr.cdc.gov/toxprofiles/tp22.pdf (Accessed: 02 October 2024).",
"DOI": null,
"article": 317
},
{
"id": 13155,
"serial_number": 3,
"pmc": null,
"reference": "Klotz K, Weistenhöfer W, et al. The health effects of aluminum exposure. Deutsches Ärzteblatt International. 2017;114: 653.",
"DOI": null,
"article": 317
},
{
"id": 13156,
"serial_number": 4,
"pmc": null,
"reference": "Exley C. The toxicity of aluminium in humans. Morphologie. 2016; 329: 51-55.",
"DOI": null,
"article": 317
},
{
"id": 13157,
"serial_number": 5,
"pmc": null,
"reference": "Darbre PD, Mannello F, et al. Aluminium and breast cancer: Sources of exposure, tissue measurements and mechanisms of toxicological actions on breast biology. Journal of Inorganic Biochemistry. 2013; 128: 257-261.",
"DOI": null,
"article": 317
},
{
"id": 13158,
"serial_number": 6,
"pmc": null,
"reference": "Kawahara M and Kato-Negishi M. Link between aluminum and the pathogenesis of Alzheimer′ s disease: the integration of the aluminum and amyloid cascade hypotheses. International journal of Alzheimer’s disease. 2011; 2011: 276393.",
"DOI": null,
"article": 317
},
{
"id": 13159,
"serial_number": 7,
"pmc": null,
"reference": "Bonfiglio R, Scimeca M, et al. The impact of aluminum exposure on human health. Archives of Toxicology. 2023; 97: 2997-2998.",
"DOI": null,
"article": 317
},
{
"id": 13160,
"serial_number": 8,
"pmc": null,
"reference": "Shardlow E, Linhart C, et al. The measurement and full statistical analysis including Bayesian methods of the aluminium content of infant vaccines. Journal of Trace Elements in Medicine and Biology. 2021; 66: 126762.",
"DOI": null,
"article": 317
},
{
"id": 13161,
"serial_number": 9,
"pmc": null,
"reference": "FEHD (2009). Aluminium in food. Risk Assessment Studies, Report No.-35. Available at: https://www.cfs.gov.hk/english/programme/programme_rafs/files/RA35_Aluminium_in_Food_e.pdf (Accessed: 28 September 2024).",
"DOI": null,
"article": 317
},
{
"id": 13162,
"serial_number": 10,
"pmc": null,
"reference": "EUFIC (2021). Aluminium in food (Q&A): Sources, safety and regulations. Available at: https://www.eufic.org/en/food-safety/article/aluminium-qa (Accessed: 28 September 2024).",
"DOI": null,
"article": 317
},
{
"id": 13163,
"serial_number": 11,
"pmc": null,
"reference": "Dordevic D, Buchtova H, et al. Aluminum contamination of food during culinary preparation: Case study with aluminum foil and consumers’ preferences. Food Science & Nutrition. 2019; 7: 3349-3360.",
"DOI": null,
"article": 317
},
{
"id": 13164,
"serial_number": 12,
"pmc": null,
"reference": "ESDO (2020). A Report on Aluminum Cookware: A Major Source of Lead and other Toxic Metal Contamination in Bangladesh. Available at: https://esdo.org/report-on-aluminum-cookware-a-major-source-of-lead-and-other-toxic-metal-contamination-in-bangladesh/ (Accessed: 01 October 2024).",
"DOI": null,
"article": 317
},
{
"id": 13165,
"serial_number": 13,
"pmc": null,
"reference": "Licata P, Trombetta D, et al. Levels of “toxic” and “essential” metals in samples of bovine milk from various dairy farms in Calabria, Italy. Environment international. 2004; 30: 1-6.",
"DOI": null,
"article": 317
},
{
"id": 13166,
"serial_number": 14,
"pmc": null,
"reference": "González-Montaña JR, Senís E, et al. Cadmium and lead in bovine milk in the mining area of the Caudal River (Spain). Environmental monitoring and assessment. 2012; 184: 4029-4034.",
"DOI": null,
"article": 317
},
{
"id": 13167,
"serial_number": 15,
"pmc": null,
"reference": "González-Weller D, Gutiérrez AJ, et al. Dietary intake of aluminum in a Spanish population (Canary Islands). Journal of agricultural and food chemistry. 2010; 58: 10452-10457.",
"DOI": null,
"article": 317
},
{
"id": 13168,
"serial_number": 16,
"pmc": null,
"reference": "İslamoğlu F, Torul O, et al, Determination of some metal contents of cow’s milk in Akçabaat district of Trabzon by ICP-MS. Turkish Journal of Analytical Chemistry. 2020; 2.",
"DOI": null,
"article": 317
},
{
"id": 13169,
"serial_number": 17,
"pmc": null,
"reference": "Monteverde V, Camilleri G, et al. Heavy metal levels in milk and serum of dairy cows from different farms located near an industrial area. Animals. 2022; 12: 2574.",
"DOI": null,
"article": 317
},
{
"id": 13170,
"serial_number": 18,
"pmc": null,
"reference": "Chen L, Li X, et al. Analysis of 17 elements in cow, goat, buffalo, yak, and camel milk by inductively coupled plasma mass spectrometry (ICP-MS). RSC advances. 2020; 10: 6736-6742.",
"DOI": null,
"article": 317
},
{
"id": 13171,
"serial_number": 19,
"pmc": null,
"reference": "Amer AA, El-Makarem HS, et al. Lead, cadmium, and aluminum in raw bovine milk: Residue level, estimated intake, and fate during artisanal dairy manufacture. Journal of Advanced Veterinary and Animal Research. 2021;8: 454.",
"DOI": null,
"article": 317
},
{
"id": 13172,
"serial_number": 20,
"pmc": null,
"reference": "Alinezhad Z, Hashemi M, et al. Concentration of heavy metals in pasteurized and sterilized milk and health risk assessment across the globe: A systematic review. Plos one. 2024; 19: e0296649",
"DOI": null,
"article": 317
},
{
"id": 13173,
"serial_number": 21,
"pmc": null,
"reference": "Deeb AM and Gomaa GM. Detection of aluminium in some dairy products at Kafr-El-Sheikh, Egypt. Global Veterinaria. 2011; 6: 01-05.",
"DOI": null,
"article": 317
},
{
"id": 13174,
"serial_number": 22,
"pmc": null,
"reference": "Semwal AD, Padmashree A, et al. Leaching of aluminium from utensils during cooking of food. Journal of the Science of Food and Agriculture. 2006; 86: 2425-2430.",
"DOI": null,
"article": 317
},
{
"id": 13175,
"serial_number": 23,
"pmc": null,
"reference": "Al Juhaiman LA. Estimating Aluminum leaching from Aluminum cook wares in different meat extracts and milk. Journal of Saudi Chemical Society. 2010; 14: 131-137.",
"DOI": null,
"article": 317
},
{
"id": 13176,
"serial_number": 24,
"pmc": null,
"reference": "FAO/WHO (2012). Safety evaluation of certain food additives and contaminants. Available at: https://iris.who.int/bitstream/handle/10665/44521/9789241660648_eng.pdf?sequence=1 (Accessed: 24 September 2024).",
"DOI": null,
"article": 317
},
{
"id": 13177,
"serial_number": 25,
"pmc": null,
"reference": "European Food Safety Authority (EFSA). Safety of aluminium from dietary intake‐scientific opinion of the panel on food additives, flavourings, processing aids and food contact materials (AFC). EFSA Journal. 2008; 6: 754.",
"DOI": null,
"article": 317
},
{
"id": 13178,
"serial_number": 26,
"pmc": null,
"reference": "Kabir A, Khan K, et al. A study of heavy metal presence in cow milk of different dairy farms near Karnafuli paper mills, Chittagong, Bangladesh. American Journal of Engineering Research. 2017; 6: 329-333.",
"DOI": null,
"article": 317
},
{
"id": 13179,
"serial_number": 27,
"pmc": null,
"reference": "DLS (2024). Livestock Economy at a Glance. Available at: https://file-rajshahi.portal.gov.bd/uploads/0f236d9d-0a28-4fbd-b4d5-593734ed5892/670/9be/f6e/6709bef6e805f380007609.pdf (Accessed: 24 September 2024).",
"DOI": null,
"article": 317
},
{
"id": 13180,
"serial_number": 28,
"pmc": null,
"reference": "WHO (2010). Non-communicable disease risk factor survey Dhaka. Non-communicable disease risk factor survey Bangladesh 2010. Available at: https://cdn.who.int/media/docs/default-source/searo/bangladesh/pdf-reports/year-2007-2012/non-communicable-disease-risk-factor-survey-bangladesh-2010.pdf?sfvrsn=37e45e81_2 (Accessed: 27 September 2024).",
"DOI": null,
"article": 317
},
{
"id": 13181,
"serial_number": 29,
"pmc": null,
"reference": "Soares S, Moraes LM, et al. Sample preparation and spectrometric methods for elemental analysis of milk and dairy products–A review. Journal of Food Composition and Analysis. 2023; 115: 104942.",
"DOI": null,
"article": 317
},
{
"id": 13182,
"serial_number": 30,
"pmc": null,
"reference": "Thakur D, Dubey NP, Neeti Prakash Dubey, and Rajvinder Singh. A review on spike and recovery method in analytical method development and validation. Critical Reviews in Analytical Chemistry. 2022; 1-19.",
"DOI": null,
"article": 317
},
{
"id": 13183,
"serial_number": 31,
"pmc": null,
"reference": "Amer AA. Aluminum in artisanal dairy products: occurrence, residues level, estimated intake and target hazard quotient. 2019; 55-60.",
"DOI": null,
"article": 317
}
]
},
{
"id": 316,
"slug": "178-1715929158-cloning-expression-and-purification-of-fusion-antigens-mpt83-and-esat6-from-the-local-strain-of-mycobacterium-tuberculosis-in-escherichia-coli-as-a-seed-vaccine-candidate-against-tuberculosis",
"featured": false,
"slider": false,
"issue": "Vol8 Issue1",
"type": "original_article",
"manuscript_id": "178-1715929158",
"recieved": "2024-05-17",
"revised": null,
"accepted": "2024-11-06",
"published": "2024-12-13",
"pdf_file": "https://jabet.bsmiab.org/media/pdf_file/2024/11/178-1715929158.pdf",
"title": "Cloning, expression, and purification of fusion antigens MPT83 and ESAT6 from the local strain of <span>Mycobacterium tuberculosis</span> in <span>Escherichia coli</span> as a seed vaccine candidate against tuberculosis",
"abstract": "<p>Eradicating tuberculosis (TB) globally is increasingly challenging with the growing number of drug-resistant <em>Mycobacterium tuberculosis</em> (<em>M. tuberculosis</em>) strains. The development of more potent TB vaccines is critical to complement overall TB control strategies and overcome the growing challenge of drug resistance. In this study, the recombinant plasmid pGEM-T Easy- Rv2873 + Rv3875 has been generated by inserting the Rv3875 gene, which encodes the ESAT6 protein, into the pGEM-T Easy- Rv2873 vector at the <em>BamH</em>I/<em>Hind</em>III cloning site. Following transformation into <em>E. coli</em> JM109, the plasmid was extracted, PCR amplified, and DNA sequencing. The existence of the appropriate recombinant Rv2873 + Rv3875 fusion genes was confirmed through the observation of a band of 948 base pairs in the colony PCR product containing fusion antigens. A band measuring 3966 base pairs was observed in the recombinant plasmid pGEM-T Easy- Rv2873+Rv3875, supporting the presence of the desired fusion genes target. The fusion genes Rv2873+Rv3875 were cloned into the expression vector pTrcHisA. This resulted in the pTrcHisA Rv2873+Rv3875 recombinant fusion plasmid, which was subsequently introduced into the <em>E. coli</em> BL21 strain through transformation. The fusion protein, comprising the 6XHis tag, exhibited a molecular mass of around 28 kilo Dalton and was synthesized as an insoluble protein inside <em>E. coli </em>BL21. In conclusion, the purified recombinant fusion protein MPT83 and ESAT6 hold promise for TB diagnosis and show potential as vaccine candidates in the future.</p>",
"journal_reference": "J Adv Biotechnol Exp Ther. 2025; 8(1): 91-104",
"academic_editor": "Md. Masudur Rahman, PhD; Obihiro University, Japan",
"cite_info": "Cloning, expression, and purification of fusion antigens MPT83 and ESAT6 from the local strain of Mycobacterium tuberculosis in Escherichia coli as a seed vaccine candidate against tuberculosis. J Adv Biotechnol Exp Ther. 2025; 8(1): 91-104",
"keywords": [
"Vaccine",
"Cloning",
"MPT83 plus ESAT6",
"Tuberculosis"
],
"DOI": "10.5455/jabet.2025.08",
"sections": [
{
"section_number": 1,
"section_title": "INTRODUCTION",
"body": "<p>Tuberculosis (TB) is an infectious disease caused by <em>M. tuberculosis</em> that can affect multiple organs of the body. It mostly attacks the lungs, termed pulmonary TB, and can spread to other organs, also known as extrapulmonary TB. People with pulmonary TB can infect others by coughing up the bacterium [<a href=\"#r-1\">1</a>]. <em>M. tuberculosis</em> is resistant to acidity due to the high lipid content of its cell membrane [<a href=\"#r-2\">2</a>, <a href=\"#r-3\">3</a>]. Additionally, susceptibility to ultraviolet (UV) light and radiation allows the bacteria to spread more easily at night [<a href=\"#r-4\">4-6</a>].</p>\r\n\r\n<p>About 10.6 million people fell ill with TB in 2022, with 1.3 million of them dying, including those with HIV [<a href=\"#r-1\">1</a>]. Indonesia contributes 10% of TB incidents globally, ranking second after India [<a href=\"#r-7\">7</a>]. The death toll in Indonesia due to TB reached more than 144,000, which is higher than in previous years [<a href=\"#r-8\">8</a>]. Eighty percent of Indonesia's TB patients are adults of employment age, which has devastating social and economic consequences [<a href=\"#r-8\">8</a>]. The conditions favor TB bacteria to thrive, contributing to the disease's widespread distribution. Coinfection of TB/HIV, which requires a complex combination of therapies and often causes drug-drug interaction, and the emergence of multidrug-resistant TB only adds fuel to the fire [<a href=\"#r-9\">9</a>]. To overcome this issue, developing cost-effective vaccines and rapid as well as rapid and accurate diagnostic technologies is essential. TB infection occurs when individuals inhale droplet nuclei carrying TB germs [<a href=\"#r-10\">10</a>], leading to four possible outcomes: a negative tuberculin skin test, active TB, latent TB, or reactivation of latent TB into active TB within months to years [<a href=\"#r-11\">11</a>].</p>\r\n\r\n<p>Diagnostic tests and immunizations based on MPT83 (Rv2873) and Rv3875 have potential [<a href=\"#r-12\">12,13</a>]. <em>M. tuberculosis</em> complex (MTC) species have these proteins. The <em>M. tuberculosis</em> Region of Difference 2 (RD2) region contains the Rv2873 gene and the Rv3875 gene, which codes for MPT83 and a 6-kilo Dalton secretory protein bearing the ESAT6 antigen, respectively. ESAT6 antigen has been reported specific to healthy and dividing cells and not found in most other mycobacterium types including <em>M. bovis</em> BCG. Several studies confirm that MPT83 and ESAT6 elicit a strong hypersensitivity reaction, and increase interferon release in TB patients, thus potentially enhancing the immune response against TB [<a href=\"#r-14\">14,15</a>]. Both MPT83 and ESAT6 antigens serve as virulence markers in <em>M. tuberculosis</em> strains. They have been found only in complex <em>M. tuberculosis</em> strains and could be used in T-cell-based TB vaccines and diagnostics [<a href=\"#r-16\">16-18</a>]. In addition, ESAT-6 has the ability to drive and stimulate protective immune responses, protecting against long-term chronic infections or post-exposure, and can induce immunity against <em>M. tuberculosis</em> pathogens, thus having great potential for use in TB vaccine development [<a href=\"#r-19\">19</a>]. Previous studies have shown that mice treated with MPT83 homologous monoclonal antibodies exhibited improved outcomes when infected with <em>M. tuberculosis</em> [<a href=\"#r-20\">20</a>]. Therefore, both these antigens are appropriate highly immunogenic TB seed vaccine candidates as well as for T-cell-based TB diagnostic tests.</p>\r\n\r\n<p>In this study, a fusion antigen protein made of the MPT83 and ESAT6 genes through recombinant DNA technology was developed. To produce the fusion antigen protein, we constructed the fusion plasmid pGEM-T Easy-Rv2873 plus Rv3875, by inserting the Rv3875 gene encoding the ESAT6 protein into the pGEM-T Easy-Rv2873 vector at the <em>BamH</em>I/<em>Hind</em>III cloning site [<a href=\"#r-21\">21</a>]. Subsequently, the fusion genes for Rv2873 and Rv3875 were subcloned into the <em>Nhe</em>I/<em>Hind</em>III cloning site of the expression vector pTrcHisA to create pTrcHisA-Rv2873 + Rv3875. Recombinant 6XHis-tagged fusion protein MPT83 plus ESAT6 was produced by expressing these genes in the <em>Escherichia coli</em> (<em>E. coli</em>) BL-21strain, making it a potential addition to improved TB vaccines. By successfully expressing this fusion protein as a seed vaccine candidate, we are at a promising initial stage in the development of an effective TB vaccine. This progress paves the way for further research to evaluate the ability of this fusion protein to stimulate a strong and protective immune response, thereby contributing significantly to global efforts to control and eliminate TB.</p>"
},
{
"section_number": 2,
"section_title": "MATERIALS AND METHODS",
"body": "<p><strong>Materials</strong></p>\r\n\r\n<p>JM109 and BL-21 <em>E. coli</em> cells were purchased from Promega, USA. pTrcHisA vector was purchased from Thermo Ficher Scientific. <em>BamH</em>I and <em>Hind</em>III restriction enzymes were purchased from NEB New England Biolabs. PCR kits with Master Mix GoTaq green were purchased from Promega, USA. Ni<sup>+2</sup>-NTA affinity chromatography was purchased from GoldBio St. Louis, Missouri. LB media, Ampicillin, IPTG, X-gal, imidazole, PBS buffer, and Tris-HCl were purchased from Sigma.</p>\r\n\r\n<p><strong> </strong></p>\r\n\r\n<p><strong>DNA of<em> M. tuberculosis</em> sample preparation</strong></p>\r\n\r\n<p><em>M. tuberculosis</em> isolate was obtained from the culture collection of Wahidin Sudirohusodo Hospital Makassar, Indonesia [<a href=\"#r-22\">22</a>]. Any procedure dealing with human subjects was conducted in compliance with ethical guidelines and had been approved by the Ethics Committee at the Faculty of Medicine Hasanuddin University, Makassar, Indonesia, with an ethics approval number. 24/UN4.6.4.5.31/PP36/2024. The DNA of <em>M. tuberculosis </em>was extracted using the method described previously [<a href=\"#r-22\">22</a>]. DNA extract was stored at -20 <sup>o</sup>C until used in PCR.</p>\r\n\r\n<p><strong> </strong></p>\r\n\r\n<p><strong>Primer design and Rv3875 gene amplification</strong></p>\r\n\r\n<p>Rv3875 gene of extracted <em>M. tuberculosis</em> DNA was amplified by PCR with Master Mix GoTaq green (Promega, USA, Cat No. M7122), and primers: Rv3875-F (5’-gcg<u>ggatcc</u> atgacagagcagcagtgg-3’) and Rv3875-R (5’-ccg<u>aagctt</u>ctatgcgaacatcccagtg -3’), which were designed to introduce <em>BamH</em>I restriction sites before the start codon and <em>Hind</em>III restriction sites after the end codon, respectively. Denaturation at 94 <sup>o</sup>C for 30 seconds, annealing at 55 <sup>o</sup>C for 30 seconds, and extension at 72 <sup>o</sup>C for 30 seconds was repeated 30 times after a 5-minute pre-denaturation at 90 <sup>o</sup>C. The longest period of extension occurred at 72 <sup>o</sup>C for seven minutes. The PCR result was then run electrophoresis on 1.0% agarose gel [<a href=\"#r-21\">21</a>, <a href=\"#r-22\">22</a>].</p>\r\n\r\n<p><strong> </strong></p>\r\n\r\n<p><strong>Purification of PCR products</strong></p>\r\n\r\n<p>The PCR products of the Rv3875 gene were purified using an ez-10 column in the Geneaid kit (Qiagen). Reagents for DNA binding, washing, and elusion were included in the kit, all of which were applied in the purification procedure. The main objective of PCR product purification was to acquire contaminant-free DNA fragments appropriate for ligation into the pGEM-T vector. The agarose gel was sliced and homogenized, and then the PCR findings were placed in Eppendorf tubes with around 50 microliters of PB buffer solution to begin the purification process. The supernatant was obtained by centrifuging the remaining mixture at 13,000 rotations per minute for two minutes at ambient temperature. Following the removal of the supernatant, a volume of 700 microliters of PEP washing buffer was introduced into the spin column. Afterward, the sample was spun at a speed of 13,000 rpm for two minutes as an additional wash step for the PCR products. In the last step, 35 microliters of Elution buffer were added to the spin column and centrifuged again to collect the eluate. Electrophoresis was performed on a 1% agarose gel to verify the high purity level.</p>\r\n\r\n<p><strong> </strong></p>\r\n\r\n<p><strong>ESAT6 protein-encoding Rv3875 gene ligation into pGEM-T easy-Rv2873 plasmid</strong></p>\r\n\r\n<p>After properly mixing 50 μL of <em>E. coli</em> JM109 competent cells with 10 μL of the ligation product that had been inserted Rv3875 gene, the final volume was 100 μL. To serve as positive control, we cultivated competent <em>E. coli</em> JM109 cells with and without antibiotics (ampicillin, 100 μg/mL). The ligation product and <em>E. coli</em> JM109 competent cells were placed in three separate tubes and stored at 4 <sup>o</sup>C for 30 minutes. The samples were then exposed to a heat shock at 42<sup>o</sup>C as described previously [<a href=\"#r-23\">23</a>]. After that, the culture tubes spent 3 hours in a shaker incubator set at 37 <sup>o</sup>C and 150 rotations per minute. The samples were centrifuged for two minutes at 13,000 rpm. The vacuum centrifuged ligation products reached 100 microliters. After adding 0.8 mg 5-bromo-4-chloro-3-indolyl β-D-galactopyranoside (X-gal), ampicillin (100 μg/mL), and Isopropyl β-D-1-thiogalactopyranoside (IPTG) (40 micromolar), the cells were grown at 37°C for 15-18 hours.</p>\r\n\r\n<p><strong> </strong></p>\r\n\r\n<p><strong>Sequencing of the recombinant plasmid pGEM-T Easy- Rv2873 +Rv3875</strong></p>\r\n\r\n<p>DNA sequencing was performed to validate the nucleotide sequence. Bigdye Terminator sequencing was utilized on ABI PRISM 310 Biosystem hardware on this recombinant plasmid, pGEM-T Easy- Rv2873 +Rv3875. The sequencing results were visualized and evaluated by using Bioedit v.7.0.10.</p>\r\n\r\n<p><strong> </strong></p>\r\n\r\n<p><strong>Expression of recombinant protein fusion of MPT83 and ESAT6</strong></p>\r\n\r\n<p>To make the recombinant plasmid pTrcHisA-Rv2873+Rv3875, the Rv2873 and Rv3875 genes were fused to produce a fusion protein and then introduced into the pTrcHisA expression vector [<a href=\"#r-24\">24</a>]. In order to produce recombinant fusion proteins consisting of MPT83 and ESAT6, the pTrcHisA-Rv2873+Rv3875 plasmid was introduced into <em>Escherichia coli</em> BL-21cells through transformation methods. The transformed cells were incubated overnight in a shaker incubator maintained at a temperature of 37 °C. After incubation, 4 mL of the bacterial recombinant culture was utilized as a sample without IPTG (MPT83 + ESAT6 non-induction, -IPTG), and the rest of the culture was diluted and added to fresh Luria-Bertani media. To reduce the amount of inclusion body proteins and maximize the production of MPT83 and ESAT6 proteins, 40 micromolars of IPTG was added to the final 5 mL of bacterial recombinant culture, and the mixture was incubated at 16 <sup>o</sup>C for 6-7 h until optical density (OD) of the cell cultures about 2.0-4.0.</p>\r\n\r\n<p>After incubation, the <em>E. coli</em> BL-21 cultured cells were harvested by 13,000 rpm centrifugation for five minutes at 4 °C. The pellet was next mixed with a nutrient-rich 1X phosphate-buffered saline (PBS) solution containing 1% Triton X-100 with pH 7.5. Sonication was performed intermittently for 30 seconds using a 20 kHz frequency to disrupt the bacterial cell walls, allowing for the release of biomolecules from the <em>E. coli</em> BL-21 strain cells into the clear liquid [<a href=\"#r-20\">20</a>]. To isolate this recombinant protein from the bacterial cellular debris, the material had to be centrifuged at 13,000 rpm for a minute while keeping the temperature at approximately 4°C.</p>\r\n\r\n<p>Protein expression was assessed through the utilization of 10% sodium dodecyl sulphate-polyacrylamide gel electrophoresis (SDS-PAGE) [<a href=\"#r-16\">16</a>, <a href=\"#r-25\">25</a>], employing the recombinant proteins MPT83 and ESAT6 as reference standards in comparison to a conventional protein ladder (Tiagen, Biotech Beijing).</p>\r\n\r\n<p><strong> </strong></p>\r\n\r\n<p><strong>Purification of recombinant protein fusion of MPT83 and ESAT6 </strong></p>\r\n\r\n<p>Recombinant protein fusion of MPT83 and ESAT6 was purified using nickel-nitrilotriacetic acid (Ni<sup>2+</sup>-NTA) affinity chromatography (GoldBio St. Louis, Missouri) with a His Tag-agarose matrix. Following column washing, this recombinant protein was eluted using elution buffer 0.5 M Tris-HCl buffer containing imidazole in varied concentrations (100-300 mM). SDS-PAGE gel electrophoresis was performed to evaluate the purified recombinant protein, which was then stained with Coomassie Brilliant Blue from Merck [<a href=\"#r-25\">25</a>].</p>"
},
{
"section_number": 3,
"section_title": "RESULTS",
"body": "<p><strong>Amplification of ESAT6-encoding Rv3875 gene </strong></p>\r\n\r\n<p>The amplification of the Rv3875 gene was successfully achieved and showed a band of 288 bp (<a href=\"#figure1\">Figure 1</a>A). The PCR product size matched that reported by GenBank (Access Number: KJ095583 for Gene ID: 886657), indicating that the Rv3875 gene, which includes the ATG start codon, is 288 bps in length and codes for the ESAT6 protein. In the absence of DNA, the negative PCR control showed no bands. DNA purification was successful because, as shown in <a href=\"#figure1\">Figure 1</a>B, agarose gel electrophoresis revealed the presence of a 288 bps DNA band free of dimers and dimerization products.</p>\r\n\r\n<div id=\"figure1\">\r\n<figure class=\"image\"><img alt=\"\" height=\"307\" src=\"/media/article_images/2024/50/19/178-1715929158-Figure1.jpg\" width=\"500\" />\r\n<figcaption><strong>Figure </strong><strong>1</strong><strong>. </strong>A) DNA amplification by polymerase chain reaction visualized on a 1% agarose gel, and B) Purification of PCR-amplified DNA encoding the ESAT6 protein from the Rv3875 gene using a Purification Kit (Qiagen).</figcaption>\r\n</figure>\r\n\r\n<p> </p>\r\n</div>\r\n\r\n<p><strong>Constructing the Rv3875 gene in the pGEM-T Easy-Rv2873 subcloning plasmid and transformation</strong></p>\r\n\r\n<p>In this study, the Rv3875 gene was cloned for further investigation and analysis. The pGEM-T Easy- Rv2873 +Rv3875 vector was constructed by inserting the target gene (gene of interest) into the pGEM-T Easy- Rv2873 cloning plasmid. We determined that the 660-bp long Rv2873 gene encodes the MPT83 protein and that the 288-bp long Rv3875 gene encodes the ESAT6 protein.</p>\r\n\r\n<p><em>E. coli</em> recombinant white colony transformation and screening results are shown in <a href=\"#figure2\">Figure 2</a>. As depicted in <a href=\"#figure2\">Figure 2</a>A, the absence of bacterial colonies was observed on Luria-Bertani agar plates when utilized as a negative control, specifically with competent <em>E. coli</em> JM109 cells lacking plasmids. This observation indicated no growth of <em>E. coli</em> JM109 cells without plasmids either autonomously or due to contamination. <a href=\"#figure2\">Figure 2</a>B shows the blue colony which carries the vector pGEM-T Easy as transformation control. The experimental procedure included the introduction of pGEM-T Easy- Rv2873 into <em>E. coli </em>JM109 competent cells are depicted in <a href=\"#figure2\">Figure 2</a>C. A collective sum of 396 bacterial colonies was seen on the Luria-Bertani plates. The utilization of the pGEM-T Easy- Rv2873 vector for transfection has yielded positive outcomes. The <em>E. coli</em> JM109 competent cells were subjected to transfection using the recombinant vector pGEM-T-Easy-Mpt83+Rv3875, as depicted in Figure 2D. A transformation effectiveness of 62.9% is inferred from the detection of 249 white bacterial colonies. Transformation of the recombinant plasmid encoding Rv3875 has been successful, as evidenced by the appearance of these white colonies.</p>\r\n\r\n<div id=\"figure2\">\r\n<figure class=\"image\"><img alt=\"\" height=\"139\" src=\"/media/article_images/2024/50/19/178-1715929158-Figure2.jpg\" width=\"500\" />\r\n<figcaption><strong>Figure 2</strong>. <em>E. coli</em> recombinant white colony transformation and screening (- control), there is no growth in plasmid-free competent cells of the <em>E. coli</em> strain JM109 (A). Blue colony, which harbors the vector pGEM-T Easy alone as control of transformation (B). Many white colonies, which harbor the vector pGEM-T Easy- Rv2873, were seen following the transformation of <em>E. coli</em> JM109 competent cells (C). The recombinant plasmid pGEM-T Easy- Rv2873 +Rv3875 is responsible for the proliferation of white colonies in <em>E. coli</em> cells (D).</figcaption>\r\n</figure>\r\n\r\n<p> </p>\r\n</div>\r\n\r\n<p><strong>Isolation and characterization of the recombinant plasmid pGEM-T Easy-Rv2873 +Rv3875</strong></p>\r\n\r\n<p>The recombinant vector pGEM-T Easy-Rv2873+Rv3875 exhibited DNA fragments of 288 bp (from Rv3875 gen alone) and 3678 bp (from the pGEM-T Easy- Rv2873) upon restriction with <em>BamH</em>I and <em>Hind</em>III enzymes, respectively (<a href=\"#figure3\">Figure 3</a>). The pGEM-T Easy- Rv2873 vector has a length of 3678 base pairs, while the Rv3875 gene that has been inserted into it has 288 base pairs in length. The construction of the recombinant vector, pGEM-T Easy- Rv2873+Rv3875, was achieved through the insertion of the DNA of the Rv3875 gene into the pGEM-T Easy- Rv2873 vector, as seen in <a href=\"#figure3\">Figure 3</a>.</p>\r\n\r\n<p>White <em>E. coli</em> colonies harboring the MPT83 and ESAT6 fusion protein-encoding Rv2873 and Rv3875 genes were identified using the PCR colony technique (Figure 2C). The PCR result showed a single DNA band of 1,371 bps. Insert DNA from white colonies harboring the Rv2873 and Rv3875 genes measures 948 bps (columns 1-2) in <a href=\"#figure4\">Figure 4</a>A. However, neither the Rv2873 nor the Rv3875 DNA inserts were found (<a href=\"#figure4\">Figure 4</a>A, column 3).</p>\r\n\r\n<p>Re-inoculation was conducted on a solid Luria-Bertani medium supplemented with 100 micrograms/mL of ampicillin subsequent to the identification of the converted white and isolated colony. Four colonies with white pigmentation were cultured in liquid Luria-Bertani media, supplemented with 100 micrograms/mL of ampicillin. The vectors were subsequently isolated from these colonies through the utilization of the QIAprep Spin Miniprep Kit manufactured by Qiagen, USA. The extraction resulted in the successful isolation of the recombinant vector pGEM-T Easy- Rv2873 +Rv3875, as confirmed by inspecting and displaying the electrophoresis results on a 1.5 % agarose gel (Figure 4B). Overall, the study demonstrated the successful isolation of the recombinant vector containing the Rv2873 and Rv3875 genes, which encode the MPT83 and ESAT6 fusion proteins, respectively, through the PCR colony method and subsequent vector extraction using the QIAprep Spin Miniprep Kit. The electrophoresis results confirmed the desired recombinant fusion plasmids in the three white colonies measure 948 bps (columns 1-3) in <a href=\"#figure4\">Figure 4</a>B.</p>\r\n\r\n<div id=\"figure3\">\r\n<figure class=\"image\"><img alt=\"\" height=\"782\" src=\"/media/article_images/2024/50/19/178-1715929158-Figure3.jpg\" width=\"500\" />\r\n<figcaption><strong>Figure 3.</strong> After running the Rv3875 gene via an agarose gel electrophoresis, the gene is ligated into the pGEM-T Easy- Rv2873 vector. Column 1: <em>BamH</em>I and <em>Hind</em>III enzymes can only cut the pGEM-T Easy- Rv2873 vector to produce one DNA band with size 3678 bps. Column 2: Two DNA bands of 3678 and 288 base pairs are produced from the <em>BamH</em>I / <em>Hind</em>III-restricted product of pGEM-T Easy- Rv2873 +Rv3875 vector/plasmid—specifically, 100 bps in Column M Genetic identifier.</figcaption>\r\n</figure>\r\n</div>\r\n\r\n<div id=\"figure4\">\r\n<figure class=\"image\"><img alt=\"\" height=\"304\" src=\"/media/article_images/2024/50/19/178-1715929158-Figure4.jpg\" width=\"500\" />\r\n<figcaption><strong>Figure 4.</strong><strong> </strong>(A) The PCR product of the fusion genes Rv2873 and Rv3875 codes for MPT83 and ESAT6 fusion proteins. Columns 1-2 show the PCR results for the white colonies from two independent clones, indicating that their PCR product had a length of 948 bps, whereas column 3 served as a negative control. Isolated white colonies were inoculated onto a PCR kit mix and subjected to the PCR procedure before being analyzed on an agarose gel electrophoresis device at 1.5 percent. (B) Mini-preparations of recombinant plasmid pGEM-T Easy-Rv2873 +Rv3875 (3966 bps in length) from three separate and independent white bacterial colonies on LB plate in Figure 2D.</figcaption>\r\n</figure>\r\n\r\n<p> </p>\r\n</div>\r\n\r\n<p><strong>Recombinant plasmid sequencing </strong></p>\r\n\r\n<p>As depicted in <a href=\"#figure5\">Figure 5</a>, the sequencing results showed conformity with the combined nucleotide sequences of the Rv2873 and Rv3875 genes encoding MPT83 and ESAT6 proteins, respectively. Combining these two genes produces a band of 948 bps, which begins with the start codon ATG and stop codon TGA. This sequence encodes 315 amino acids from the methionine (M) residue to the leucine (L). These sequencing results confirmed that fusion plasmid pGEM-T Easy- Rv2873 + Rv3875 was successfully created, which also provided crucial information regarding the encoded MPT83 and ESAT6 proteins.</p>\r\n\r\n<div id=\"figure5\">\r\n<figure class=\"image\"><img alt=\"\" height=\"733\" src=\"/media/article_images/2024/50/19/178-1715929158-Figure5.jpg\" width=\"500\" />\r\n<figcaption><strong>Figure 5</strong>. The predicted polynucleotide (cDNA) and amino acid (AA) sequences for the fusion proteins MPT83 and ESAT6 were encoded by the Rv2873 and Rv3875 genes, respectively.</figcaption>\r\n</figure>\r\n\r\n<p> </p>\r\n</div>\r\n\r\n<p><strong>Transformation and culture of <em>E. coli</em> Strain BL21(DE3) cells with pTrcHisA-Rv2873 +Rv3875 to generate fusion MPT83 Plus ESAT6 recombinant protein</strong></p>\r\n\r\n<p>Introducing the plasmid pTrcHisA-Rv2873 +Rv3875 into <em>E. coli</em> strain BL-21 cells yielded the results in <a href=\"#figure6\">Figure 6</a>A; the bacteria multiplied and formed white colonies on the Agar Luria-Bertani culture. Subcloning is complete when white colonies form, proving that the fusion genes Rv2873 and Rv3875, which code for the MPT83 and ESAT6 proteins, respectively, have been achieved through the insertion into the pTrcHisA vector. Errors in expression in the lacZ gene of the pTrcHisA vector generated the white coloration of the <em>E. coli</em> colonies.</p>\r\n\r\n<p>The <em>E. coli</em> strain BL-21 containing this recombinant fusion protein was then cultured in liquid LB medium with and without 40 micromolar IPTG induction for six hours (<a href=\"#figure6\">Figure 6</a>B), and then the pellets were collected. The results were then analyzed on SDS-PAGE, as shown in <a href=\"#figure6\">Figure 6</a>C. The cultivation of the cells with the pTrcHisA-Rv2873+Rv3875 plasmid by induction with 40 micromolar IPTG resulted in a significant protein band with molecular weight 28 kDa (<a href=\"#figure6\">Figure 6</a>C column 1 and 3), but not found in the absence of IPTG (<a href=\"#figure6\">Figure 6</a>C column 2 and 4). This result confirmed that MPT83 and ESAT6 are soluble proteins presented inside the cells. </p>\r\n\r\n<p><a href=\"#figure7\">Figure 7</a> shows the purified recombinant MPT83-ESAT6 fusion protein. <a href=\"#figure7\">Figure 7</a> (lanes 1-2) compares cells without and with IPTG, similar to<a href=\"#figure6\"> Figure 6</a>C. The next lanes show the success of purifying the MPT83 plus ESAT6 fusion protein, demonstrating a single protein band of 28 kDa of molecular weight.</p>\r\n\r\n<div id=\"figure6\">\r\n<figure class=\"image\"><img alt=\"\" height=\"192\" src=\"/media/article_images/2024/50/19/178-1715929158-Figure6.jpg\" width=\"500\" />\r\n<figcaption><strong>Figure 6. </strong>The recombinant plasmid pTrcHisA-Rv2873 +Rv3875 was introduced into the <em>E. coli</em> BL-21 strain. Subsequently, the transformed strain was evaluated on Luria-Bertani agar plates (A) and liquid culture media to express recombinant proteins with and without IPTG (B). Recombinant protein expression and growth of MPT83 plus ESAT6 in the absence and presence of 40 micromolar IPTG on SDS-PAGE analysis (C).</figcaption>\r\n</figure>\r\n</div>\r\n\r\n<div id=\"figure7\">\r\n<figure class=\"image\"><img alt=\"\" height=\"367\" src=\"/media/article_images/2024/50/19/178-1715929158-Figure7.jpg\" width=\"500\" />\r\n<figcaption><strong>Figure 7</strong>. Expression, purification, and SDS-PAGE (10%) analysis of purified recombinant MPT83 plus ESAT6 fusion proteins. It was possible to separate and purify 6XHis-tagged MPT83 and ESAT6 using affinity chromatography with a His Tag-agarose matrix. Proteins were isolated from cell lysates and various chromatographic fractions by electrophoresis in a 10% SDS-PAGE. The proteins could be seen thanks to CBB staining. Molecular weight proteins marker (M), induced whole cell lysates (Lane 1), un-induced whole cell lysates (Lane 2), wash flowthrough (Lane 3), flowthrough of elution with 0.5 M Tris-HCl buffer with 100 mM imidazole pH 7.3 (Lane 4), 200 mM imidazole pH 5.9 (Lane 5), and 300 mM imidazole pH 4.5 (Lane 6), MPT83 plus ESAT6 fusion proteins bands at 28 kDa are shown.</figcaption>\r\n</figure>\r\n</div>"
},
{
"section_number": 4,
"section_title": "DISCUSSION",
"body": "<p>In this study, we produced MPT83 and ESAT6 fusion antigen proteins by cloning the Rv3875 gene encoding the ESAT6 protein into the previously created pGEM-T Easy-Rv2873 vector [<a href=\"#r-21\">21</a>] to produce the pGEM-T Easy- Rv2873 + Rv3875 fusion plasmid. Similar to previous research, we determined that the 660-bp long Rv2873 gene encodes the MPT83 protein [<a href=\"#r-14\">14</a>] and the 288-bp long Rv3875 gene encodes the ESAT6 protein. Overhanging bases (T) can be found at both ends of the linear pGEM-T Easy- Rv2873 vector, facilitating a more efficient PCR product ligation procedure by preventing self-ligation at the target insertion site with T-overhangs (X). To enhance the ligation process, a larger ratio of inserts to vectors—three to one—was employed. At thirty degrees Celsius, T4 DNA ligase is at its most active.</p>\r\n\r\n<p>The Rv3875 gene ligation product and the pGEM-T Easy-Rv2873 cloning vector were then transformed into <em>E. coli</em> JM109 competent cells and the subsequent blue-white screening were selected because it has the ampicillin resistance (Amp<sup>r</sup>) site and the lacZ gene, as reported in previous studies [<a href=\"#r-24\">24</a>, <a href=\"#r-26\">26</a>]. To introduce recombinant DNA into <em>E. coli</em> cells, scientists used a thermal shock technique that briefly opened the cell membrane [<a href=\"#r-26\">26</a>]. The rapid inflation and deflation of the cell wall brought about by the alternating cold and hot shocks allowed outside plasmid DNA to pass through the cell wall and enter the cell.</p>\r\n\r\n<p>During the transformation and screening process of <em>E. coli</em> recombinants, different outcomes were observed for the transformed cells. Competent cells of <em>E. coli</em> strain JM109 that did not carry the plasmid could not grow. As a null hypothesis, this finding verifies that the presence of the altered plasmids is responsible for the growth seen in the other samples. <em>E. coli</em> JM109 containing the pGEM-T Easy plasmid without genes were grown with blue colony (Figure 2B). Whereas the presence of white colonies harboring the vector pGEM-T Easy- Rv2873 (<a href=\"#figure2\">Figure 2</a>C) and pGEM-T Easy-Rv2873+Rv3875 recombinant plasmid (<a href=\"#figure2\">Figure 2</a>D) was confirmed. The white colonies demonstrated that the corresponding vector had successfully transformed and was present in the <em>E. coli</em> JM 109 competent cells. These findings support the successful cloning and transformation of the pGEM-T Easy- Rv2873 vector and the recombinant plasmid pGEM-T Easy-Rv2873 +Rv3875 into <em>E. coli</em> JM109 competent cells.</p>\r\n\r\n<p>Blue-white screening identified bacterial cells that successfully contained recombinant plasmids with gene inserts. The lacZ gene in the pGEM-T Easy vector allows blue-white screening to identify successful cloning of the RV2873 and Rv3875 fusion target genes. Transcription of the lacZ gene is initiated by IPTG [<a href=\"#r-27\">27</a>]. LacZ encodes the enzyme β-galactosidase, breaking lactose into sugar components such as glucose and galactose. Blue bacterial colonies are formed when the enzyme β-galactosidase is present, which breaks down X-gal into galactose and 5-bromo-4-chloro-3-hydroxyindole, which produces a blue color. When blue colonies appear, the β-galactosidase enzyme works, meaning the lacZ gene is activated, thus indicating that DNA insertion into the vector has not occurred. In contrast, when Rv2873 and Rv3875 DNA were inserted into the multi-cloning site (MCS) vector, the lacZ gene was disrupted in the recombinant vector, preventing hydrolysis of the galactose substrate in the growth medium and causing the colonies to remain white. White bacterial colonies form when cells lack the enzyme β-galactosidase. Blue-white screening effectively identified successful transformants after cloning and transfecting the pGEM-T Easy-Rv2873 vector and the pGEM-T Easy-Rv2873 +Rv3875 recombinant plasmid into <em>E. coli</em> JM109 competent cells.</p>\r\n\r\n<p>The construction of the recombinant vector, pGEM-T Easy- Rv2873+Rv3875, was achieved through the insertion of the DNA of the Rv3875 gene into the pGEM-T Easy- Rv2873 vector. The recombinant vector pGEM-T Easy-Rv2873+Rv3875 exhibited DNA fragments of 288 bp (from Rv3875 gen alone) and 3678 bp (from the pGEM-T Easy- Rv2873) upon double restriction with <em>BamH</em>I and <em>Hind</em>III enzymes. PCR colony technique and sequencing analysis also confirmed Rv2873 and Rv3875 genes insertion into pGEM-T Easy on the correct site and position in the cloning vector.</p>\r\n\r\n<p>In this study, recombinant proteins MPT83 and ESAT6 were successfully produced in the <em>E. coli</em> BL-21 strain, forming white colonies. White colonies containing this recombinant fusion protein product were observed after <em>E. coli</em> B-L21 cells were transformed with the pTrcHisA-Rv2873+Rv3875 and cultured. The growth and synthesis of the recombinant protein were demonstrated by the visual change in the Luria-Bertani liquid medium from transparent to cloudy, which confirmed the success of the recombinant protein synthesis [<a href=\"#r-19\">19</a>].</p>\r\n\r\n<p>Cell walls, including cell membranes, can be efficiently disrupted by sonication. Biomolecules such as proteins, lipids (fats), and monosaccharides are released from the <em>E. coli</em> BL-21 strain cells during sonication and enter the clear liquid outside the cells. The presence of these biomolecules in the liquid would raise the fluid viscosity. Overall, the sonication process was employed to disrupt the bacterial cell walls and cell membranes, leading to the release of biomolecules from the <em>E. coli</em> BL-21 strain cells into the clear liquid [<a href=\"#r-28\">28</a>]. This step is crucial for obtaining the desired proteins, MPT83 and ESAT6.</p>\r\n\r\n<p>The use of IPTG as an inducer significantly enhances recombinant protein expression. In previous studies, the induction of recombinant proteins was found to be highly dependent on cell growth when inducers like IPTG were used. Higher IPTG concentrations could lead to increased recombinant protein production, but excessively high inducer concentrations could harm cell viability [<a href=\"#r-30\">30</a>]. Another study reported that lesser doses of IPTG were preferable at high temperatures. The inducible expression of recombinant proteins and other target proteins in <em>E. coli </em>cells has led to IPTG's widespread use as an inducer in the scientific community [<a href=\"#r-31\">31</a>]. Our result demonstrated that MPT83 and ESAT6 are both soluble proteins found inside cells. The protein was found to be quite prevalent in the supernatants but at lower concentrations in the pellet cells. This result showed that the <em>E. coli</em> successfully created a 28-kilo Dalton recombinant protein composing 6XHis-tagged MPT83 and ESAT6.</p>\r\n\r\n<p>MPT83 has been demonstrated to elicit a significant and specific immunological response against <em>M. tuberculosis</em>. MPT83 could stimulate immune cells, including macrophages and dendritic cells, which in turn release cytokines like TNF-α and IFN-γ to initiate the adaptive immune response. So far, research on MPT83 as a seed vaccine candidate has been tested in the form of an RNA or DNA vaccine in mouse models and showed a specific MPT83 CD8+ T cell response [<a href=\"#r-32\">32</a>]. Nonetheless, nucleic acid-based vaccines for TB have yet to be substantially examined, yet they may offer a framework for further vaccine design [<a href=\"#r-33\">33</a>]. Besides, MPT83 and ESAT6 incorporated in Vaccine subunit H107, along with six other antigens not found in the BGC strain, have also been developed and tested in mouse models [<a href=\"#r-34\">34</a>]. This vaccine's administration, along with BCG, enhances the adaptive response to <em>M. tuberculosis </em>infection, specifically in inducing a subset of under-differentiated CD4 Th1 cells that accumulate at the site of infection and persist post-Mtb challenge. Th1 with less differentiation may have a greater potential to develop memory T cells, which are essential for establishing sustained protection.</p>\r\n\r\n<p>The achievement of creating this recombinant fusion protein offers new avenues for investigation. The limitation of this study is that it is only at the stage of fusion protein expression, and no research has yet been conducted to study the antibody response to the produced fusion antigen, either <em>in vitro</em> or <em>in vivo</em>. Future studies may use antigens obtained from this recombinant fusion protein to create TB vaccines, including the antibody response. This could be a promising direction for advancing TB vaccine research and development.</p>"
},
{
"section_number": 5,
"section_title": "CONCLUSIONS",
"body": "<p>The PCR successfully amplified DNA bands from the genomic DNA of <em>M. tuberculosis</em>' Rv2873 and Rv3875 genes, which codes for the MPT83 plus ESAT6 fusion protein. These DNA fragments measured 948 bps in length and comprised the entire coding sequence for the MPT83 plus ESAT6 fusion protein down to its stop codon, TGA. Insertion of the Rv3875 gene, which codes for the ESAT6 protein, into the pGEM-T Easy Mpt83 plasmid yielded the pGEM-T Easy- Rv2873 +Rv3875 vector. As a result, the ESAT6 protein became fused with the MPT83 protein. Successful subcloning of the pGEM-T Easy- Rv2873 +Rv3875 plasmid into the pTrcHisA vector was achieved by employing nucleotide and amino acid sequence predictions of the 6XHis-tagged MPT83 plus ESAT6 recombinant proteins. <em>E. coli</em> BL-21 strain cells produced a 28-kilo Dalton fusion protein. The 28-kilo Dalton fusion protein was successfully produced in <em>E. coli</em> cells following amplification of the Rv2873 and Rv3875 genes from <em>M. tuberculosis</em>, construction of the pGEM-T Easy- Rv2873+Rv3875 vector, and subcloning of the fusion protein into the pTrcHisA vector. This study may advance our knowledge of MPT83 and ESAT6 fusion proteins, opening up their potential applications in future research, notably in vaccine development or other diagnostics and therapeutic approaches.</p>"
},
{
"section_number": 6,
"section_title": "ACKNOWLEDGEMENTS",
"body": "<p>The authors would like to thank Mrs. Ermawati and Nadia from Hasanuddin University Biochemistry Laboratory for their technical help and TRG Biovax Tuberculosis for partially supporting this research. This study partially received funding from Fundamental Collaboration Research (PFK) from Hasanuddin University (Grant number 00309/UN4.22/PT.01.03/2024).</p>"
},
{
"section_number": 7,
"section_title": "AUTHOR CONTRIBUTIONS",
"body": "<p>RBL, AA, AK, RA, RA, and NH collaborated to conduct practical research and laboratory techniques, gather and analyze data, and draft and edit the manuscript. MNM, AN, HK, and IH<strong><sup> </sup></strong>contributed to the critical reviewing and proofreading of this manuscript. All the authors have reviewed and approved the final version of the paper.</p>"
},
{
"section_number": 8,
"section_title": "CONFLICTS OF INTEREST",
"body": "<p>There is no conflict of interest among the authors.</p>"
}
],
"figures": [
{
"figure": "https://jabet.bsmiab.org/media/article_images/2024/50/19/178-1715929158-Figure1.jpg",
"caption": "Figure 1. A) DNA amplification by polymerase chain reaction visualized on a 1% agarose gel, and B) Purification of PCR-amplified DNA encoding the ESAT6 protein from the Rv3875 gene using a Purification Kit (Qiagen).",
"featured": false
},
{
"figure": "https://jabet.bsmiab.org/media/article_images/2024/50/19/178-1715929158-Figure2.jpg",
"caption": "Figure 2. E. coli recombinant white colony transformation and screening (- control), there is no growth in plasmid-free competent cells of the E. coli strain JM109 (A). Blue colony, which harbors the vector pGEM-T Easy alone as control of transformation (B). Many white colonies, which harbor the vector pGEM-T Easy- Rv2873, were seen following the transformation of E. coli JM109 competent cells (C). The recombinant plasmid pGEM-T Easy- Rv2873 +Rv3875 is responsible for the proliferation of white colonies in E. coli cells (D).",
"featured": false
},
{
"figure": "https://jabet.bsmiab.org/media/article_images/2024/50/19/178-1715929158-Figure3.jpg",
"caption": "Figure 3. After running the Rv3875 gene via an agarose gel electrophoresis, the gene is ligated into the pGEM-T Easy- Rv2873 vector. Column 1: BamHI and HindIII enzymes can only cut the pGEM-T Easy- Rv2873 vector to produce one DNA band with size 3678 bps. Column 2: Two DNA bands of 3678 and 288 base pairs are produced from the BamHI / HindIII-restricted product of pGEM-T Easy- Rv2873 +Rv3875 vector/plasmid—specifically, 100 bps in Column M Genetic identifier.",
"featured": false
},
{
"figure": "https://jabet.bsmiab.org/media/article_images/2024/50/19/178-1715929158-Figure4.jpg",
"caption": "Figure 4. (A) The PCR product of the fusion genes Rv2873 and Rv3875 codes for MPT83 and ESAT6 fusion proteins. Columns 1-2 show the PCR results for the white colonies from two independent clones, indicating that their PCR product had a length of 948 bps, whereas column 3 served as a negative control. Isolated white colonies were inoculated onto a PCR kit mix and subjected to the PCR procedure before being analyzed on an agarose gel electrophoresis device at 1.5 percent. (B) Mini-preparations of recombinant plasmid pGEM-T Easy-Rv2873 +Rv3875 (3966 bps in length) from three separate and independent white bacterial colonies on LB plate in Figure 2D.",
"featured": false
},
{
"figure": "https://jabet.bsmiab.org/media/article_images/2024/50/19/178-1715929158-Figure5.jpg",
"caption": "Figure 5. The predicted polynucleotide (cDNA) and amino acid (AA) sequences for the fusion proteins MPT83 and ESAT6 were encoded by the Rv2873 and Rv3875 genes, respectively.",
"featured": false
},
{
"figure": "https://jabet.bsmiab.org/media/article_images/2024/50/19/178-1715929158-Figure6.jpg",
"caption": "Figure 6. The recombinant plasmid pTrcHisA-Rv2873 +Rv3875 was introduced into the E. coli BL-21 strain. Subsequently, the transformed strain was evaluated on Luria-Bertani agar plates (A) and liquid culture media to express recombinant proteins with and without IPTG (B). Recombinant protein expression and growth of MPT83 plus ESAT6 in the absence and presence of 40 micromolar IPTG on SDS-PAGE analysis (C).",
"featured": false
},
{
"figure": "https://jabet.bsmiab.org/media/article_images/2024/50/19/178-1715929158-Figure7.jpg",
"caption": "Figure 7. Expression, purification, and SDS-PAGE (10%) analysis of purified recombinant MPT83 plus ESAT6 fusion proteins. It was possible to separate and purify 6XHis-tagged MPT83 and ESAT6 using affinity chromatography with a His Tag-agarose matrix. Proteins were isolated from cell lysates and various chromatographic fractions by electrophoresis in a 10% SDS-PAGE. The proteins could be seen thanks to CBB staining. Molecular weight proteins marker (M), induced whole cell lysates (Lane 1), un-induced whole cell lysates (Lane 2), wash flowthrough (Lane 3), flowthrough of elution with 0.5 M Tris-HCl buffer with 100 mM imidazole pH 7.3 (Lane 4), 200 mM imidazole pH 5.9 (Lane 5), and 300 mM imidazole pH 4.5 (Lane 6), MPT83 plus ESAT6 fusion proteins bands at 28 kDa are shown.",
"featured": true
}
],
"authors": [
{
"id": 1555,
"affiliation": [
{
"affiliation": "Medical Research Center, Faculty of Medicine, University of Hasanuddin, Makassar 90245, Indonesia"
},
{
"affiliation": "Department of Pharmacology, Faculty of Medicine, University of Hasanuddin, Makassar 90245, Indonesia"
}
],
"first_name": "Rusdina bte.",
"family_name": "Ladju",
"email": null,
"author_order": 1,
"ORCID": "http://orcid.org/0000-0001-5393-0429",
"corresponding": false,
"co_first_author": false,
"co_author": false,
"corresponding_author_info": "",
"article": 316
},
{
"id": 1556,
"affiliation": [
{
"affiliation": "Department of Chemistry, University of Hasanuddin, Makassar 90245, Indonesia"
},
{
"affiliation": "Puslitbang Biopolimer dan Bioproduk, Institute for Research and Community Services, University of Hasanuddin, Makassar 90245, Indonesia"
}
],
"first_name": "Ahyar",
"family_name": "Ahmad",
"email": "ahyarahmad@gmail.com",
"author_order": 2,
"ORCID": "http://orcid.org/0000-0002-0913-4721",
"corresponding": true,
"co_first_author": false,
"co_author": false,
"corresponding_author_info": "Ahyar Ahmad; Department of Chemistry, University of Hasanuddin, Makassar 90245, Indonesia. Email: ahyarahmad@gmail.com",
"article": 316
},
{
"id": 1557,
"affiliation": [
{
"affiliation": "Department of Chemistry, University of Hasanuddin, Makassar 90245, Indonesia"
}
],
"first_name": "Abdul",
"family_name": "Karim",
"email": null,
"author_order": 3,
"ORCID": "http://orcid.org/0000-0002-1428-5559",
"corresponding": false,
"co_first_author": false,
"co_author": false,
"corresponding_author_info": "",
"article": 316
},
{
"id": 1558,
"affiliation": [
{
"affiliation": "Department of Chemistry, University of Hasanuddin, Makassar 90245, Indonesia"
}
],
"first_name": "Rugaiyah",
"family_name": "Arfah",
"email": null,
"author_order": 4,
"ORCID": "http://orcid.org/0009-0009-4596-3349",
"corresponding": false,
"co_first_author": false,
"co_author": false,
"corresponding_author_info": "",
"article": 316
},
{
"id": 1559,
"affiliation": [
{
"affiliation": "Department of Biology, University of Hasanuddin, Makassar 90245, Indonesia"
}
],
"first_name": "Rosana",
"family_name": "Agus",
"email": null,
"author_order": 5,
"ORCID": "http://orcid.org/0000-0002-9418-4124",
"corresponding": false,
"co_first_author": false,
"co_author": false,
"corresponding_author_info": "",
"article": 316
},
{
"id": 1560,
"affiliation": [
{
"affiliation": "Institute for Research and Community Services, University of Hasanuddin, Makassar 90245, Indonesia"
}
],
"first_name": "Najdah",
"family_name": "Hidayah",
"email": null,
"author_order": 6,
"ORCID": "http://orcid.org/0000-0002-9811-2080",
"corresponding": false,
"co_first_author": false,
"co_author": false,
"corresponding_author_info": "",
"article": 316
},
{
"id": 1561,
"affiliation": [
{
"affiliation": "Institute for Research and Community Services, University of Hasanuddin, Makassar 90245, Indonesia"
},
{
"affiliation": "Department of Microbiology, University of Hasanuddin, Makassar 90245, Indonesia"
}
],
"first_name": "Muhammad Nasrum",
"family_name": "Massi",
"email": null,
"author_order": 7,
"ORCID": "http://orcid.org/0000-0002-3347-6529",
"corresponding": false,
"co_first_author": false,
"co_author": false,
"corresponding_author_info": "",
"article": 316
},
{
"id": 1562,
"affiliation": [
{
"affiliation": "Research Center for Vaccine and Drugs, National Research and Innovation Agency, Banten, 15314, Indonesia"
}
],
"first_name": "Astutiati",
"family_name": "Nurhasanah",
"email": null,
"author_order": 8,
"ORCID": "http://orcid.org/0000-0003-0912-6913",
"corresponding": false,
"co_first_author": false,
"co_author": false,
"corresponding_author_info": "",
"article": 316
},
{
"id": 1563,
"affiliation": [
{
"affiliation": "Department of Pharmacy, School of Pharmacy Yamasi, Makassar 90222, Indonesia"
}
],
"first_name": "Harningsih",
"family_name": "Karim",
"email": null,
"author_order": 9,
"ORCID": "http://orcid.org/0000-0002-1428-5559",
"corresponding": false,
"co_first_author": false,
"co_author": false,
"corresponding_author_info": "",
"article": 316
},
{
"id": 1564,
"affiliation": [
{
"affiliation": "Clinical Pathology Laboratory, RSWS Hospital, Makassar 90245, Indonesia"
}
],
"first_name": "Irda",
"family_name": "Handayani",
"email": null,
"author_order": 10,
"ORCID": "http://orcid.org/0000-0002-6164-717X",
"corresponding": false,
"co_first_author": false,
"co_author": false,
"corresponding_author_info": "",
"article": 316
}
],
"views": 600,
"downloads": 105,
"references": [
{
"id": 13119,
"serial_number": 1,
"pmc": null,
"reference": "WHO. Global tuberculosis report 2021 Geneva 2021.",
"DOI": null,
"article": 316
},
{
"id": 13120,
"serial_number": 2,
"pmc": null,
"reference": "Gordon SV, Parish T. Microbe profile: Mycobacterium tuberculosis: Humanity's deadly microbial foe. Microbiology. 2018;164:437-9.",
"DOI": null,
"article": 316
},
{
"id": 13121,
"serial_number": 3,
"pmc": null,
"reference": "Queiroz A, Riley L. Bacterial immunostat: Mycobacterium tuberculosis lipids and their role in the host immune response. Rev Soc Bras Med Trop 2017;50:9-18.",
"DOI": null,
"article": 316
},
{
"id": 13122,
"serial_number": 4,
"pmc": null,
"reference": "WHO. Who guidelines on tuberculosis infection prevention and control: 2019 update. Geneva: World Health Organization; 2019.",
"DOI": null,
"article": 316
},
{
"id": 13123,
"serial_number": 5,
"pmc": null,
"reference": "Nardell EA. Preventing transmission of Mycobacterium tuberculosis—a refocused approach. Clin Chest Med. 2019;40:857-69.",
"DOI": null,
"article": 316
},
{
"id": 13124,
"serial_number": 6,
"pmc": null,
"reference": "Kenedyanti E, Sulistyorini L. Analysis of Mycobacterium tuberculosis and physical condition of the house with incidence pulmonary tuberculosis. JBE. 2017;5:152-62.",
"DOI": null,
"article": 316
},
{
"id": 13125,
"serial_number": 7,
"pmc": null,
"reference": "Lestari T, Fuady A, et al. The development of the national tuberculosis research priority in Indonesia: A comprehensive mixed-method approach. PLoS ONE 2023; 18(2): e0281591.",
"DOI": null,
"article": 316
},
{
"id": 13126,
"serial_number": 8,
"pmc": null,
"reference": "Jiamsakul A, Lee MP, et al., Socio-economic status and risk of tuberculosis: a case-control study of HIV-infected patients in Asia. Int J Tuberc Lung Dis. 2018;22(2):179-186.",
"DOI": null,
"article": 316
},
{
"id": 13127,
"serial_number": 9,
"pmc": null,
"reference": "Sultana, et al. HIV infection and multidrug resistant tuberculosis: a systematic review and meta-analysis. BMC Infect Dis. 2021;21:51.",
"DOI": null,
"article": 316
},
{
"id": 13128,
"serial_number": 10,
"pmc": null,
"reference": "Torrelles JB, Schlesinger LS. Integrating Lung Physiology, Immunology, and Tuberculosis. Trends Microbiol. 2017;25(8):688-697.",
"DOI": null,
"article": 316
},
{
"id": 13129,
"serial_number": 11,
"pmc": null,
"reference": "Lewinsohn DM, Leonard MK, et al. Official American thoracic society/infectious diseases society of America/centers for disease control and prevention clinical practice guidelines: Diagnosis of tuberculosis in adults and children. Clin Infect Dis. 2017;64:111-5.",
"DOI": null,
"article": 316
},
{
"id": 13130,
"serial_number": 12,
"pmc": null,
"reference": "Sharma, R., Rajput, V.S. et al. An immunoinformatics approach to design a multi-epitope vaccine against Mycobacterium tuberculosis exploiting secreted exosome proteins. Sci Rep 2021;11, 13836.",
"DOI": null,
"article": 316
},
{
"id": 13131,
"serial_number": 13,
"pmc": null,
"reference": "Whitlow E, Mustafa AS, et al. An Overview of the Development of New Vaccines for Tuberculosis. Vaccines (Basel). 2020;8(4):586.",
"DOI": null,
"article": 316
},
{
"id": 13132,
"serial_number": 14,
"pmc": null,
"reference": "Zhuang L, Yang L, et al. Mycobacterium tuberculosis: immune response, biomarkers, and therapeutic intervention. MedComm 2020, 2024;5(1):e419.",
"DOI": null,
"article": 316
},
{
"id": 13133,
"serial_number": 15,
"pmc": null,
"reference": "Anes E, Pires D, et al. ESAT-6 a Major Virulence Factor of Mycobacterium tuberculosis. Biomolecules. 2023;13(6):968.",
"DOI": null,
"article": 316
},
{
"id": 13134,
"serial_number": 16,
"pmc": null,
"reference": "Yindeeyoungyeon W, Rukseree K, et al. Evaluation of recombinant Mycobacterium tuberculosis antigens MPT64, CFP10, and ESAT6 for delayed-type hypersensitivity responses in guinea pigs. AiM. 2015;5:586-98.",
"DOI": null,
"article": 316
},
{
"id": 13135,
"serial_number": 17,
"pmc": null,
"reference": "Wang L, Zuo M, et al. Mycobacterium tuberculosis lipoprotein MPT83 induces apoptosis of infected macrophages by activating the tlr2/p38/cox-2 signaling pathway. J Immunol 2017;198:4772-80.",
"DOI": null,
"article": 316
},
{
"id": 13136,
"serial_number": 18,
"pmc": null,
"reference": "Coppola M, van Meijgaarden KE, et al. New genome-wide algorithm identifies novel in-vivo expressed Mycobacterium tuberculosis antigens inducing human T-cell responses with classical and unconventional cytokine profiles. Sci Rep. 2016;6:37793.",
"DOI": null,
"article": 316
},
{
"id": 13137,
"serial_number": 19,
"pmc": null,
"reference": "Clemmensen HS, Knudsen NPH, et al. Rescuing ESAT-6 specific CD4 T cells from terminal differentiation is critical for long-term control of murine Mtb infection. Front Immunol. 2020;11:1-14.",
"DOI": null,
"article": 316
},
{
"id": 13138,
"serial_number": 20,
"pmc": null,
"reference": "Ma Z, Ji X, et al. Screening and evaluation of Mycobacterium tuberculosis diagnostic antigens. Eur J Clin Microbiol Infect Dis. 2020;39:1959-70.",
"DOI": null,
"article": 316
},
{
"id": 13139,
"serial_number": 21,
"pmc": null,
"reference": "Fu R, Wang C, et al. An improved whole-blood gamma interferon assay based on the CFP21-MPT64 fusion protein. Clin Vaccine Immunol. 2009;16:686-91.",
"DOI": null,
"article": 316
},
{
"id": 13140,
"serial_number": 22,
"pmc": null,
"reference": "Ahmad A, Agus R, et al. Cloning and expression of MPT83 gene from Mycobacterium tuberculosis in E. coli BL21 as vaccine candidate of tuberculosis: A preliminary study. J Genet Eng Biotechnol. 2018;16:335-40.",
"DOI": null,
"article": 316
},
{
"id": 13141,
"serial_number": 23,
"pmc": null,
"reference": "Uçkun Aa, et al. Efficiency of Escherichia coli JM109 and genetical engineering strains (E. coli MT2, E. coli MT3) in cadmium removal from aqueous solutions, Environmental Technology & Innovation, 2021; 24, 102024, https://doi.org/10.1016/j.eti.2021.102024.",
"DOI": null,
"article": 316
},
{
"id": 13142,
"serial_number": 24,
"pmc": null,
"reference": "Ahmad A, Agus R, et al. Cloning and expression of MPT83 plus PMT64 fusion protein from Mycobacterium tuberculosis in Escherichia coli BL21 (DE3) strain as seed vaccine candidate of tuberculosis. RASAYAN Journal of Chemistry. 2023;16:297-306.",
"DOI": null,
"article": 316
},
{
"id": 13143,
"serial_number": 25,
"pmc": null,
"reference": "Sambrook J, Russel DW. Molecular cloning: A laboratory manual. 3rd ed. Vols. 1–3. New York: Cold Spring Harbor Laboratory; 2001.",
"DOI": null,
"article": 316
},
{
"id": 13144,
"serial_number": 26,
"pmc": null,
"reference": "Abolliel AA, Zedan H. Synthesis, cloning and expression of a novel pre-miniproinsulin analogue gene in Escherichia coli. J Adv Res. 2015;6:663-71.",
"DOI": null,
"article": 316
},
{
"id": 13145,
"serial_number": 27,
"pmc": null,
"reference": "Murakami M, Murakami AM, et al. A dual prokaryotic (E. coli) expression system (pdmax). PLoS One. 2021;16:1-9.",
"DOI": null,
"article": 316
},
{
"id": 13146,
"serial_number": 28,
"pmc": null,
"reference": "Fakruddin M, Mohammad Mazumdar R, et al. Critical factors affecting the success of cloning, expression, and mass production of enzymes by recombinant E. coli. ISRN Biotechnol. 2013;2013:1-7.",
"DOI": null,
"article": 316
},
{
"id": 13147,
"serial_number": 29,
"pmc": null,
"reference": "Didovyk A, Tonooka T, et al. Rapid and scalable preparation of bacterial lysates for cell-free gene expression. ACS Synth Biol. 2017;6:2198-208.",
"DOI": null,
"article": 316
},
{
"id": 13148,
"serial_number": 30,
"pmc": null,
"reference": "Rosano GL, Morales ES, et al. New tools for recombinant protein production in Escherichia coli: A 5-year update. Protein Sci. 2019;28:1412-22.",
"DOI": null,
"article": 316
},
{
"id": 13149,
"serial_number": 31,
"pmc": null,
"reference": "Lozano Terol G, Gallego-Jara J, et al. Impact of the expression system on recombinant protein production in Escherichia coli BL21. Front Microbiol. 2021;12:1-12.",
"DOI": null,
"article": 316
},
{
"id": 13150,
"serial_number": 32,
"pmc": null,
"reference": "Woodworth, JS, Clemmensen, HS. et al. A Mycobacterium tuberculosis-specific subunit vaccine that provides synergistic immunity upon co-administration with Bacillus Calmette-Guérin. Nat Commun 2021; 12, 6658.",
"DOI": null,
"article": 316
},
{
"id": 13151,
"serial_number": 33,
"pmc": null,
"reference": "da Costa C, Benn C S. et al. Perspectives on development and advancement of new tuberculosis vaccines, International Journal of Infectious Diseases, 2024; 141, 106987.",
"DOI": null,
"article": 316
},
{
"id": 13152,
"serial_number": 34,
"pmc": null,
"reference": "Ning H, Zhang W, et al. Subunit Vaccine ESAT-6:c-di-AMP Delivered by Intranasal Route Elicits Immune Responses and Protects Against Mycobacterium tuberculosis Infection. Front Cell Infect Microbiol. 2021; 11:647220.",
"DOI": null,
"article": 316
}
]
},
{
"id": 315,
"slug": "178-1715984206-evaluation-of-adipocytokines-and-oxidative-stress-biomarkers-in-sera-of-hemodialysis-patients",
"featured": false,
"slider": false,
"issue": "Vol8 Issue1",
"type": "original_article",
"manuscript_id": "178-1715984206",
"recieved": "2024-05-17",
"revised": null,
"accepted": "2024-09-28",
"published": "2024-12-12",
"pdf_file": "https://jabet.bsmiab.org/media/pdf_file/2024/04/178-1715984206.pdf",
"title": "Evaluation of adipocytokines and oxidative stress biomarkers in sera of hemodialysis patients",
"abstract": "<p>Chronic renal failure is a condition characterized by the inability of the kidney to effectively eliminate toxins, solutes, and excess water, necessitating the use of hemodialysis. The current study aimed to evaluate adipocytokines and oxidative stress biomarkers in sera of hemodialysis patients. This study involved 60 hemodialysis patients, of whom 64% were female and 36% were male. Additionally, 40 healthy control volunteers participated in the study. Adipocytokines and oxidative stress markers were measured using the ELISA technique, whereas the spectrophotometric method measured lipid profile and renal function. The t-test, correlation, receiver operating characteristic, and logistic regression were used in the statistical analysis. Patients undergoing hemodialysis exhibited significant differences compared to healthy controls in serum concentrations of several parameters. Significantly higher levels of adiponectin (23.46 ng/mL), resistin (5.50 ng/mL), visfatin (47.0 ng/mL), and chemerin (169.0 ng/mL) were measured in patients undergoing hemodialysis as compared to healthy controls. Similarly, significantly higher levels of oxidative stress markers such as superoxide dismutase (3.78 U/mL), glutathione peroxidase (129.79 pg/mL), and malondialdehyde (4.66 mmol/L) were measured in patients undergoing hemodialysis as compared to healthy controls. In conclusion, adipocytokine parameters and oxidative stress markers have been found to be abnormal in hemodialysis patients and have an effect on atherosclerosis and heart failure progression.<strong> </strong></p>",
"journal_reference": "J Adv Biotechnol Exp Ther. 2025; 8(1): 79-90",
"academic_editor": "Md Jamal Uddin, PhD; ABEx Bio-Research Center, Dhaka, Bangladesh",
"cite_info": "Evaluation of adipocytokines and oxidative stress biomarkers in sera of hemodialysis patients. J Adv Biotechnol Exp Ther. 2025; 8(1): 79-90",
"keywords": [
"Oxidative Stress",
"cardiovascular disease",
"Hemodialysis",
"Adipocytokines"
],
"DOI": "10.5455/jabet.2025.07",
"sections": [
{
"section_number": 1,
"section_title": "INTRODUCTION",
"body": "<p>Most kidney disorders lead to a reduced glomerular filtration rate and elevated urea levels typically progress to chronic renal failure (CRF) [<a href=\"#r-1\">1</a>]. CRF is a condition considered by the inability of the kidney to effectively eliminate toxins, solutes, and excess water, necessitating the use of hemodialysis. A key characteristic of CRF is inflammation, a major contributor to mortality in dialysis patients. As a result of frequent dialysis treatments, patients with CRF tend to produce increased levels of cytokines, including interleukin-6 (IL-6) and tumor necrosis factor-alpha (TNF-α), which are associated with increased chronic inflammation and decreased leukocyte activation [<a href=\"#r-2\">2</a>] as well as affects the central nervous system and causes a loss of appetite due to the elevated release of pro-inflammatory cytokines, which disrupts hormone production associated to central regulation of appetite [<a href=\"#r-3\">3</a>].</p>\r\n\r\n<p>The inflamed dysfunctional kidneys result from the deficiency in several enzymes, including high-density lipoproteins (HDL) and Apo A1. The inflammation affects methionine synthase, impairing the clearance of homocysteine and leading to hyperhomocysteinemia and anaemia due to vitamin B12 deficiency [<a href=\"#r-4\">4</a>, <a href=\"#r-5\">5</a>]. Oxidative stress is linked directly or indirectly with renal diseases [<a href=\"#r-6\">6</a>]. Oxidative stress can arise through various mechanisms, including an excess of reactive oxygen species (ROS), which is a primary cause of liver disorders [<a href=\"#r-6\">6</a>]. Moreover, in diabetes, both type I and type II patients are prone to elevated levels of oxidative stress, which significantly contributes to disease pathogenesis due to a deficiency in antioxidant enzymes [<a href=\"#r-7\">7</a>]. Additionally, in other inflammatory autoimmune conditions, certain elements like copper (Cu) can exert pro-inflammatory effects, leading to increased oxidative stress [<a href=\"#r-8\">8</a>].</p>\r\n\r\n<p>Adipokines currently play a significant function in the biology of many different human organs. End-stage CRF is known to have a directly related and strong association with several variables like adipokines and adipose tissue contributing more than other biological components [<a href=\"#r-9\">9</a>].</p>\r\n\r\n<p>Although dialysis is unable to fully recover the lost functions of the kidneys, it still partially maintains the kidney [<a href=\"#r-10\">10</a>]. However, patients with CRF are often experiencing either continuous ambulatory peritoneal dialysis (CAPD) or hemodialysis (HD) [<a href=\"#r-11\">11</a>]. In HD-CRF, the risks of bleeding complications, infections, electrolyte imbalances, and cardiovascular dysfunction increase [<a href=\"#r-12\">12</a>]. These data show the importance of evaluating parameters like lipoproteins, adipocytokines, and oxidative stress, especially in CRF patients undergoing HD. Thus, the current study aims to evaluate adipocytokines and oxidative stress biomarkers in sera of hemodialysis patients.</p>"
},
{
"section_number": 2,
"section_title": "MATERIALS AND METHODS",
"body": "<p><strong>Subjects</strong></p>\r\n\r\n<p>The study involved 100 participants, who were divided only into two groups. Sixty participants were in the first group who suffered from CRF and were undergoing HD. At the same time, the control group included 40 healthy individuals of the same age and sex as the patients. Blood samples were collected in gel tubes and sodium citrate tubes, centrifuged, and then stored at –20°C. The study was approved by the University of Technology (UOT) Biological Research Ethical Committee, within the guidelines of the World Medical Association Declaration of Helsinki Ethical Principles (2013) requirements and given the number AS-AC 45038. All patients gave their informed consent to participate in the trial.</p>\r\n\r\n<p>The sample selection was based on the clinical diagnosis of CRF and patients having undergone HD for two years. The study was conducted at Al Karama Teaching Hospital between February 2023 and November 2023, and all patients were over the age of 18.</p>\r\n\r\n<p>Exclusion criteria included HD patients with durations of treatment either shorter or longer than two years, as well as individuals with a history of heart diseases, diabetes mellitus, chronic inflammatory disorders such as rheumatological diseases, and liver failure. Pregnant and lactating women were also excluded. Additionally, all patients participating in the trial were not taking any medication that could potentially interfere with the study results.</p>\r\n\r\n<p><strong> </strong></p>\r\n\r\n<p><strong>Analysis of lipid profile and renal function</strong></p>\r\n\r\n<p>The equipment utilized in this investigation was Roche Cobas e411 (Cobas Lipid Panel, Roche Diagnostics, Mannheim, Germany) for performing some laboratory tests, including total cholesterol (TC), triglycerides (TG), low-density lipoproteins (LDL), HDL, and very low-density lipoproteins (VLDL) as a lipid profile. In addition, renal function was determined by measuring urea and creatinine (Spinreact. Sant Esteve d'en Bas, Spain).</p>\r\n\r\n<p> </p>\r\n\r\n<p><strong>Analysis of adipocytokines and oxidative stress biomarkers</strong></p>\r\n\r\n<p>The adipocytokine profile and oxidative stress markers were measured by the sandwich ELISA method, adiponectin (Cat. No.: CAN-APN-5000; Diagnostics Biochem Canada Inc., Canada), Resistin (Cat. No.: ARG80885; Eagle Bioscience Inc., Canada), Visfatin (Cat. No.: EH482RB; Thermo Fisher Scientific Inc., USA), Chemerin (Cat. No.: KT-9860; Kamiya Biomedical Company, USA), Superoxide Dismutase (SOD) activity (Cat. No.: CS0009; Merck, Germany), Glutathione Peroxidase (GPx) (Cat. No.: MAK437; Merck, Germany), malondialdehyde (MDA) (Cat. No.: E-BC-K028-M; Elabscience, USA), which uses a purified antibody to capture antigen, increasing sensitivity and specificity.</p>\r\n\r\n<p><strong> </strong></p>\r\n\r\n<p><strong>Statistical analysis</strong></p>\r\n\r\n<p>The analysis of data was conducted using the Statistical Package for Social Sciences version 26.0 (SPSS v26). Mean± standard deviation (SD) or percentage used to display the results. Independent sample <em>t</em>-tests were utilized to compare the data. To determine the accuracy of adipocytokines between HD patients and the control group, we used the Receiver Operating Characteristic (ROC) analysis. Additionally, the Pearson rank correlation and logistic regression correlation tests have been applied. A statistically significant value was set at P < 0.05.<strong> </strong></p>"
},
{
"section_number": 3,
"section_title": "RESULTS",
"body": "<p><strong>Demographic characteristics </strong></p>\r\n\r\n<p><a href=\"#Table-1\">Table 1</a> illustrates the demographic characteristics of both patients with HD and healthy controls. There was a significant higher in BMI, TC, TG, LDL, urea, and creatinine in HD patients as compared to healthy controls (<a href=\"#Table-1\">Table 1</a>). However, there was a significant decrease in HDL in HD patients as compared to healthy controls (<a href=\"#Table-1\">Table 1</a>).</p>\r\n\r\n<p style=\"text-align:center\"><strong>Table 1</strong>. Demographic characteristics of patients with HD and controls.</p>\r\n\r\n<div id=\"Table-1\">\r\n<p style=\"text-align:center\"><a href=\"https://jabet.bsmiab.org/table/178-1715984206-table1/\">Table-1</a></p>\r\n</div>\r\n\r\n<p> </p>\r\n\r\n<p><strong>Levels of oxidative stress markers in HD patients</strong></p>\r\n\r\n<p>The level of oxidative stress markers between HD patients and controls is shown in <a href=\"#figure1\">Figure 1</a>. SOD concentrations in HD patients were significantly decreased. Interestingly, GPx and MDA concentrations were significantly elevated in HD patients as compared to healthy controls (<a href=\"#figure1\">Figure 1</a>).</p>\r\n\r\n<div id=\"figure1\">\r\n<figure class=\"image\"><img alt=\"\" height=\"490\" src=\"/media/article_images/2024/38/19/178-1715984206-Figure1.jpg\" width=\"500\" />\r\n<figcaption><strong>Figure 1</strong>. Serum oxidative stress parameters concentrations such as (A) levels of superoxide dismutase (SOD) in HD patients and controls, (B) levels of glutathione peroxidase (GPx) in HD patients and controls, and (C) levels of malondialdehyde (MDA) in HD patients and controls. S indicates P < 0.05.</figcaption>\r\n</figure>\r\n\r\n<p> </p>\r\n</div>\r\n\r\n<p><strong>Levels of adipocytokines in HD patients</strong></p>\r\n\r\n<p>The results of the adipocytokine profile (adiponectin, resistin, visfatin, and chemerin) between HD patients and controls are shown in <a href=\"#figure2\">Figure 2</a>. The concentrations of adiponectin, resistin, visfatin, and chemerin were significantly increased in HD patients as compared to healthy controls (<a href=\"#figure2\">Figure 2</a>).</p>\r\n\r\n<div id=\"figure2\">\r\n<figure class=\"image\"><img alt=\"\" height=\"477\" src=\"/media/article_images/2024/38/19/178-1715984206-Figure2.jpg\" width=\"500\" />\r\n<figcaption><strong>Figure 2</strong>. Serum adipocytokines profile concentrations such as (A) levels of adiponectin in HD patients and controls, (B) levels of resistin in HD patients and controls, (C) levels of visfatin in HD patients and controls, and (D) levels of chemerin in HD patients and controls. S indicates P < 0.05.</figcaption>\r\n</figure>\r\n</div>\r\n\r\n<p> </p>\r\n\r\n<p><strong>Diagnostic accuracy of adipocytokines profile in HD patients</strong></p>\r\n\r\n<p><a href=\"#Table-2\">Table 2</a> and <a href=\"#figure3\">Figure 3</a> show the receiver operating characteristic (ROC) analysis results of adiponectin, resistin, visfatin, and chemerin. The optimal cut‑off values for adiponectin, resistin, visfatin, and chemerin were 16.79 ng/mL, 2.60 ng/mL, 32.5 ng/mL, and 147.5 ng/mL, respectively (<a href=\"#Table-2\">Table 2</a> and <a href=\"#figure3\">Figure 3</a>).</p>\r\n\r\n<p style=\"text-align:center\"><strong>Table 2</strong>. ROC analysis of adipocytokines profile.</p>\r\n\r\n<div id=\"Table-2\">\r\n<p style=\"text-align:center\"> <a href=\"https://jabet.bsmiab.org/table/178-1715984206-table2/\">Table-2</a></p>\r\n</div>\r\n\r\n<div id=\"figure3\">\r\n<figure class=\"image\"><img alt=\"\" height=\"462\" src=\"/media/article_images/2024/38/19/178-1715984206-Figure3.jpg\" width=\"500\" />\r\n<figcaption><strong>Figure 3</strong>. ROC curve of adipocytokines profile for the calculation of possible diagnostic cut-off value (A) Adiponectin ROC curve with cut-off value > 16.79, (B) resistin ROC curve with a cut-off value > 2.60, (C) visfatin ROC curve with cut-off value > 32.5, and (D) Chemerin ROC curve with cut-off value > 147.50.Caption</figcaption>\r\n</figure>\r\n</div>\r\n\r\n<p> </p>\r\n\r\n<p><strong>Correlation between adipocytokines profile and other parameters</strong> <strong>in HD patients</strong></p>\r\n\r\n<p><a href=\"#Table-3\">Table 3</a> presents the correlations between the adipocytokine profile and other parameters in HD patients. The present results of resistin and HDL levels showed a significant negative correlation (r = -0.339, p = 0.009). Additionally, a significant positive correlation between visfatin and urea level (r = 0.279, p = 0.031) as well as between Chemerin and TC level (r = 0.303, p = 0.019) in HD patients, was found (<a href=\"#Table-3\">Table 3</a>). Conversely, all other factors examined did not show significant correlations with one another (<a href=\"#Table-3\">Table 3</a>).</p>\r\n\r\n<p style=\"text-align:center\"><strong>Table 3</strong>. Correlation between adipocytokines profile and other parameters.</p>\r\n\r\n<div id=\"Table-3\">\r\n<p style=\"text-align:center\"><a href=\"https://jabet.bsmiab.org/table/178-1715984206-table3/\">Table-3</a></p>\r\n</div>\r\n\r\n<p> </p>\r\n\r\n<p><strong>Logistic regression correlations between adipocytokines profile in HD patients</strong></p>\r\n\r\n<p><a href=\"#figure4\">Figure 4</a> illustrates the logistic regression model, highlighting that adipocytokines, particularly adiponectin, have a direct correlation with resistin in HD patients (<a href=\"#figure4\">Figure 4</a>). Additionally, adiponectin also showed direct correlations with both visfatin and chemerin among patients.</p>\r\n\r\n<div id=\"figure4\">\r\n<figure class=\"image\"><img alt=\"\" height=\"682\" src=\"/media/article_images/2024/38/19/178-1715984206-Figure4.jpg\" width=\"500\" />\r\n<figcaption><strong>Figure 4</strong>. Logistic regression correlations between adipocytokines profile. A) Correlation between adiponectin and resistin, B) correlation between adiponectin and visfatin, C) correlation between adiponectin and chemerin, D) correlation between resistin and chemerin, E) correlation between resistin and visfatin, and F) correlation between chemerin and visfatin.</figcaption>\r\n</figure>\r\n</div>"
},
{
"section_number": 4,
"section_title": "DISCUSSION",
"body": "<p>In the current study, oxidative stress biomarkers (SOD, GPx, and MDA), and adipocytokines (adiponectin, resistin, visfatin, and chemerin) had significantly changed in HD-CRF patients. The findings showed an elevated level of oxidative stress biomarkers (except SOD) and adipocytokines, alongside changes in the lipid profile and renal function, while SOD levels were found to be decreased. However, the selection of HD-CRF patients was only on two years HD was not excessively long nor short duration. This approach aimed to obtain data from individuals with the same population. Moreover, the duration of HD can affect various indicators, including oxidative stress and adipocytokines [<a href=\"#r-13\">13</a>, <a href=\"#r-14\">14</a>].</p>\r\n\r\n<p>Variations in cell surface receptor expression and receptor phenotypic abnormalities are frequently observed in CRF. These changes not only affect the bioavailability of the dialysis membranes but also contribute to an accumulation of uremic toxins and a reduction in the kidney's ability to remove harmful substances, which leads to an increase in the synthesis of cytokines, like TNF-a, alongside these receptor alterations [<a href=\"#r-1\">2</a>, <a href=\"#r-15\">15</a>].</p>\r\n\r\n<p>In addition to TNF-α receptors, adiponectin, which is secreted by adipose tissue and enhances CRF, shows a significant association with mortality in patients undergoing HD [<a href=\"#r-16\">16</a>]. Increased levels of TNF-α in individuals with heart failure and renal disease may contribute to pro-apoptotic processes and detrimental inotropic effects, potentially leading to cardiac damage. However, adiponectin levels have been linked to various biological mechanisms, including the regulation of pro- and anti-inflammatory cytokine production, improved insulin sensitivity in liver and skeletal muscle, reduction in atherogenic risk, and the maintenance of endothelial homeostasis [<a href=\"#r-17\">17</a>]. Our results are consistent with Małgorzewicz et al., suggesting that the increase in both resistin and adiponectin may be due to impaired waste removal and biodegradation from the circulatory system rather than excessive secretion [<a href=\"#r-18\">18</a>], and Ayerden et al. suggested that this contributes to the development of left ventricular hypertrophy, as elevated adiponectin levels seem to be associated with increased proinflammatory cytokines. [<a href=\"#r-19\">19</a>]. That is supported by the fact that people with CRF have a 10- to 30-fold increased risk of cardiovascular disease (CVD) [<a href=\"#r-20\">20</a>].</p>\r\n\r\n<p>The elevated resistin levels observed in HD patients may be a result of increased inflammatory cytokines, likely linked to impaired renal function [<a href=\"#r-21\">21</a>]. Elevation of serum resistin can cause cardiovascular mortality, where an incident of heart failure was correlated with higher resistin concentrations, especially in the end stages of renal diseases [<a href=\"#r-22\">22</a>], which makes resistin a potential target for atherosclerosis patients [<a href=\"#r-23\">23</a>]. However, there is evidence of a relation between raised resistin concentration and impaired glomerular filtration rate, suggesting that resistin might associated with HD patients with malnutrition [<a href=\"#r-24\">24</a>]. The upregulation of circulating resistin, along with low HDL levels often observed in CRF patients and reflected in our findings, may be linked to HDL's suppression of resistin production from adipocytes. This suppression promotes lipid production by hepatocytes and VLDL-ApoB formation. Reduced HDL levels could thus contribute to the atherosclerotic process [<a href=\"#r-25\">25</a>, <a href=\"#r-26\">26</a>].</p>\r\n\r\n<p>The findings show that visfatin levels are elevated in HD-CRF patients alongside increased urea concentrations. Considering the number of studies linking visfatin to metabolic diseases such as obesity, diabetes, and insulin resistance, there is potential that visfatin plays a pathophysiological role in these conditions, which could have therapeutic implications [<a href=\"#r-27\">27</a>]. Visfatin is a key factor in atherosclerosis’s early stages, particularly in endothelial dysfunction. This connection makes the formation of atherosclerotic plaques, and the inflammation associated with elevated visfatin levels conceivable [<a href=\"#r-28\">28</a>, <a href=\"#r-29\">29</a>].</p>\r\n\r\n<p>Based on chemerin's ability to regulate adipocyte gene expression, insulin resistance, regulation of immune response, and adipose maturation, it could be significantly contributing to nephropathy pathogenesis [<a href=\"#r-30\">30, 31</a>]. Chemerin accumulation in the blood may be induced by reduced renal catabolism or clearance of chemerin, which might be one explanation for the higher serum chemerin levels in CRF [<a href=\"#r-32\">32</a>]. Chemirin's function as a chemoattractant protein might make it play a role in the early stages of inflammation of adipose tissue by attracting macrophages into the tissue [<a href=\"#r-31\">31</a>], and it can also play a role in atherosclerosis and CVD development through the endothelial lipid deposition effect [<a href=\"#r-33\">33</a>].</p>\r\n\r\n<p>SOD levels in patients of HD-CRF were found to be significantly decreased in the current study compared to healthy controls. This finding may be related to the increased ROS in plasma and the red blood cells of CRF patients as a result of oxidative stress [<a href=\"#r-34\">34</a>]. However, previous studies have indicated that SOD enzyme activity is significantly decreased in CRF patients and CVD compared to those with CRF alone. This reduction may be due to an imbalance between antioxidant and oxidant enzymes, which, in both animal and human models, contribute to the progression and development of atherosclerotic disease [<a href=\"#r-35\">35</a>, <a href=\"#r-36\">36</a>]. In contrast to research [<a href=\"#r-37\">37</a>, <a href=\"#r-38\">38</a>] that found a substantial decrease in GPx activity in CRF, our investigation revealed elevated GPx levels. This increase may represent a defense mechanism for the cells against the excessive generation of free radicals related to CRF. Uremic problems and increased oxidative damage may be attributed to the reduction of antioxidant activity in red blood cells in patients with uremia undergoing CAPD [<a href=\"#r-39\">39</a>]. However, a comparison of GPx concentrations before and after HD showed that both pro- and antioxidant indicators improved after treatment, although they remained significantly different from those in the control group [<a href=\"#r-40\">40</a>, <a href=\"#r-41\">41</a>]. Compared to healthy controls, MDA concentrations in HD-CRF patients are elevated. MDA, which is generated from the polyunsaturated fatty acids peroxidation in conjunction with proteins, may exhibit atherogenic properties [<a href=\"#r-42\">42</a>]. The result agreed with Sreenivasulu et al. [<a href=\"#r-43\">43</a>] and Sridhar et al. [<a href=\"#r-44\">44</a>], who suggest that the results of oxidative stress from the excessive free radical production are present in the lipid components of cell membranes. Consequently, MDA serves as a valuable biomarker for lipid peroxidation in degenerative diseases such as CRF [<a href=\"#r-45\">45</a>]. As a key marker of CVD, oxidative stress may lead to apoptosis, necrosis, and ultimately thrombosis of atherosclerotic plaques. This occurs due to the action of certain ROS, such as O₂, which is converted into H₂O₂ with the help of SOD and GPx, affecting molecules that support endothelial function [<a href=\"#r-46\">46</a>].</p>\r\n\r\n<p>Adipocytokine levels have been associated with oxidative stress parameters in HD patients with various conditions. There was a relationship between plasma MDA and adiponectin levels in HD patients, according to Lim P. et al., who supported the claim that oxidative stress and adiponectin are associated with increased CVD and lipid metabolism in HD patients. Also, insulin resistance and chronic inflammation in diabetes-HD patients may cause adipocytokine dysregulation associated with augmented oxidative stress [<a href=\"#r-47\">47</a>]. That led to the suggestion that oxidative stress and adiponectin expression in adipose tissue may be targets for treatment approaches [<a href=\"#r-48\">48</a>]. However, our results appear to indicate that there is no significant correlation between adipocytokines and either the lipid profile or BMI, indicating that cardiovascular risk factors in patients with HD-CRF are unrelated to malnutrition. These findings are consistent with earlier research that found oxidative stress and the severity of chronic inflammation to be unrelated to BMI [<a href=\"#r-49\">49</a>].</p>\r\n\r\n<p>One of the main limitations of this study is that all patients who presented at the hospital were in the late stages of CRF and were already on hemodialysis, making it impossible to compare their pre- and post-HD status. Consequently, other tests could not be conducted, such as those for certain electrolytes, that could have provided comparisons between CRF patients before and after HD.</p>"
},
{
"section_number": 5,
"section_title": "CONCLUSIONS",
"body": "<p>The current research offers an overview of some adipocytokines and oxidative stress markers that contribute to the enhanced risk of heart diseases associated with CRF during HD. The majority of parameters that are abnormal in HD-CRF have an influence directly or indirectly on atherosclerosis and heart failure progression. These effects are explained by a rise in the production of proinflammatory cytokines associated with CVD, endothelial lipid deposition, or imbalances in certain antioxidant enzymes.</p>"
},
{
"section_number": 6,
"section_title": "ACKNOWLEDGEMENTS",
"body": "<p>None.</p>"
},
{
"section_number": 7,
"section_title": "AUTHOR CONTRIBUTIONS",
"body": "<p>SFO and MSH prepared overviews and composed the text. IAR data was analyzed with experiments carried out. MSH prepared the manuscript's first draft. SFO, IAR, and MSH reviewed the scientific material that was presented in the article. The final draft was examined and authorized by all authors before submission.</p>"
},
{
"section_number": 8,
"section_title": "CONFLICTS OF INTEREST",
"body": "<p>There is no conflict of interest among the authors.</p>"
}
],
"figures": [
{
"figure": "https://jabet.bsmiab.org/media/article_images/2024/38/19/178-1715984206-Figure1.jpg",
"caption": "Figure 1. Serum oxidative stress parameters concentrations such as (A) levels of superoxide dismutase (SOD) in HD patients and controls, (B) levels of glutathione peroxidase (GPx) in HD patients and controls, and (C) levels of malondialdehyde (MDA) in HD patients and controls. S indicates P < 0.05.",
"featured": true
},
{
"figure": "https://jabet.bsmiab.org/media/article_images/2024/38/19/178-1715984206-Figure2.jpg",
"caption": "Figure 2. Serum adipocytokines profile concentrations such as (A) levels of adiponectin in HD patients and controls, (B) levels of resistin in HD patients and controls, (C) levels of visfatin in HD patients and controls, and (D) levels of chemerin in HD patients and controls. S indicates P < 0.05.",
"featured": false
},
{
"figure": "https://jabet.bsmiab.org/media/article_images/2024/38/19/178-1715984206-Figure3.jpg",
"caption": "Figure 3. ROC curve of adipocytokines profile for the calculation of possible diagnostic cut-off value (A) Adiponectin ROC curve with cut-off value > 16.79, (B) resistin ROC curve with a cut-off value > 2.60, (C) visfatin ROC curve with cut-off value > 32.5, and (D) Chemerin ROC curve with cut-off value > 147.50.",
"featured": false
},
{
"figure": "https://jabet.bsmiab.org/media/article_images/2024/38/19/178-1715984206-Figure4.jpg",
"caption": "Figure 4. Logistic regression correlations between adipocytokines profile. A) Correlation between adiponectin and resistin, B) correlation between adiponectin and visfatin, C) correlation between adiponectin and chemerin, D) correlation between resistin and chemerin, E) correlation between resistin and visfatin, and F) correlation between chemerin and visfatin.",
"featured": false
}
],
"authors": [
{
"id": 1552,
"affiliation": [
{
"affiliation": "University of Baghdad, Department of Chemistry, College of Sciences, Baghdad, Iraq"
}
],
"first_name": "Shahad F.",
"family_name": "Obeid",
"email": null,
"author_order": 1,
"ORCID": "http://orcid.org/0000-0002-7180-4335",
"corresponding": false,
"co_first_author": false,
"co_author": false,
"corresponding_author_info": "",
"article": 315
},
{
"id": 1553,
"affiliation": [
{
"affiliation": "Mustansiriyah University, College of Basic Education, Baghdad, Iraq"
}
],
"first_name": "Israa Abass",
"family_name": "Rashed",
"email": null,
"author_order": 2,
"ORCID": "http://orcid.org/0009-0000-3767-5456",
"corresponding": false,
"co_first_author": false,
"co_author": false,
"corresponding_author_info": "",
"article": 315
},
{
"id": 1554,
"affiliation": [
{
"affiliation": "Department of Applied Sciences, University of Technology- Iraq, Baghdad, Iraq"
}
],
"first_name": "Mohammed S.",
"family_name": "Al-Hindawi",
"email": "Mohammed.S.AlHindawi@uotechnology.edu.iq",
"author_order": 3,
"ORCID": "http://orcid.org/0000-0003-1487-5943",
"corresponding": true,
"co_first_author": false,
"co_author": false,
"corresponding_author_info": "Mohammed S. Al-Hindawi, Department of Applied Sciences, University of Technology- Iraq, Baghdad, Iraq\r\nEmail: Mohammed.S.AlHindawi@uotechnology.edu.iq",
"article": 315
}
],
"views": 645,
"downloads": 96,
"references": [
{
"id": 13070,
"serial_number": 1,
"pmc": null,
"reference": "Chena C, Yangb L, et. al. Raman spectroscopy combined with multiple algorithms for analysis and rapid screening of chronic renal failure. Photodiagnosis and Photodynamic Therapy, 2020;30:101792",
"DOI": null,
"article": 315
},
{
"id": 13071,
"serial_number": 2,
"pmc": null,
"reference": "Tbahriti HF, Meknassi D, et al. Inflammatory status in chronic renal failure: The role of homocysteinemia and pro-inflammatory cytokines. World J Nephrol. 2013;2:31–7.",
"DOI": null,
"article": 315
},
{
"id": 13072,
"serial_number": 3,
"pmc": null,
"reference": "Barros AF, Moraes C, et al. Is there association between acyl-ghrelin and inflammation in hemodialysis patients? J Bras Nefrol. 2013;35:120–6.",
"DOI": null,
"article": 315
},
{
"id": 13073,
"serial_number": 4,
"pmc": null,
"reference": "Vaziri ND. Dyslipidemia of chronic renal failure: the nature, mechanisms, and potential consequences. Am J Physiol Renal Physiol. 2006; 290:262-72.",
"DOI": null,
"article": 315
},
{
"id": 13074,
"serial_number": 5,
"pmc": null,
"reference": "Weber GJ, Pushpakumar S, et al. Homocysteine and hydrogen sulfide in epigenetic, metabolic and microbiota related renovascular hypertension. Pharmacol Res. 2016;113:300-12.",
"DOI": null,
"article": 315
},
{
"id": 13075,
"serial_number": 6,
"pmc": null,
"reference": "Sikder B, Akter F, et al. HMG-CoA reductase inhibitor, rosuvastatin averted carbon tetrachloride-induced oxidative stress, inflammation and fibrosis in the liver of rats. J Adv Biotechnol Exp Ther. 2020; 3(1): 01-08.",
"DOI": null,
"article": 315
},
{
"id": 13076,
"serial_number": 7,
"pmc": null,
"reference": "Siddiqua S, Sikder B, et al. Ramipril, an angiotensin-converting enzyme inhibitor ameliorates oxidative stress, inflammation, and hepatic fibrosis in alloxan-induced diabetic rats. J Adv Biotechnol Exp Ther. 2022; 5(3): 510-522.",
"DOI": null,
"article": 315
},
{
"id": 13077,
"serial_number": 8,
"pmc": null,
"reference": "Al-Hindawi MS, Al-Gebori AM, et al. Copper-to-Zinc Ratio as an Inflammatory Marker in Serum of Iraqi Patients with Axial Spondyloarthritis. Revis Bionatura 2023;8 (2) 56.",
"DOI": null,
"article": 315
},
{
"id": 13078,
"serial_number": 9,
"pmc": null,
"reference": "Vahdat S. The complex effects of adipokines in the patients with kidney disease. J Res Med Sci 2018;23:60.",
"DOI": null,
"article": 315
},
{
"id": 13079,
"serial_number": 10,
"pmc": null,
"reference": "Lee KY. A unified pathogenesis for kidney diseases, including genetic diseases and cancers, by the proteinhomeostasis-system hypothesis. Kidney Res Clin Pract. 2017;36:132-44.",
"DOI": null,
"article": 315
},
{
"id": 13080,
"serial_number": 11,
"pmc": null,
"reference": "Yang F, Khin L-W, et al. Hemodialysis versus Peritoneal Dialysis: A Comparison of Survival Outcomes in South-East Asian Patients with End-Stage Renal Disease. PLoS ONE 2015;10:e0140195.",
"DOI": null,
"article": 315
},
{
"id": 13081,
"serial_number": 12,
"pmc": null,
"reference": "Vadakedath S, Kandi V. Dialysis: A Review of the Mechanisms Underlying Complications in the Management of Chronic Renal Failure. Cureus 2017;9(8): e1603.",
"DOI": null,
"article": 315
},
{
"id": 13082,
"serial_number": 13,
"pmc": null,
"reference": "Nguyen‐Khoa T, Massy ZA, et al. Oxidative stress and haemodialysis: role of inflammation and duration of dialysis treatment. Nephrology Dialysis Transplantation, 2001;16(2):335–340.",
"DOI": null,
"article": 315
},
{
"id": 13083,
"serial_number": 14,
"pmc": null,
"reference": "Okano K, Ohba T, et al. Analysis of Plasma Adipocytokines Related to Clinical and Laboratory Data in the Maintenance Hemodialysis Patients. Inter Med 2008;47:1379-1386.",
"DOI": null,
"article": 315
},
{
"id": 13084,
"serial_number": 15,
"pmc": null,
"reference": "Rysz J, Banach M, et al. Blood serum levels of IL-2, IL-6, IL-8, TNF-alpha and IL-1beta in patients on maintenance hemodialysis. Cell Mol Immunol. 2006;3:151–4.",
"DOI": null,
"article": 315
},
{
"id": 13085,
"serial_number": 16,
"pmc": null,
"reference": "Park J, Ahmadi SF, et al. Obesity Paradox in End-Stage Kidney Disease Patients. Progress in Cardiovascular Diseases. 2014:56:415–25.",
"DOI": null,
"article": 315
},
{
"id": 13086,
"serial_number": 17,
"pmc": null,
"reference": "Rhee CM, Nguyen DV, et al. Association of Adiponectin with Body Composition and Mortality in Hemodialysis Patients. Am J Kidney Dis. 2015;66(2):313-21.",
"DOI": null,
"article": 315
},
{
"id": 13087,
"serial_number": 18,
"pmc": null,
"reference": "Małgorzewicz S, Aleksandrowicz-Wrona E, et al. Adipokines and Nutritional Status for Patients on Maintenance Hemodialysis. J of Renal Nutrition, 2010;20:303–8.",
"DOI": null,
"article": 315
},
{
"id": 13088,
"serial_number": 19,
"pmc": null,
"reference": "Ayerden EF, Ebinc H, et. al. The relationship between adiponectin levels and proinflammatory cytokines and left ventricular mass in dialysis patients. J Nephrol, 2009;22:216-23.",
"DOI": null,
"article": 315
},
{
"id": 13089,
"serial_number": 20,
"pmc": null,
"reference": "Oncel M, Akbulut S, et al. Cytokines, adipocytokines and inflammatory markers in patients on continuous ambulatory peritoneal dialysis and hemodialysis, Renal Failure. 2016;38(7):1071-5.",
"DOI": null,
"article": 315
},
{
"id": 13090,
"serial_number": 21,
"pmc": null,
"reference": "Nagy K, Ujszaszi A, et al. Association between serum resistin level and outcomes in kidney transplant recipients. Transplant International. 2016;29(3):352-61.",
"DOI": null,
"article": 315
},
{
"id": 13091,
"serial_number": 22,
"pmc": null,
"reference": "Spoto B, Mattace-Raso F, et al. Resistin and allcause and cardiovascular mortality: effect modification by adiponectin in end-stage kidney disease patients. Nephrol Dial Transplant 2013;28 Suppl 4:iv181-iv187.",
"DOI": null,
"article": 315
},
{
"id": 13092,
"serial_number": 23,
"pmc": null,
"reference": "Zhou L, Li JY, et al. Resistin: Potential biomarker and therapeutic target in atherosclerosis. Clinica Chimica Acta. 2021;512:84-91.",
"DOI": null,
"article": 315
},
{
"id": 13093,
"serial_number": 24,
"pmc": null,
"reference": "Madra-Gackowska K, Szewczyk-Golec K, et al. Evaluation of Selected Parameters of Oxidative Stress and Adipokine Levels in Hospitalized Older Patients with Diverse Nutritional Status. Antioxidants 2023, 12, 569.",
"DOI": null,
"article": 315
},
{
"id": 13094,
"serial_number": 25,
"pmc": null,
"reference": "Christou KA, Christou GA, et al. The regulation of serum resistin levels in metabolically healthy and unhealthy obese individuals. Hormones. 2020;19:523–9.",
"DOI": null,
"article": 315
},
{
"id": 13095,
"serial_number": 26,
"pmc": null,
"reference": "Sabry MM, Dawood AF, et al. Relation between resistin, PPAR-γ, obesity and atherosclerosis in male albino rats, Archives of Physiology and Biochemistry. 2020;126(5):389-98.",
"DOI": null,
"article": 315
},
{
"id": 13096,
"serial_number": 27,
"pmc": null,
"reference": "Dakroub A, Nasser SA, et al. Visfatin: A Possible Role in Cardiovasculo-Metabolic Disorders. Cells, 2020;9:2444.",
"DOI": null,
"article": 315
},
{
"id": 13097,
"serial_number": 28,
"pmc": null,
"reference": "Romacho T, Valencia I, et al. Visfatin/eNampt induces endothelial dysfunction in vivo: a role for Toll-Like Receptor 4 and NLRP3 inflammasome. Sci Rep 2020;10:5386.",
"DOI": null,
"article": 315
},
{
"id": 13098,
"serial_number": 29,
"pmc": null,
"reference": "Zheng LY, Xu X, et al. Association between serum visfatin levels and atherosclerotic plaque in patients with type 2 diabetes. DiabetolMetab Syndr 2019;11:60.",
"DOI": null,
"article": 315
},
{
"id": 13099,
"serial_number": 30,
"pmc": null,
"reference": "Kim SH, Lee SH, et al. Effect of lifestyle modification on serum chemerin concentration and its association with insulin sensitivity in overweight and obese adults with type 2 diabetes. Clin Endocrinol. 2014;80:825-33.",
"DOI": null,
"article": 315
},
{
"id": 13100,
"serial_number": 31,
"pmc": null,
"reference": "Ahmed SE, Sarhat ER, et al. Altered Serum Marker of Adipokines Profile in Breast Cancer Women. Indian Journal of Forensic Medicine & Toxicology. 2021;15(3):2598-604.",
"DOI": null,
"article": 315
},
{
"id": 13101,
"serial_number": 32,
"pmc": null,
"reference": "Abd Rabo SAE, Mohamed NAG, et al. Serum chemerin level in chronic kidney disease. Egypt J Intern Med, 2016;28:99–107.",
"DOI": null,
"article": 315
},
{
"id": 13102,
"serial_number": 33,
"pmc": null,
"reference": "Sarhat ER, Khalaf SJ, et al. A Study of Some Biochemical Parameters in Blood Serum of Patients with Congestive Heart Failure. Indian Journal of Public Health Research & Development, 2019;10(5):413-8.",
"DOI": null,
"article": 315
},
{
"id": 13103,
"serial_number": 34,
"pmc": null,
"reference": "Hambali Z, Ahmad Z, et sl. Oxidative stress and its association with cardiovascular disease in chronic renal failure patients. Indian Journal of Nephrology. 2011;21(1):21-5.",
"DOI": null,
"article": 315
},
{
"id": 13104,
"serial_number": 35,
"pmc": null,
"reference": "Wassmann S, Wassmann K, et al. Modulation of oxidant and antioxidant enzyme expression and function in vascular cells. Hypertension, 2004;44:381.",
"DOI": null,
"article": 315
},
{
"id": 13105,
"serial_number": 36,
"pmc": null,
"reference": "Sasikala M, Sadasivudu B, et al. A putative role for calcineurin in lymphopenia associated with chronic renal failure. Clin Biochem, 2000;33:691-4.",
"DOI": null,
"article": 315
},
{
"id": 13106,
"serial_number": 37,
"pmc": null,
"reference": "Mahaboob RS, Obulesu G, et al. A Comparative study of oxidant and Anti-oxidant parameters in Chronic Renal Failure, Haemodialysis (Pre &Post) and Controls. Int. J. Res. Hos & Clin. Pharm. 2020;2(3):78-81.",
"DOI": null,
"article": 315
},
{
"id": 13107,
"serial_number": 38,
"pmc": null,
"reference": "Montazerifar F, Hashemi M, et al. Evaluation of Lipid Peroxidation and Erythrocyte Glutathione Peroxidase and Superoxide Dismutase in Hemodialysis Patients. Saudi J Kidney Dis Transpl, 2012;23(2):274-9.",
"DOI": null,
"article": 315
},
{
"id": 13108,
"serial_number": 39,
"pmc": null,
"reference": "Mimic-Oka J, Simic T, et al. Erythrocyte glutathione peroxidase and superoxide dismutase activities in different stages of chronic renal failure. Clin Nephrol. 1995;44(1):44-8.",
"DOI": null,
"article": 315
},
{
"id": 13109,
"serial_number": 40,
"pmc": null,
"reference": "González-Rico M, Puchades MJ, et al. Effect of oxidative stress in patients with chronic renal failure. Nefrologia. 2006;26(2):218-25.",
"DOI": null,
"article": 315
},
{
"id": 13110,
"serial_number": 41,
"pmc": null,
"reference": "Ozden M, Maral H, et al. Erythrocyte glutathione peroxidase activity, plasma malondialdehyde and erythrocyte glutathione levels in hemodialysis and CAPD patients. Clin Biochem. 2002;35(4):269-73.",
"DOI": null,
"article": 315
},
{
"id": 13111,
"serial_number": 42,
"pmc": null,
"reference": "Krata N, Zagożdżon R, et al. Oxidative Stress in Kidney Diseases: The Cause or the Consequence?. Arch. Immunol. Ther. Exp. 2018;66:211–220.",
"DOI": null,
"article": 315
},
{
"id": 13112,
"serial_number": 43,
"pmc": null,
"reference": "Sreenivasulu U, Shyam-Prasad BR, et al. Study of serum malondialdehyde levels in chronic renal failure Patients: A hospital based study in Govt. general hospital, Anantapuramu, Andhra Pradesh. Int J of Clin Biochemist and Res, 2020;7(1):138–41.",
"DOI": null,
"article": 315
},
{
"id": 13113,
"serial_number": 44,
"pmc": null,
"reference": "Sridhar AV, Rao PS, et al. Study of oxidant and anti-oxidant status in patients with chronic kidney disease. J of Clin and Scient Res. 2018;7(3):124-30.",
"DOI": null,
"article": 315
},
{
"id": 13114,
"serial_number": 45,
"pmc": null,
"reference": "Sulaiman SH, Demir H, et al. Determination of Oxidative Stress Levels and Some Antioxidant Activities in Acute and Chronic Renal Failure Patients. Int J Clin Chem Lab Med (IJCCLM), 2021;7(1):12-9.",
"DOI": null,
"article": 315
},
{
"id": 13115,
"serial_number": 46,
"pmc": null,
"reference": "Gracia KC, Llanas-Cornejo D, et al. CVD and Oxidative Stress. J. Clin. Med. 2017;6:1-22.",
"DOI": null,
"article": 315
},
{
"id": 13116,
"serial_number": 47,
"pmc": null,
"reference": "Lim P, Chen S, et al. Association of Plasma Adiponectin Levels with Oxidative Stress in Hemodialysis Patients. Blood Purif 2007;25:362–369.",
"DOI": null,
"article": 315
},
{
"id": 13117,
"serial_number": 48,
"pmc": null,
"reference": "Barazzoni R, Bernardi A, et al. Low fat adiponectin expression is associated with oxidative stress in nondiabetic humans with chronic kidney disease—impact on plasma adiponectin concentration. Am J Physiol Regul Integr Comp Physiol 2007;293: R47–R54.",
"DOI": null,
"article": 315
},
{
"id": 13118,
"serial_number": 49,
"pmc": null,
"reference": "Małgorzewicz S, Lichodziejewska-Niemierko M, et al. Adipokines, endothelial dysfunction and nutritional status in peritoneal dialysis patients. Scandinavian Journal of Urology and Nephrology, 2010; 44: 445–451.",
"DOI": null,
"article": 315
}
]
}
]
}
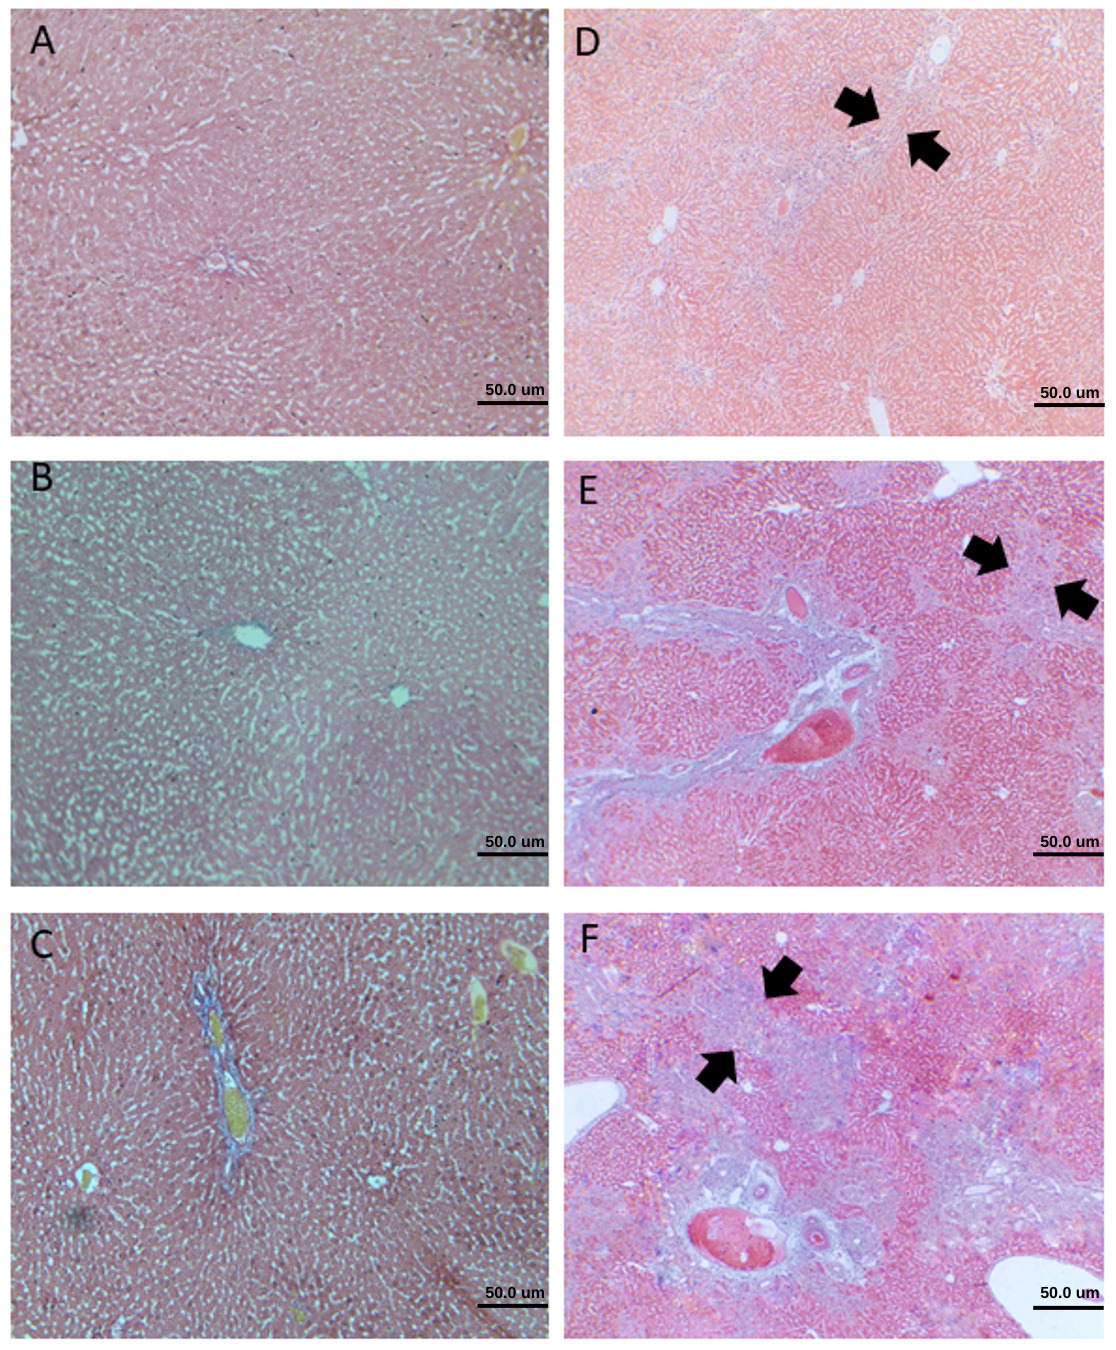
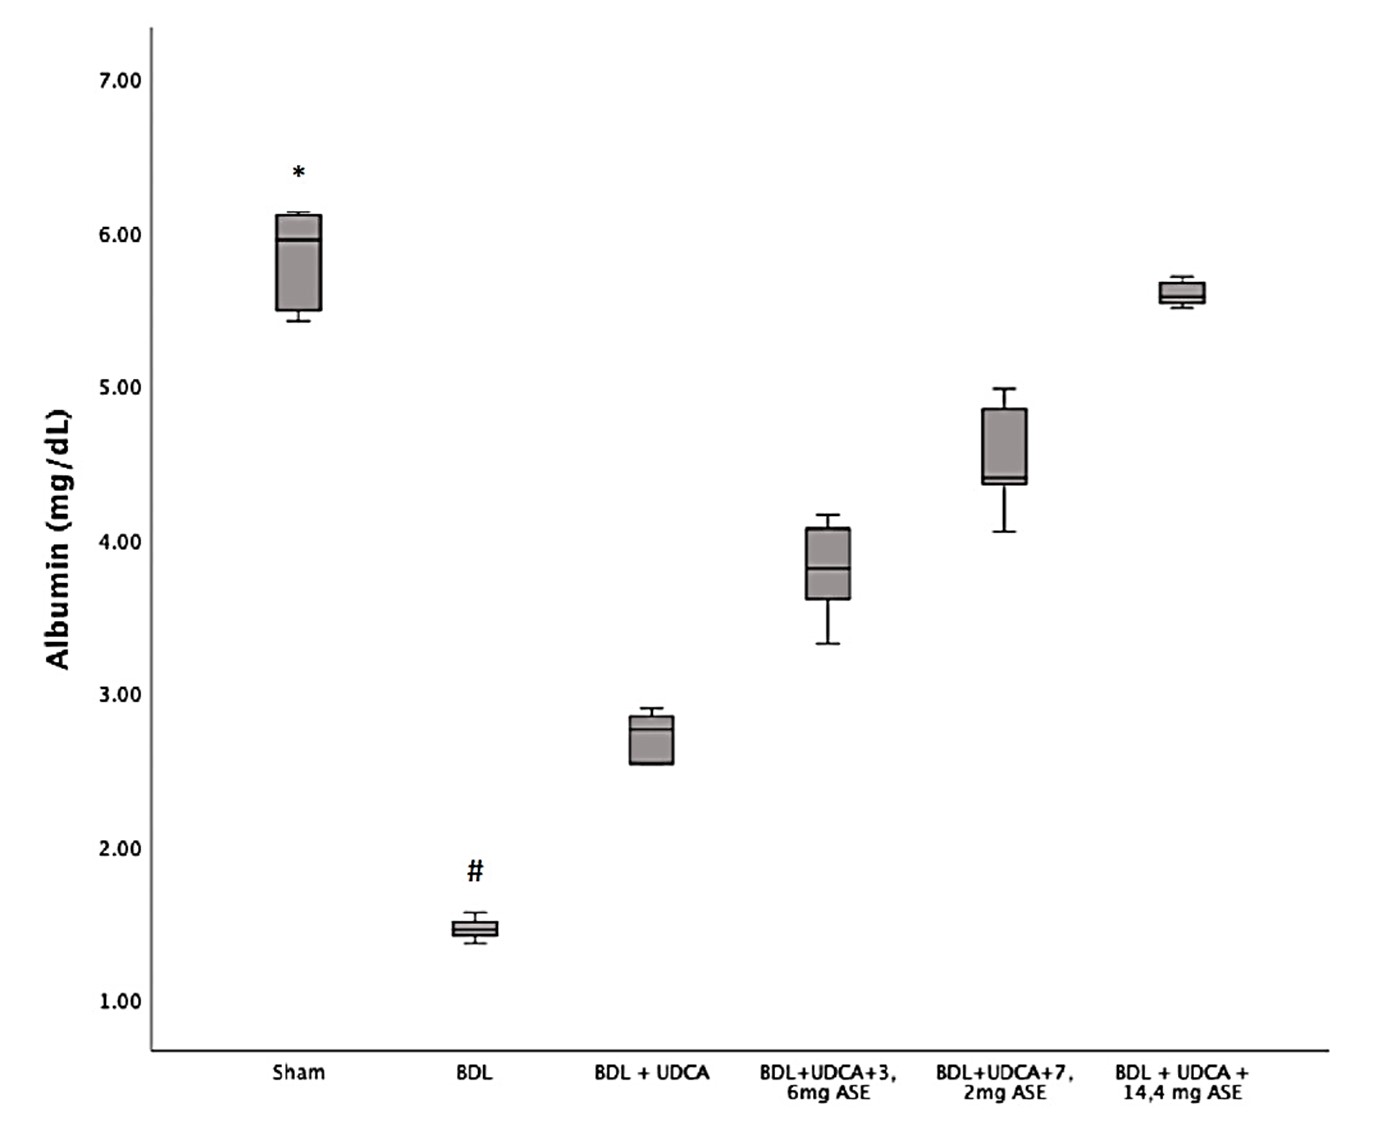
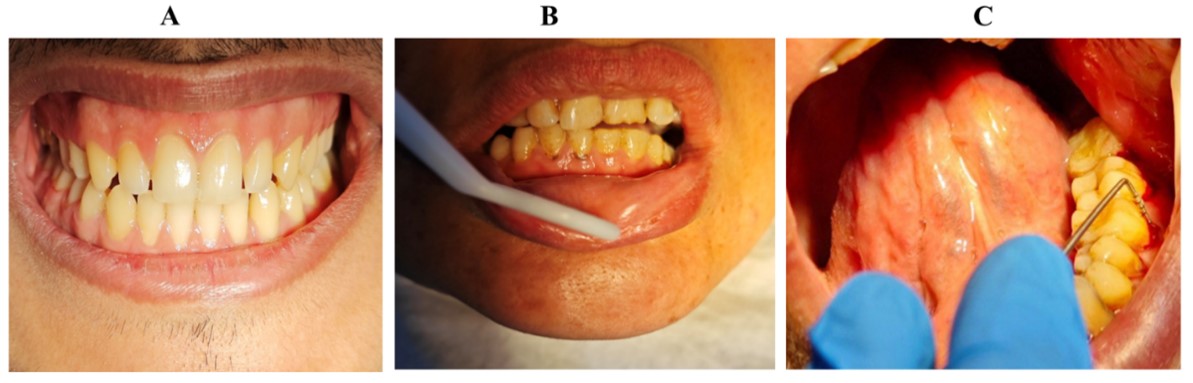
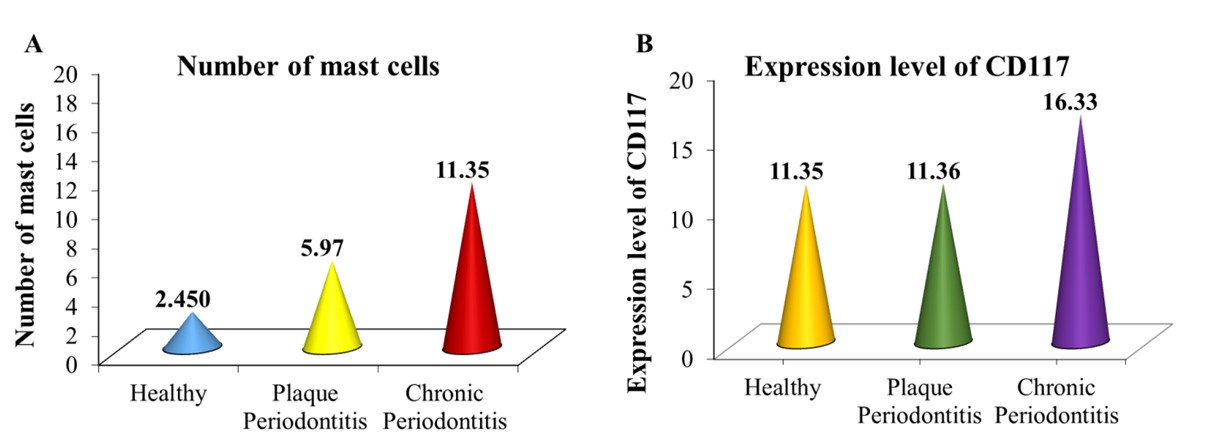
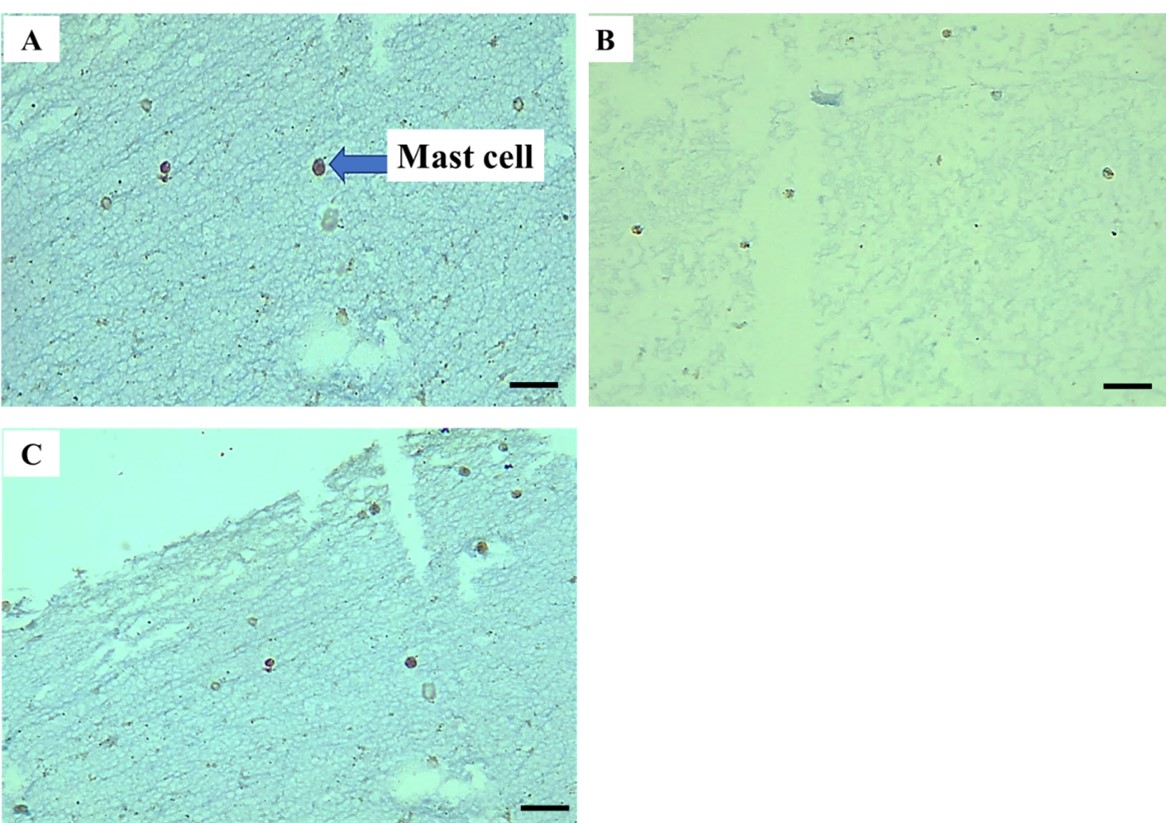
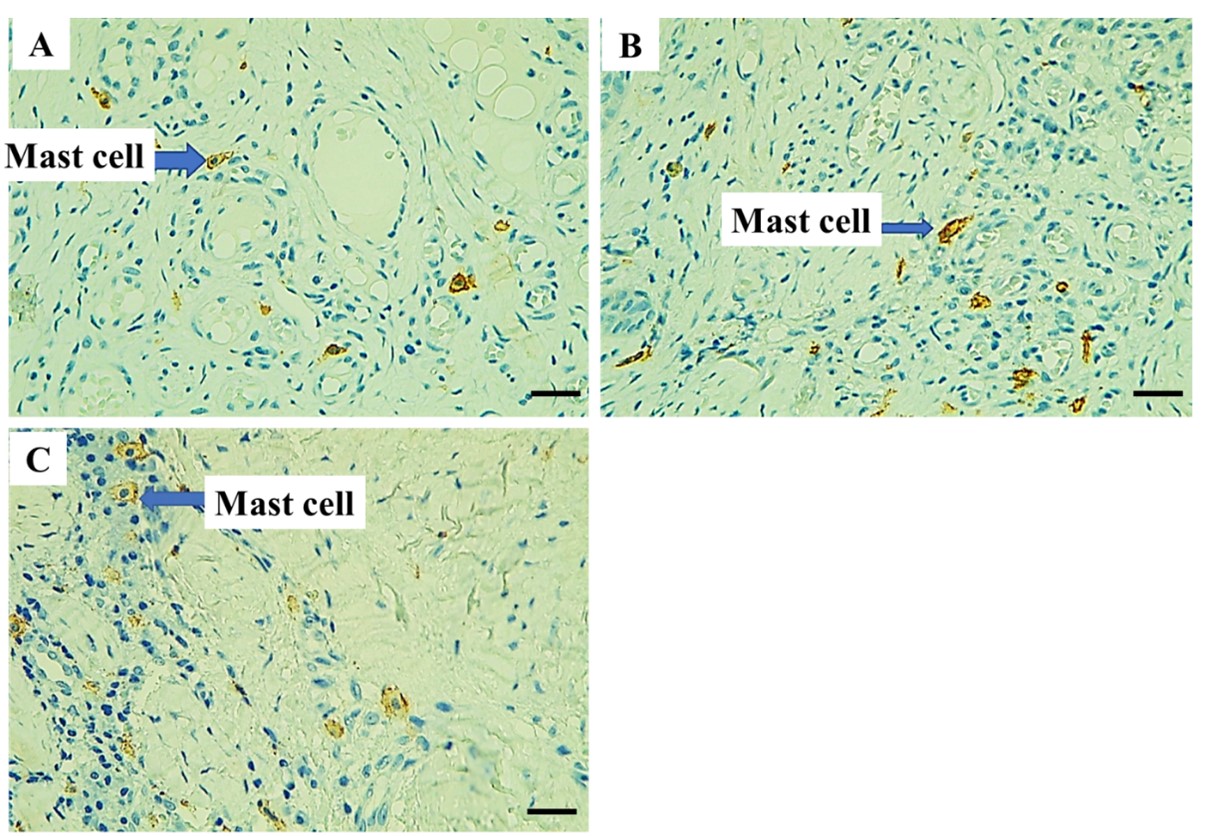
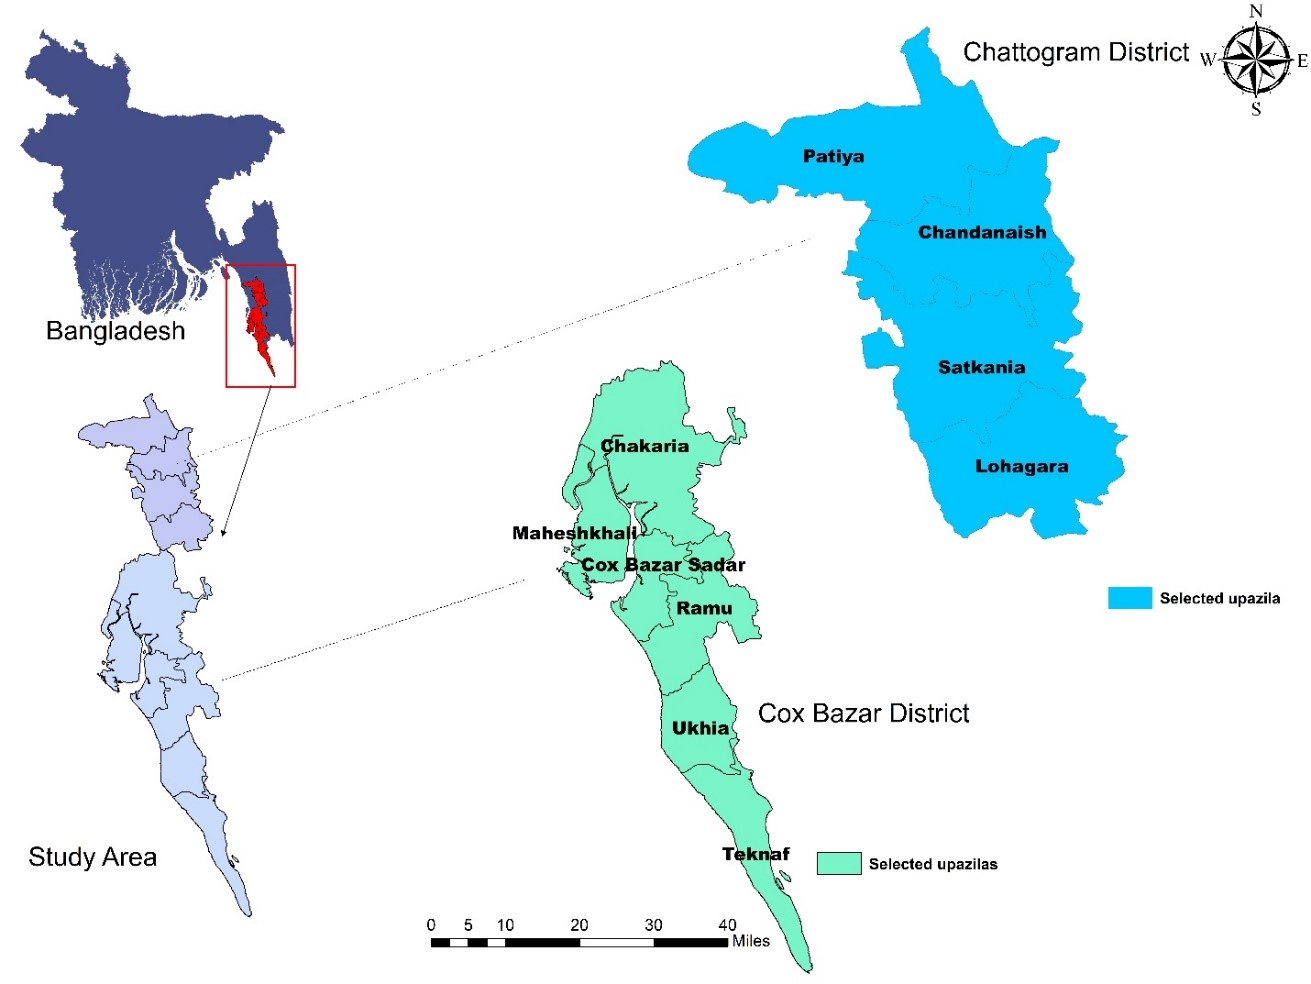
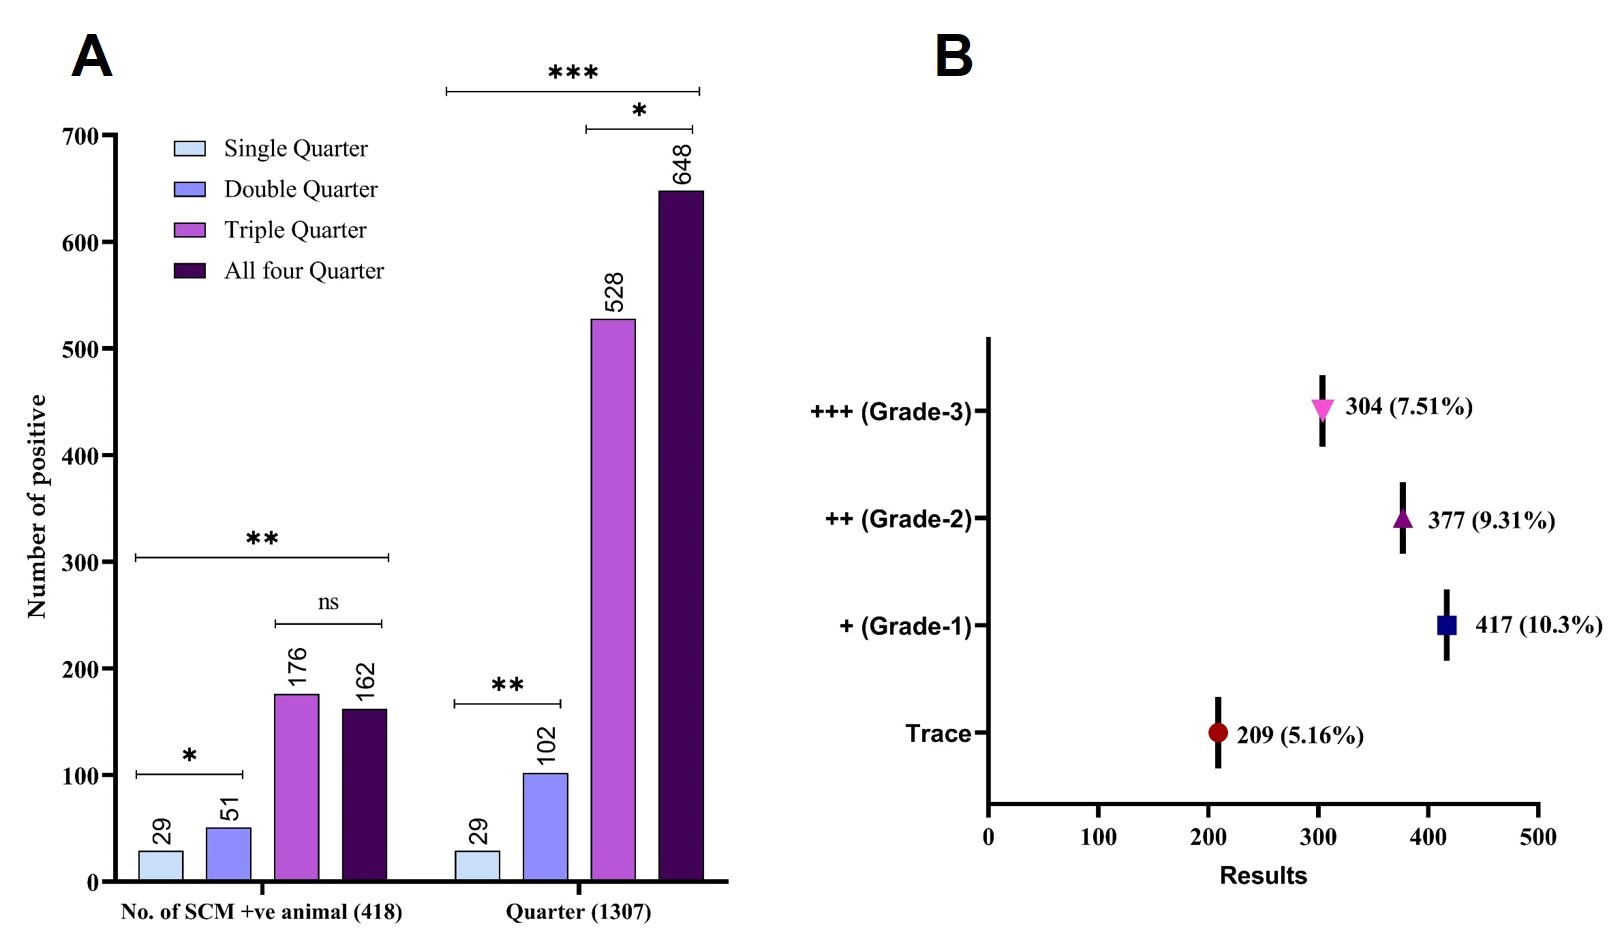
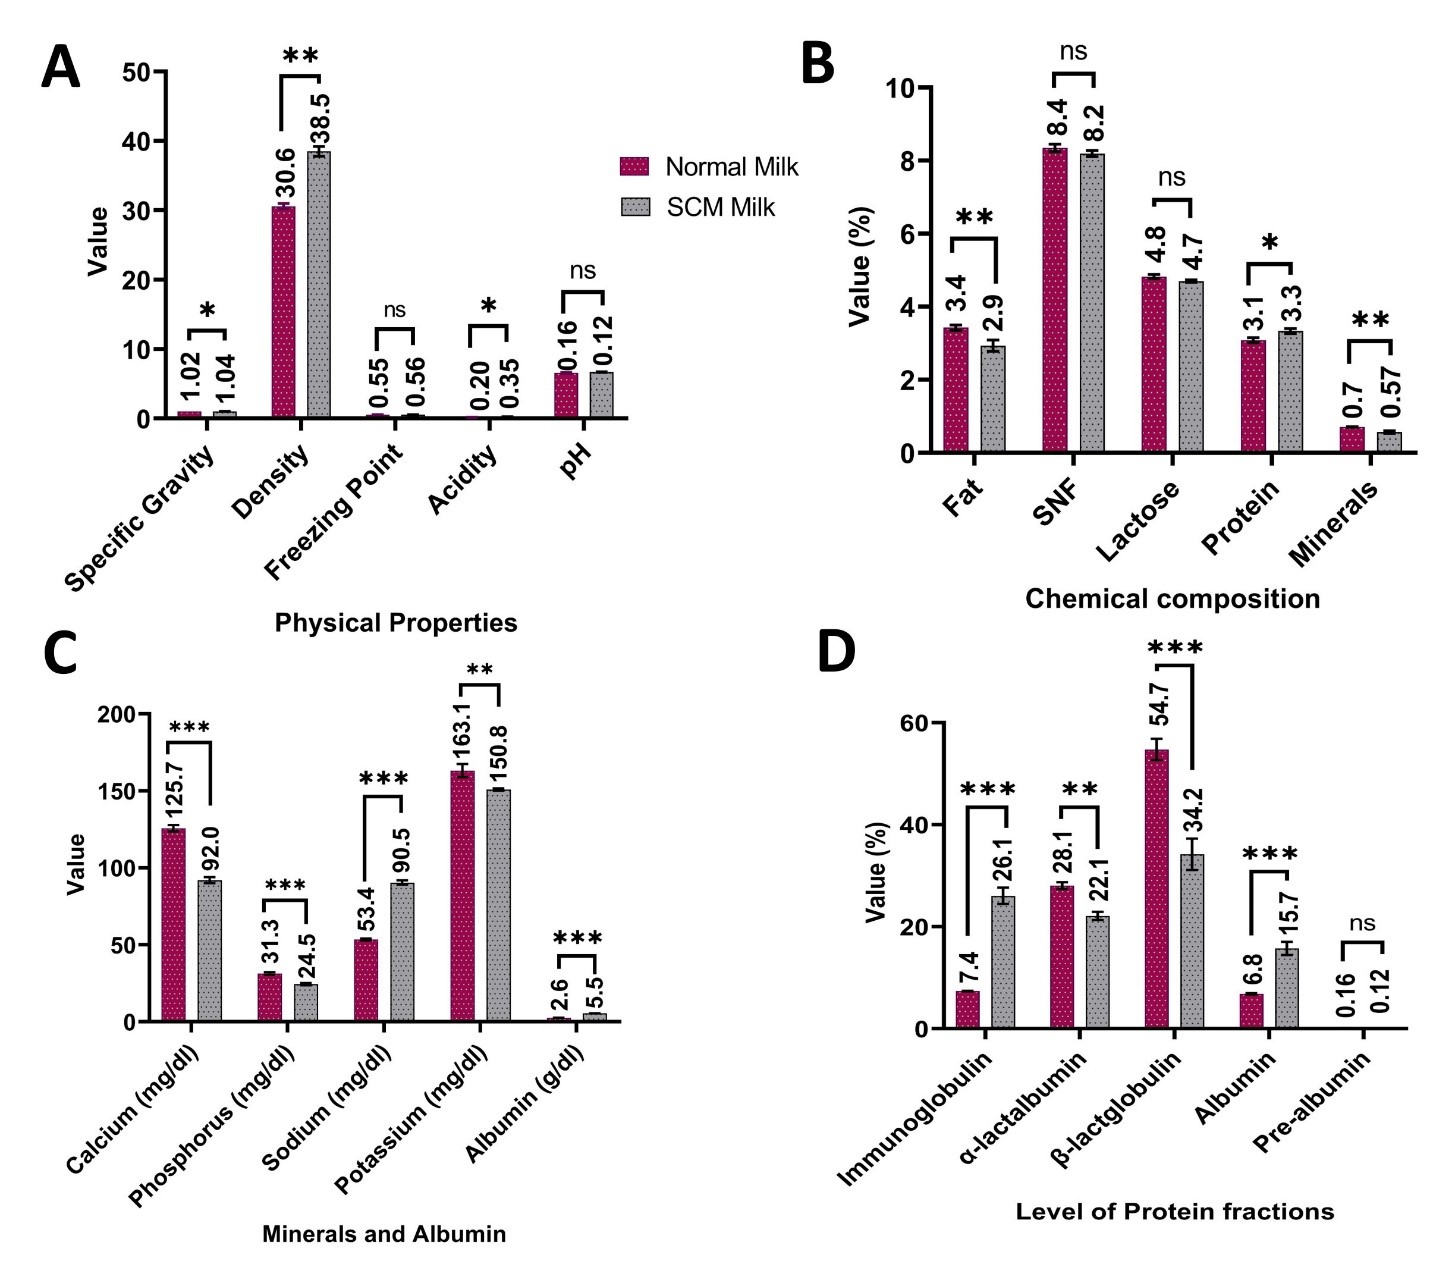
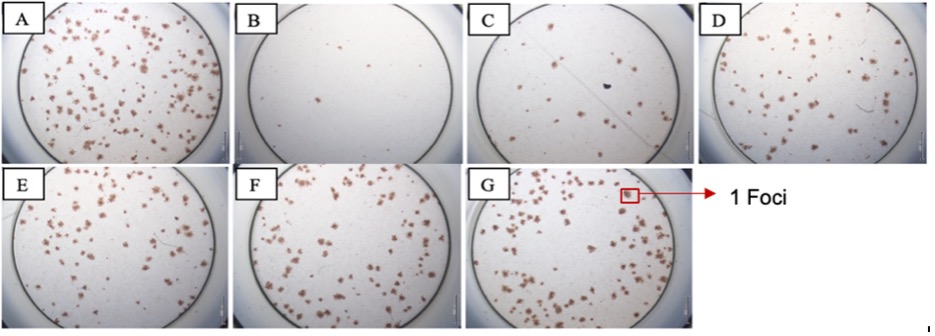
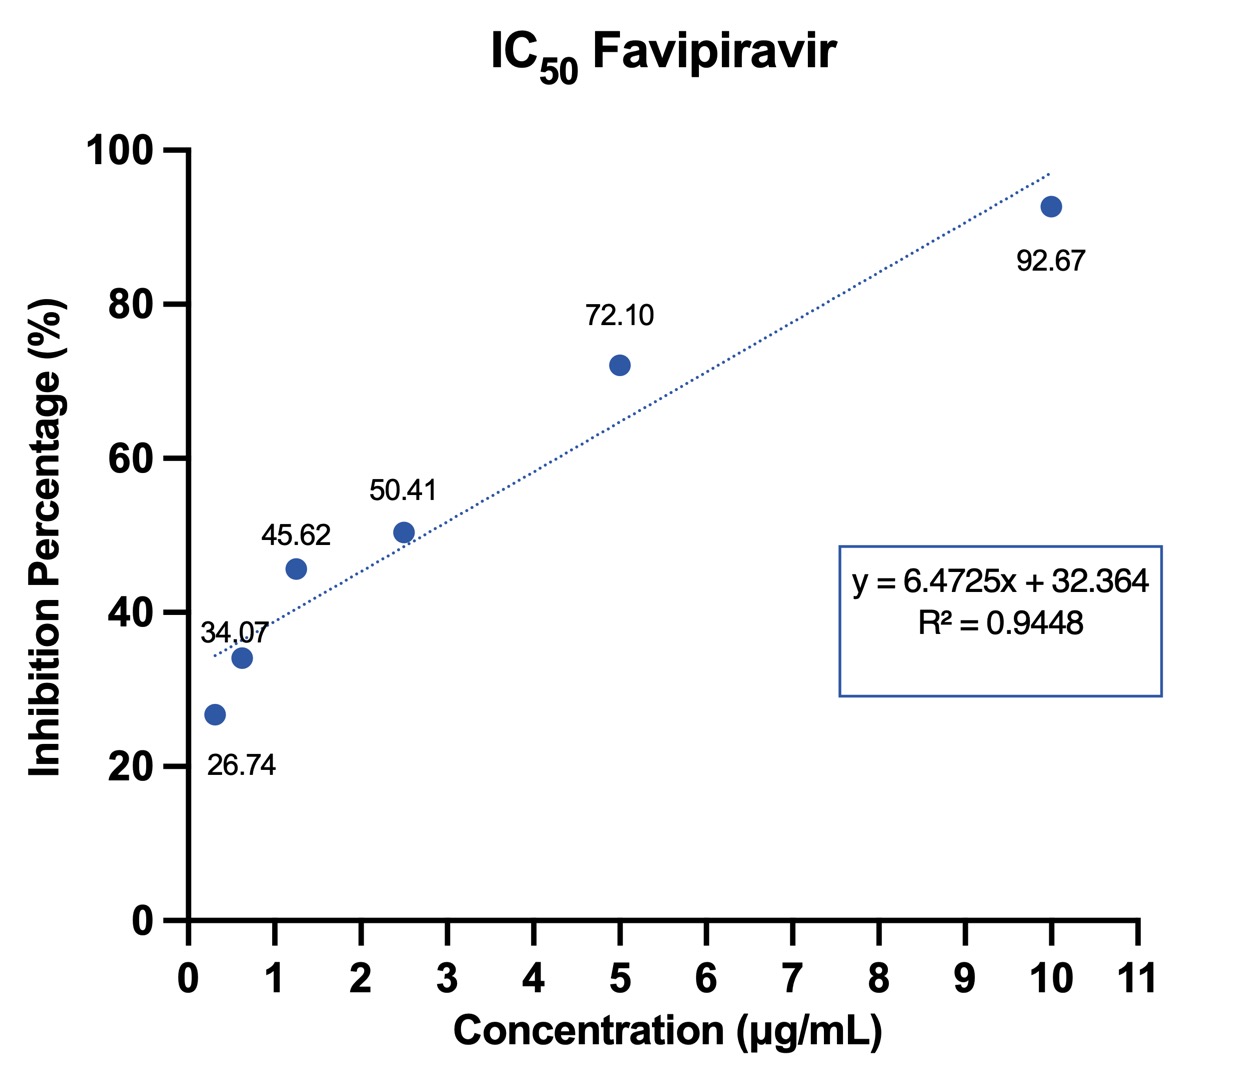
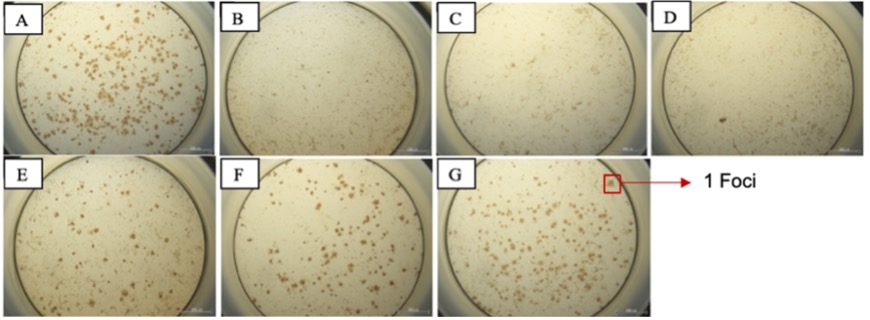
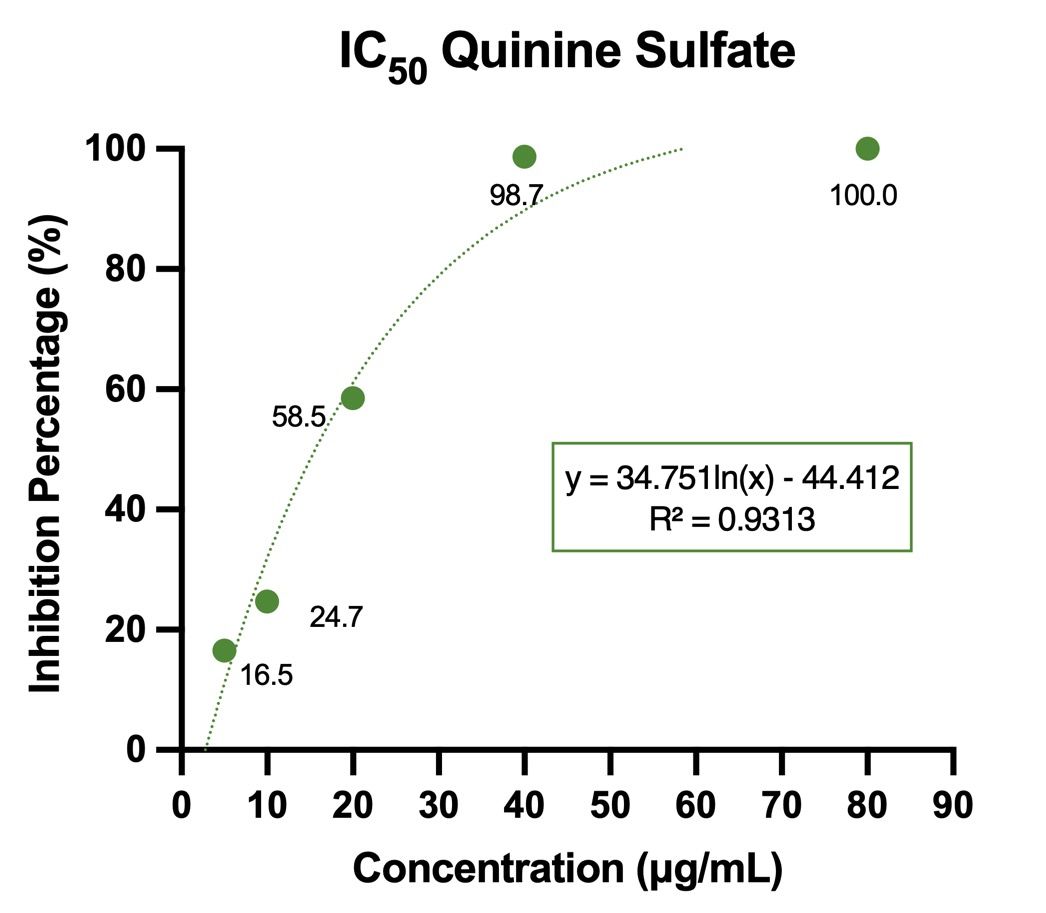
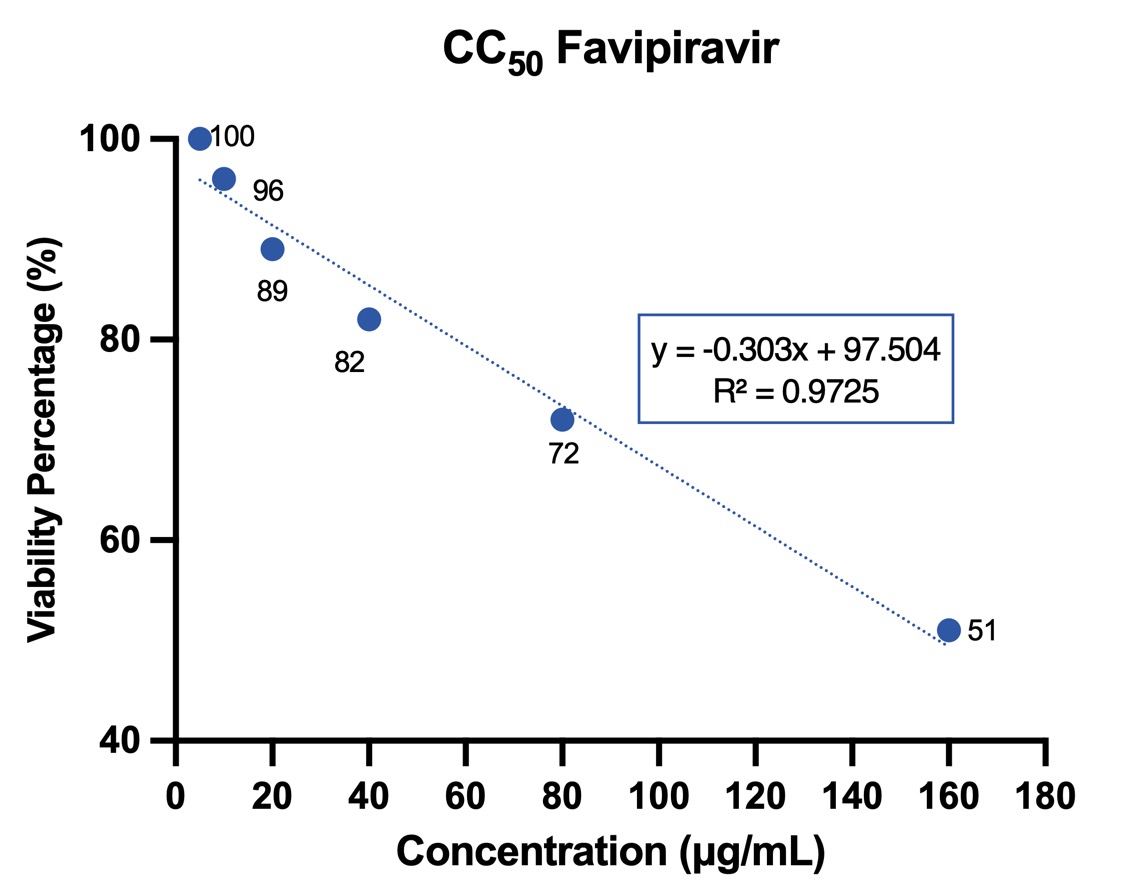
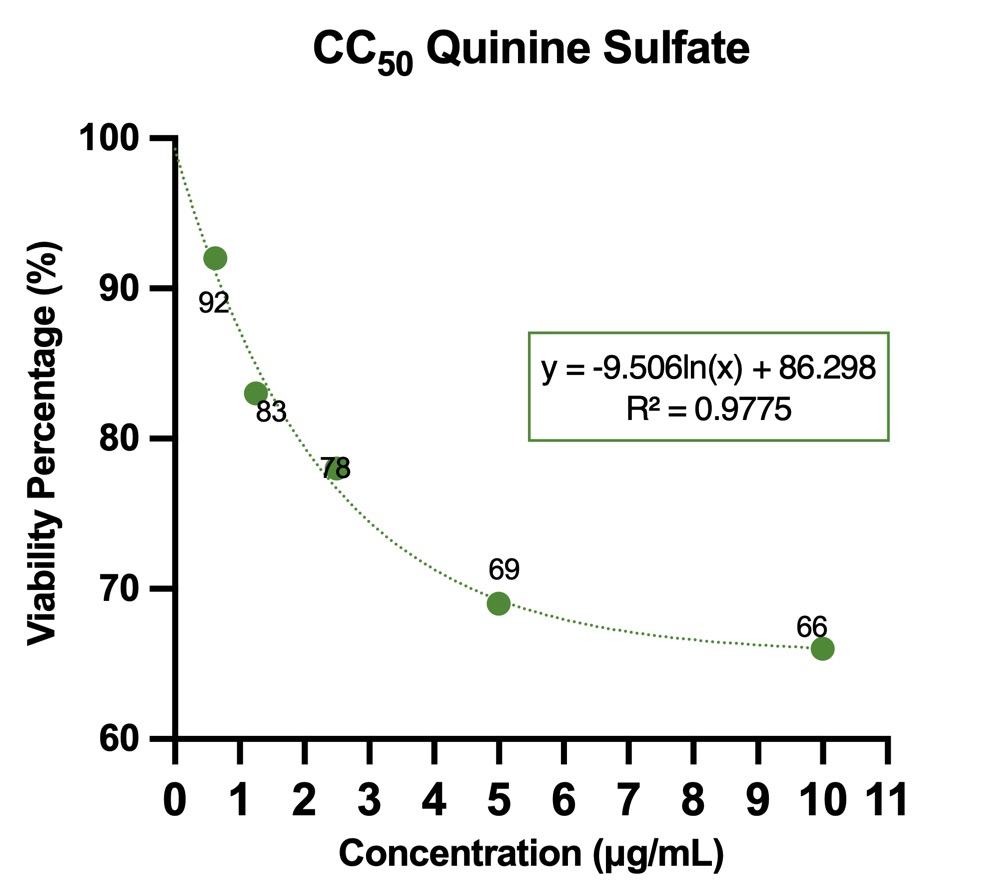
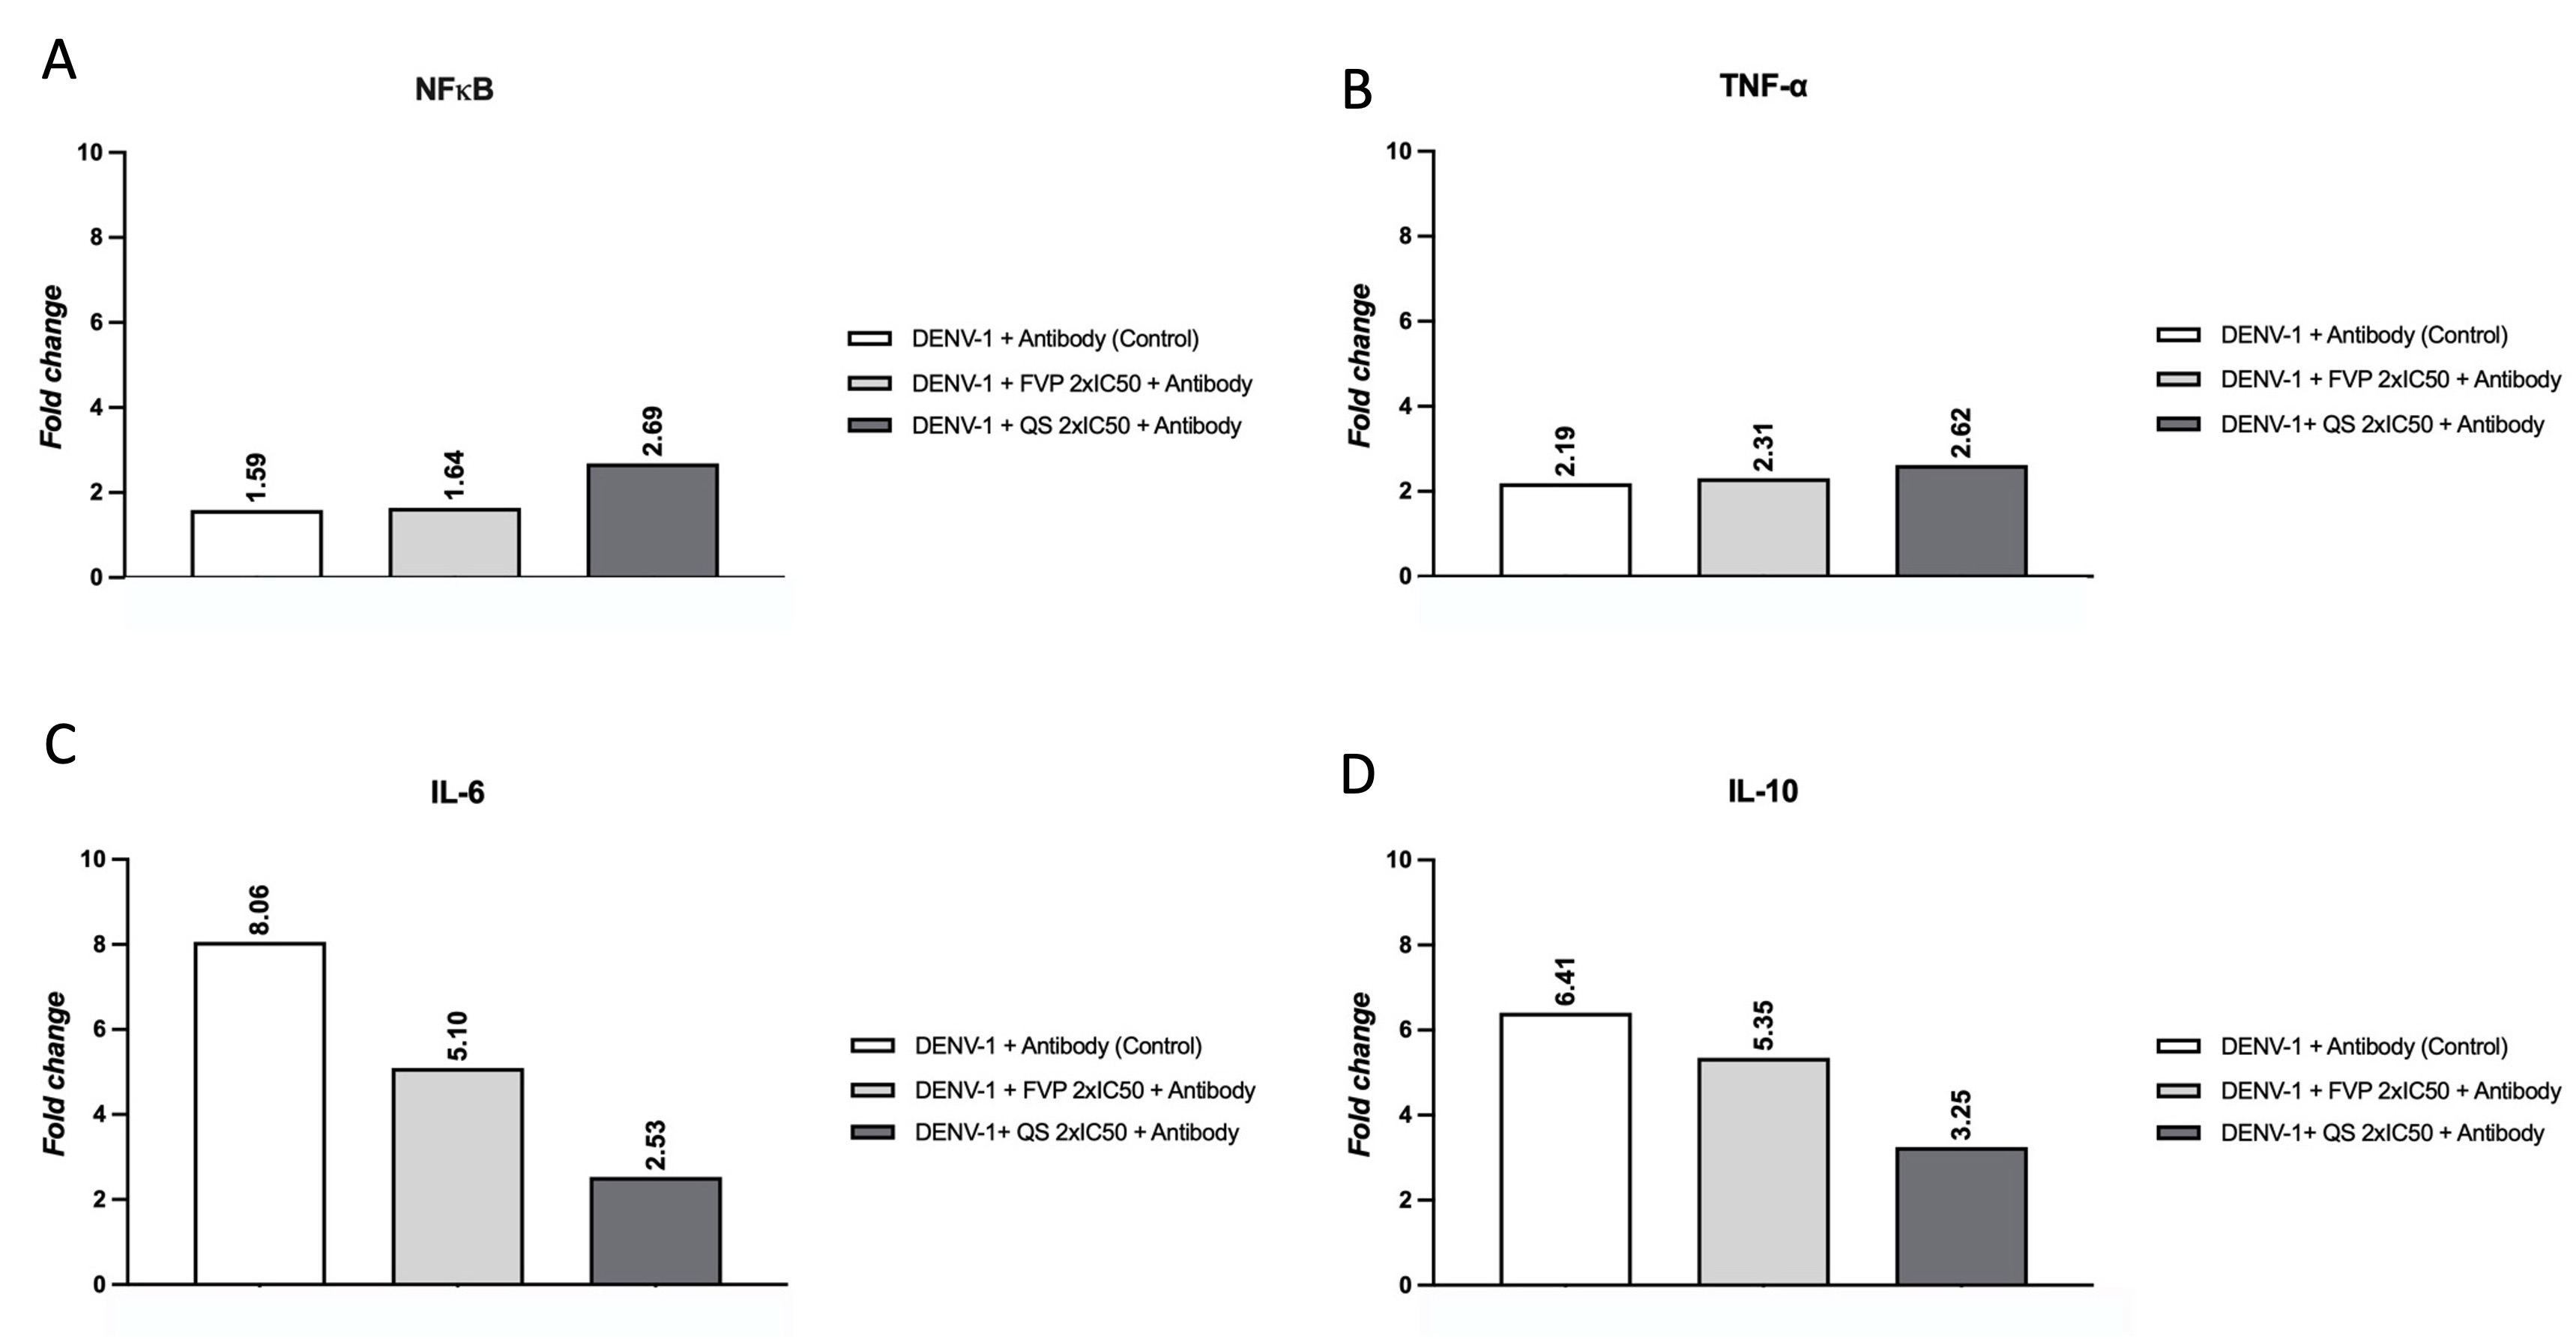
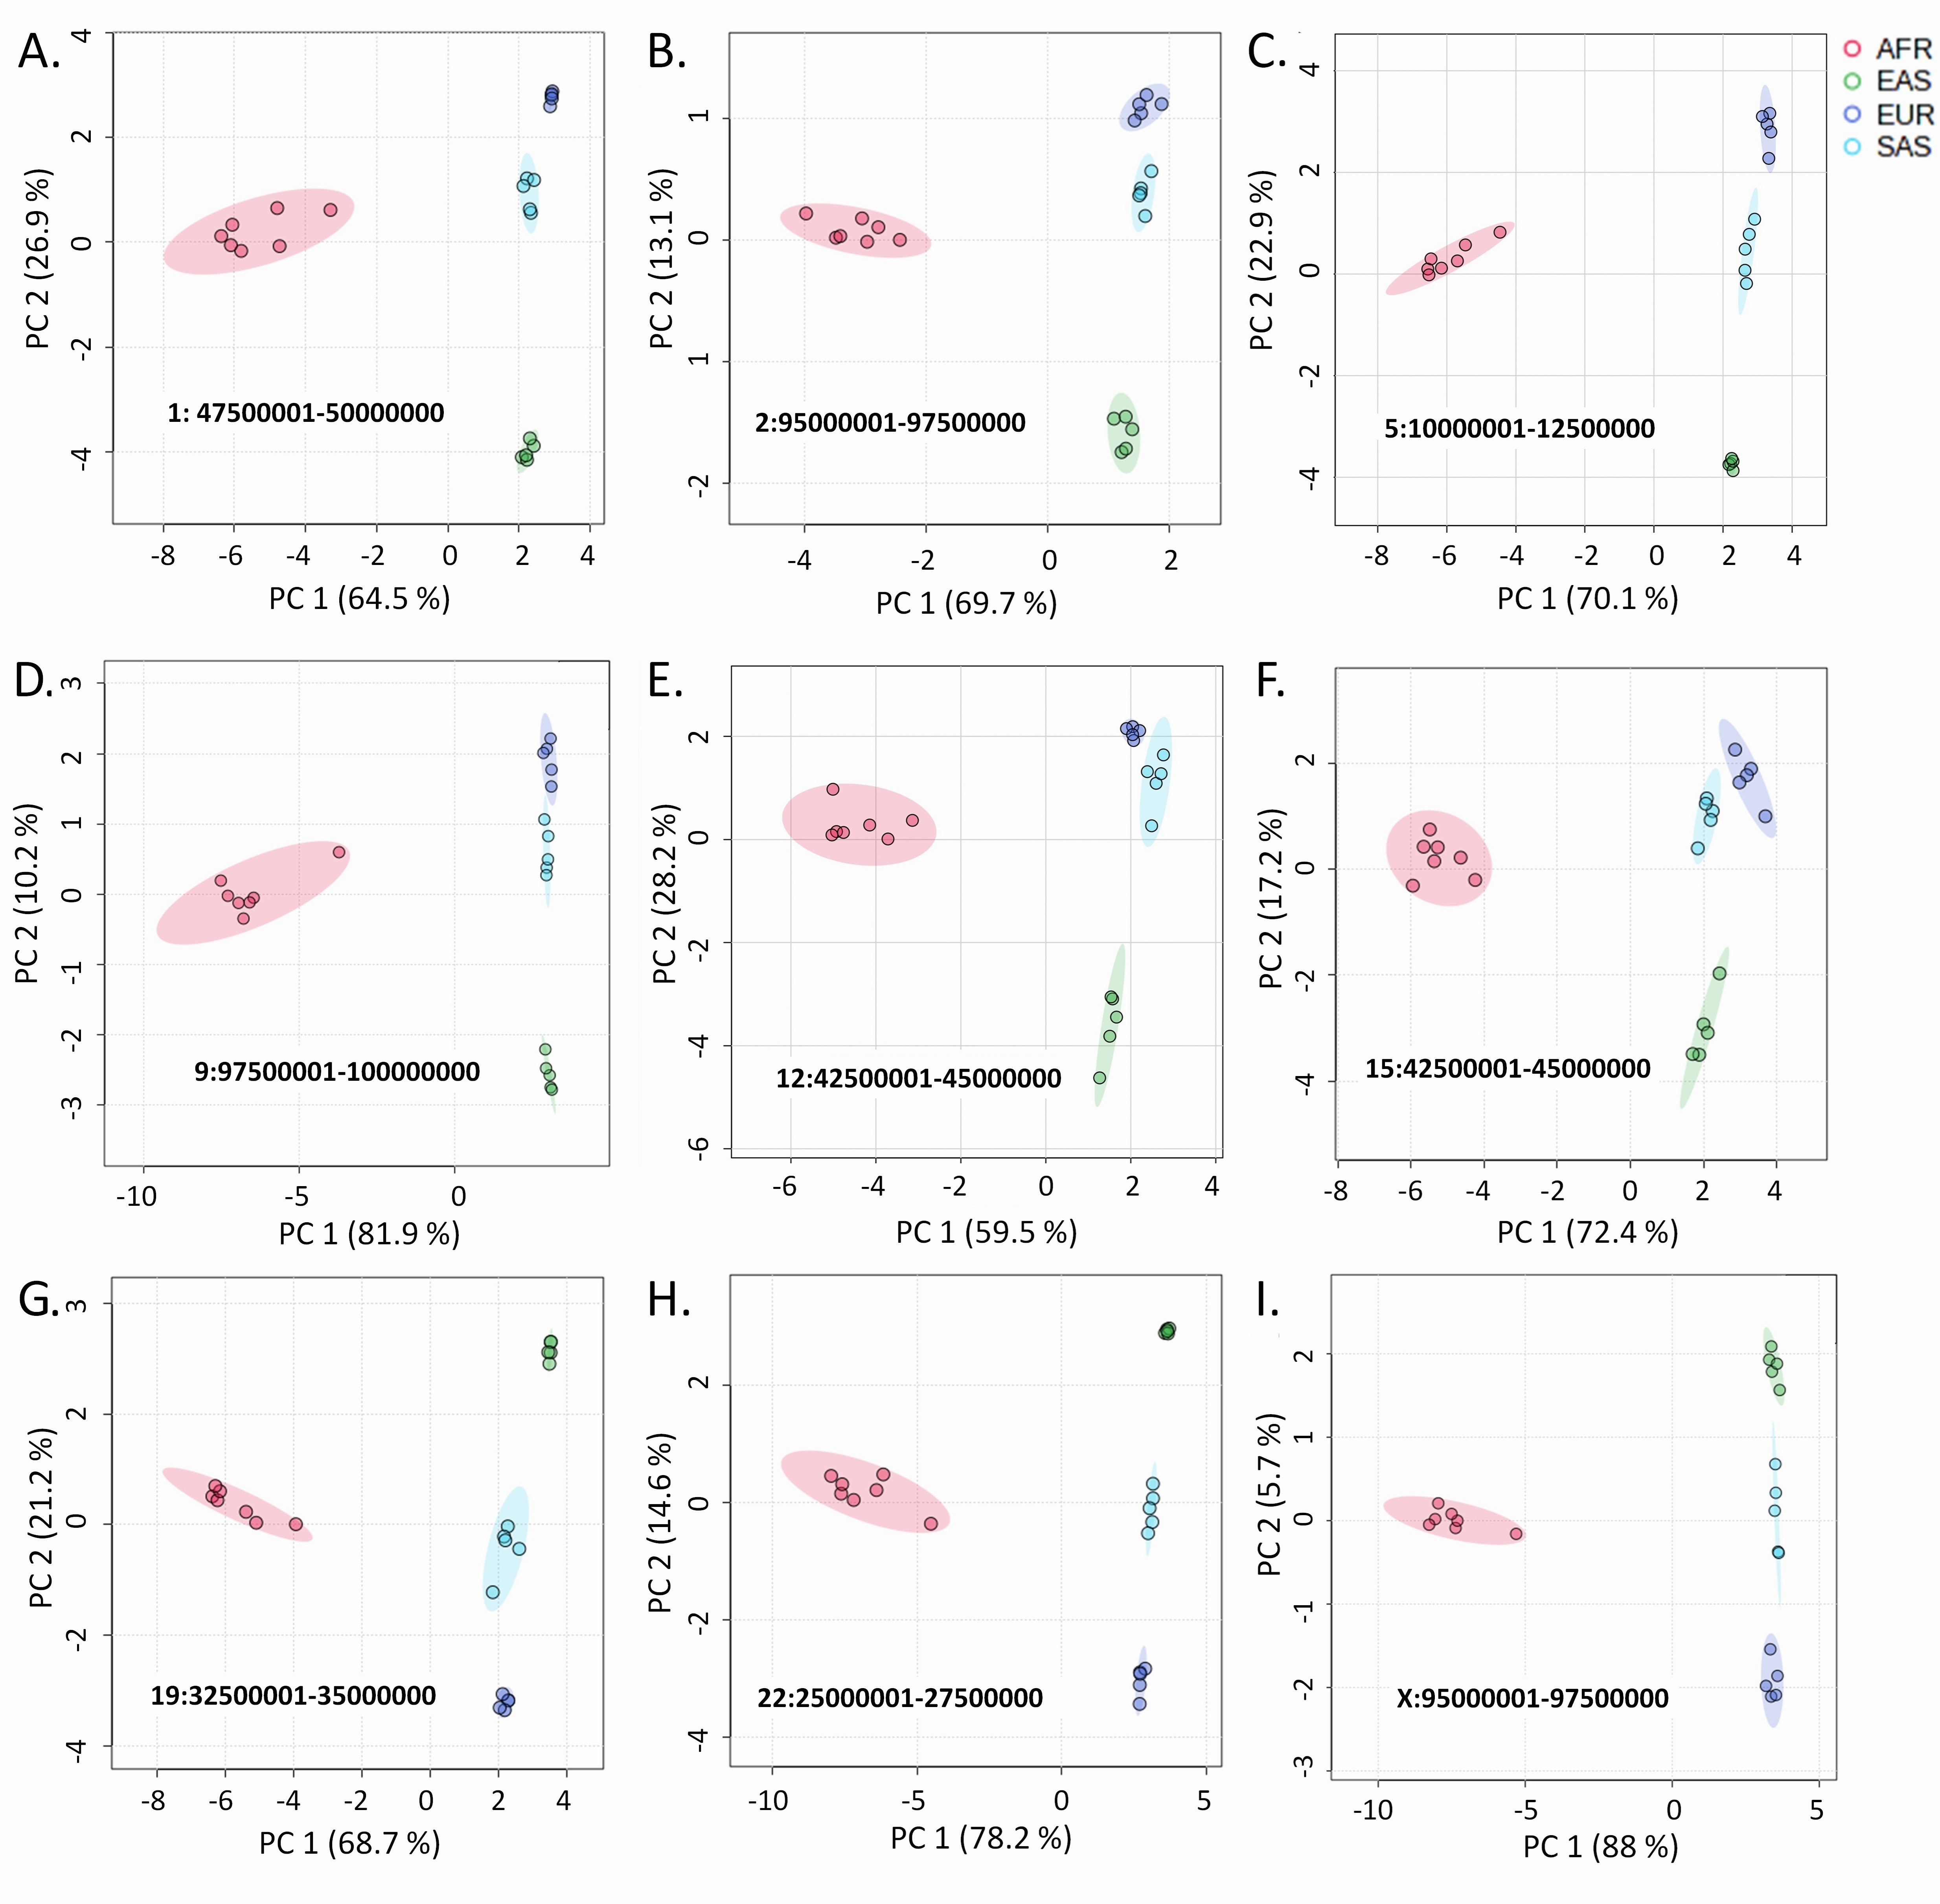
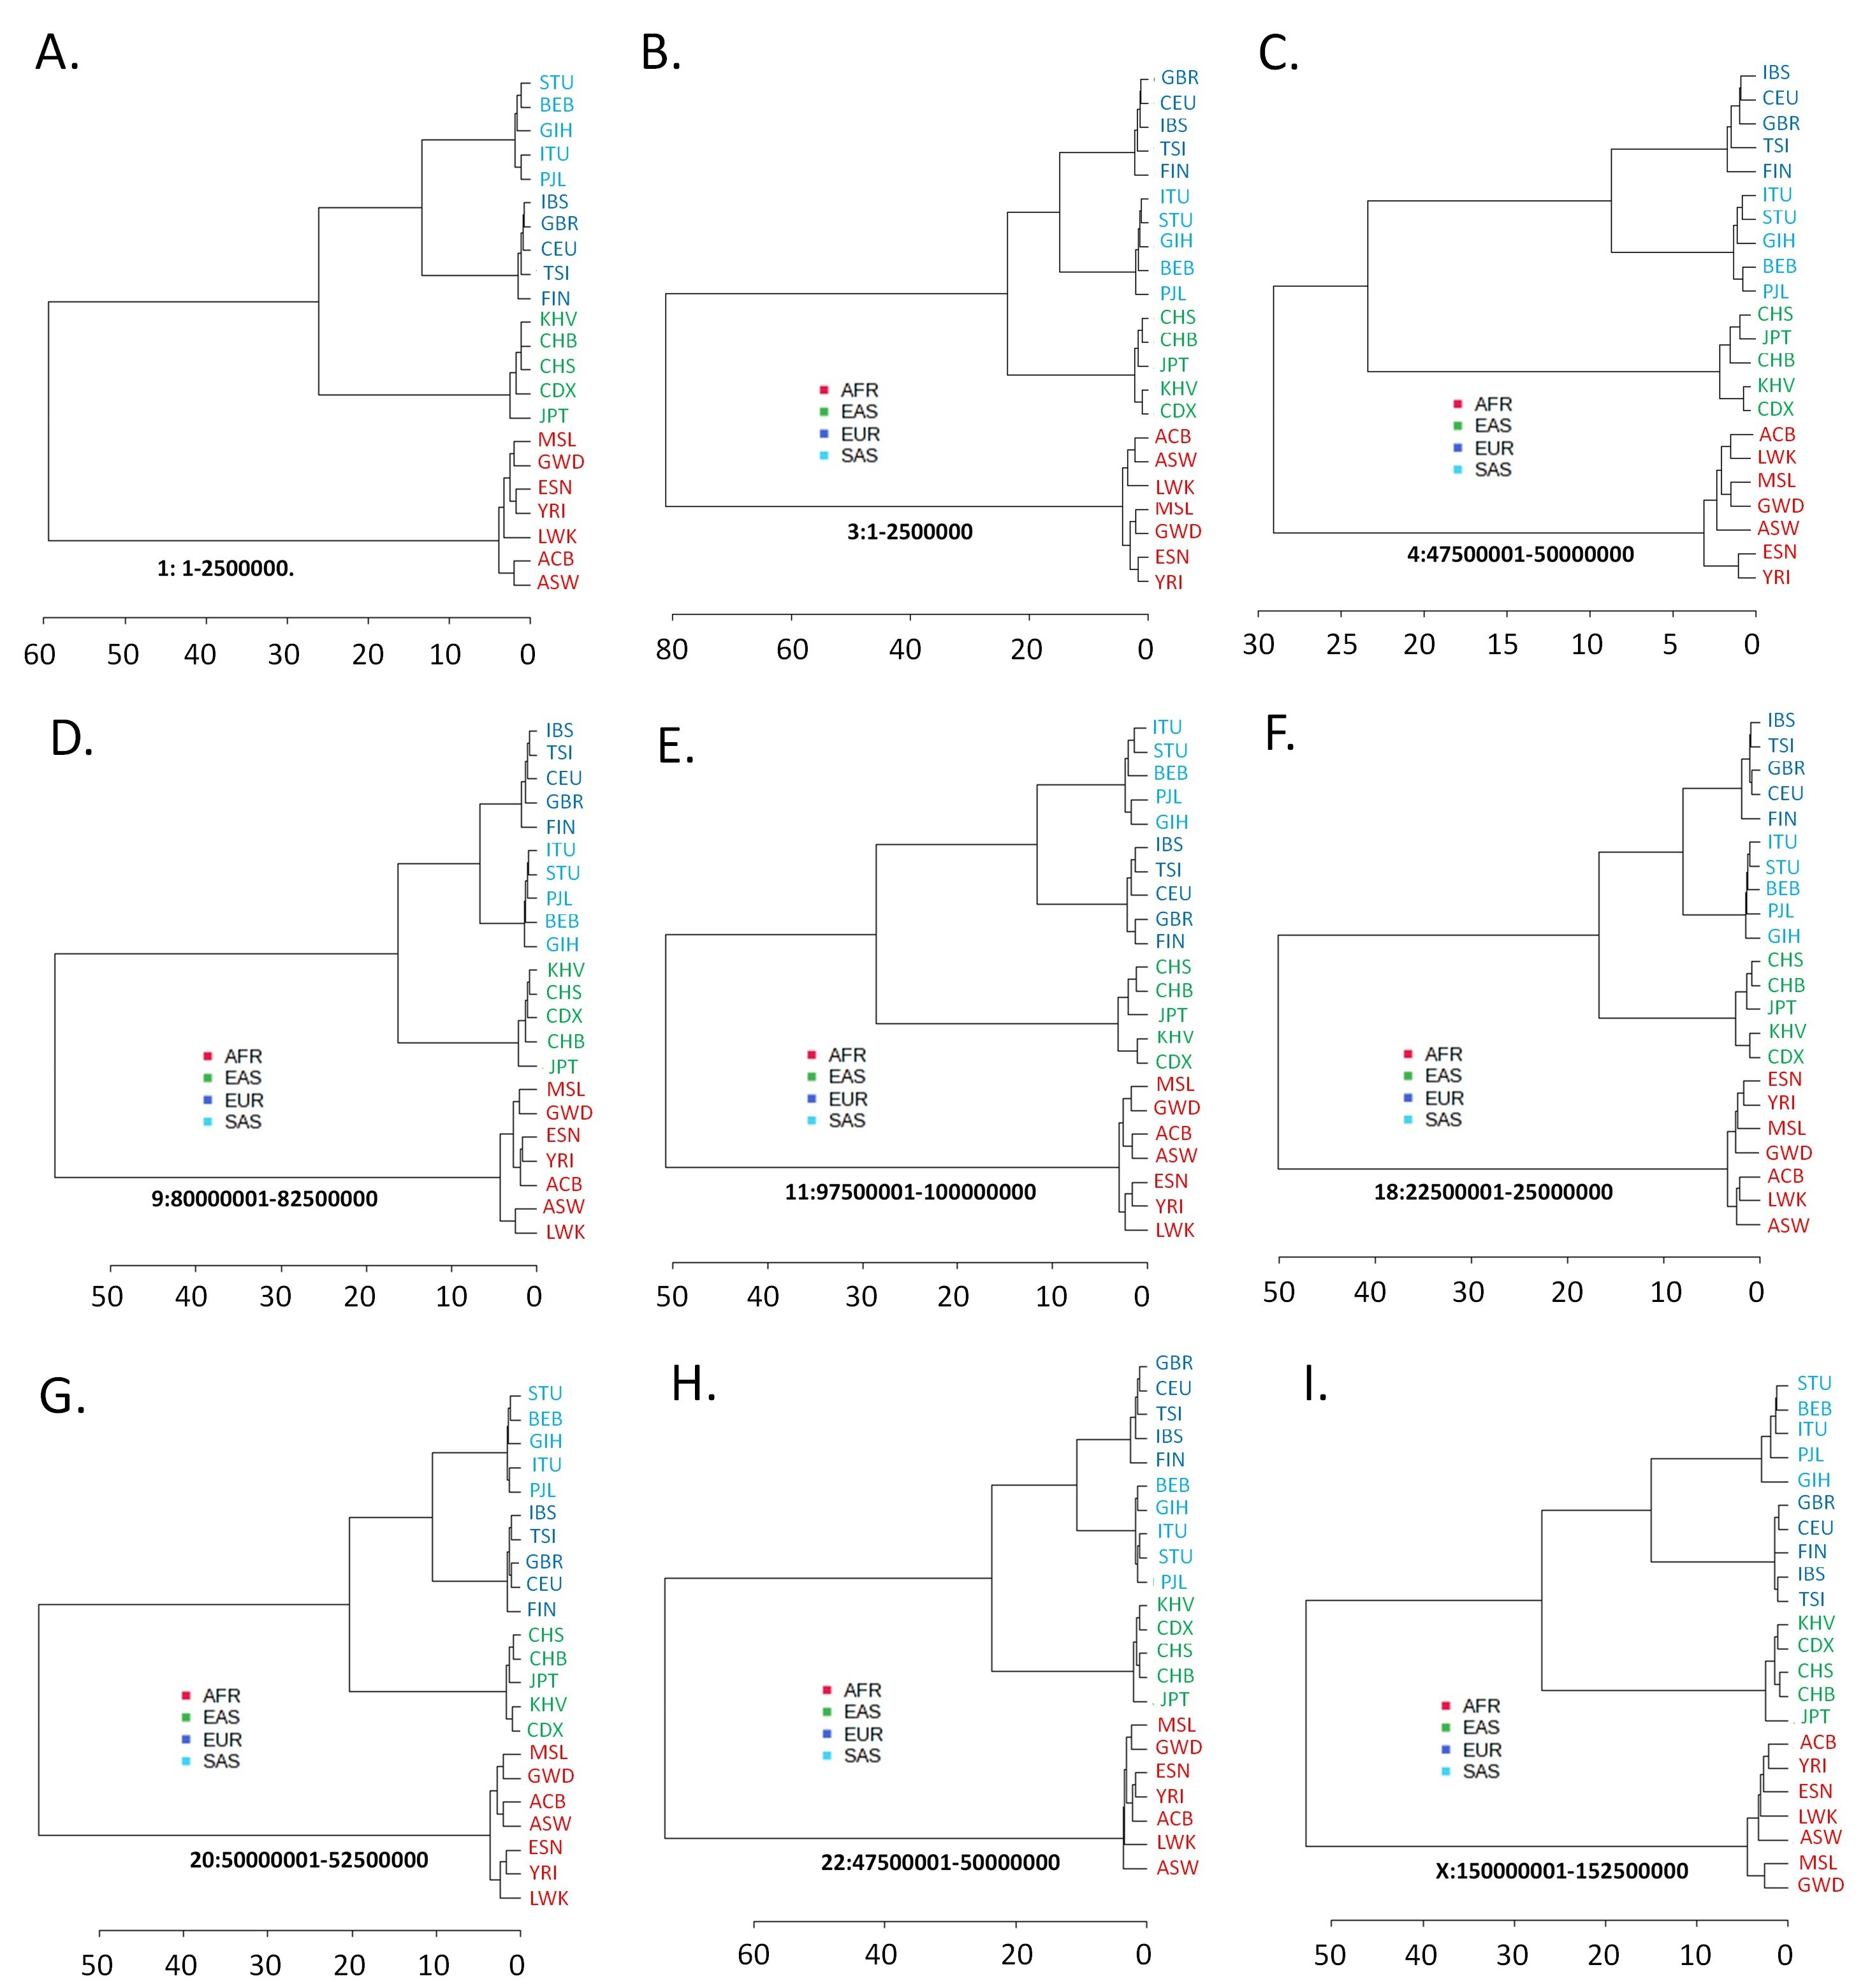
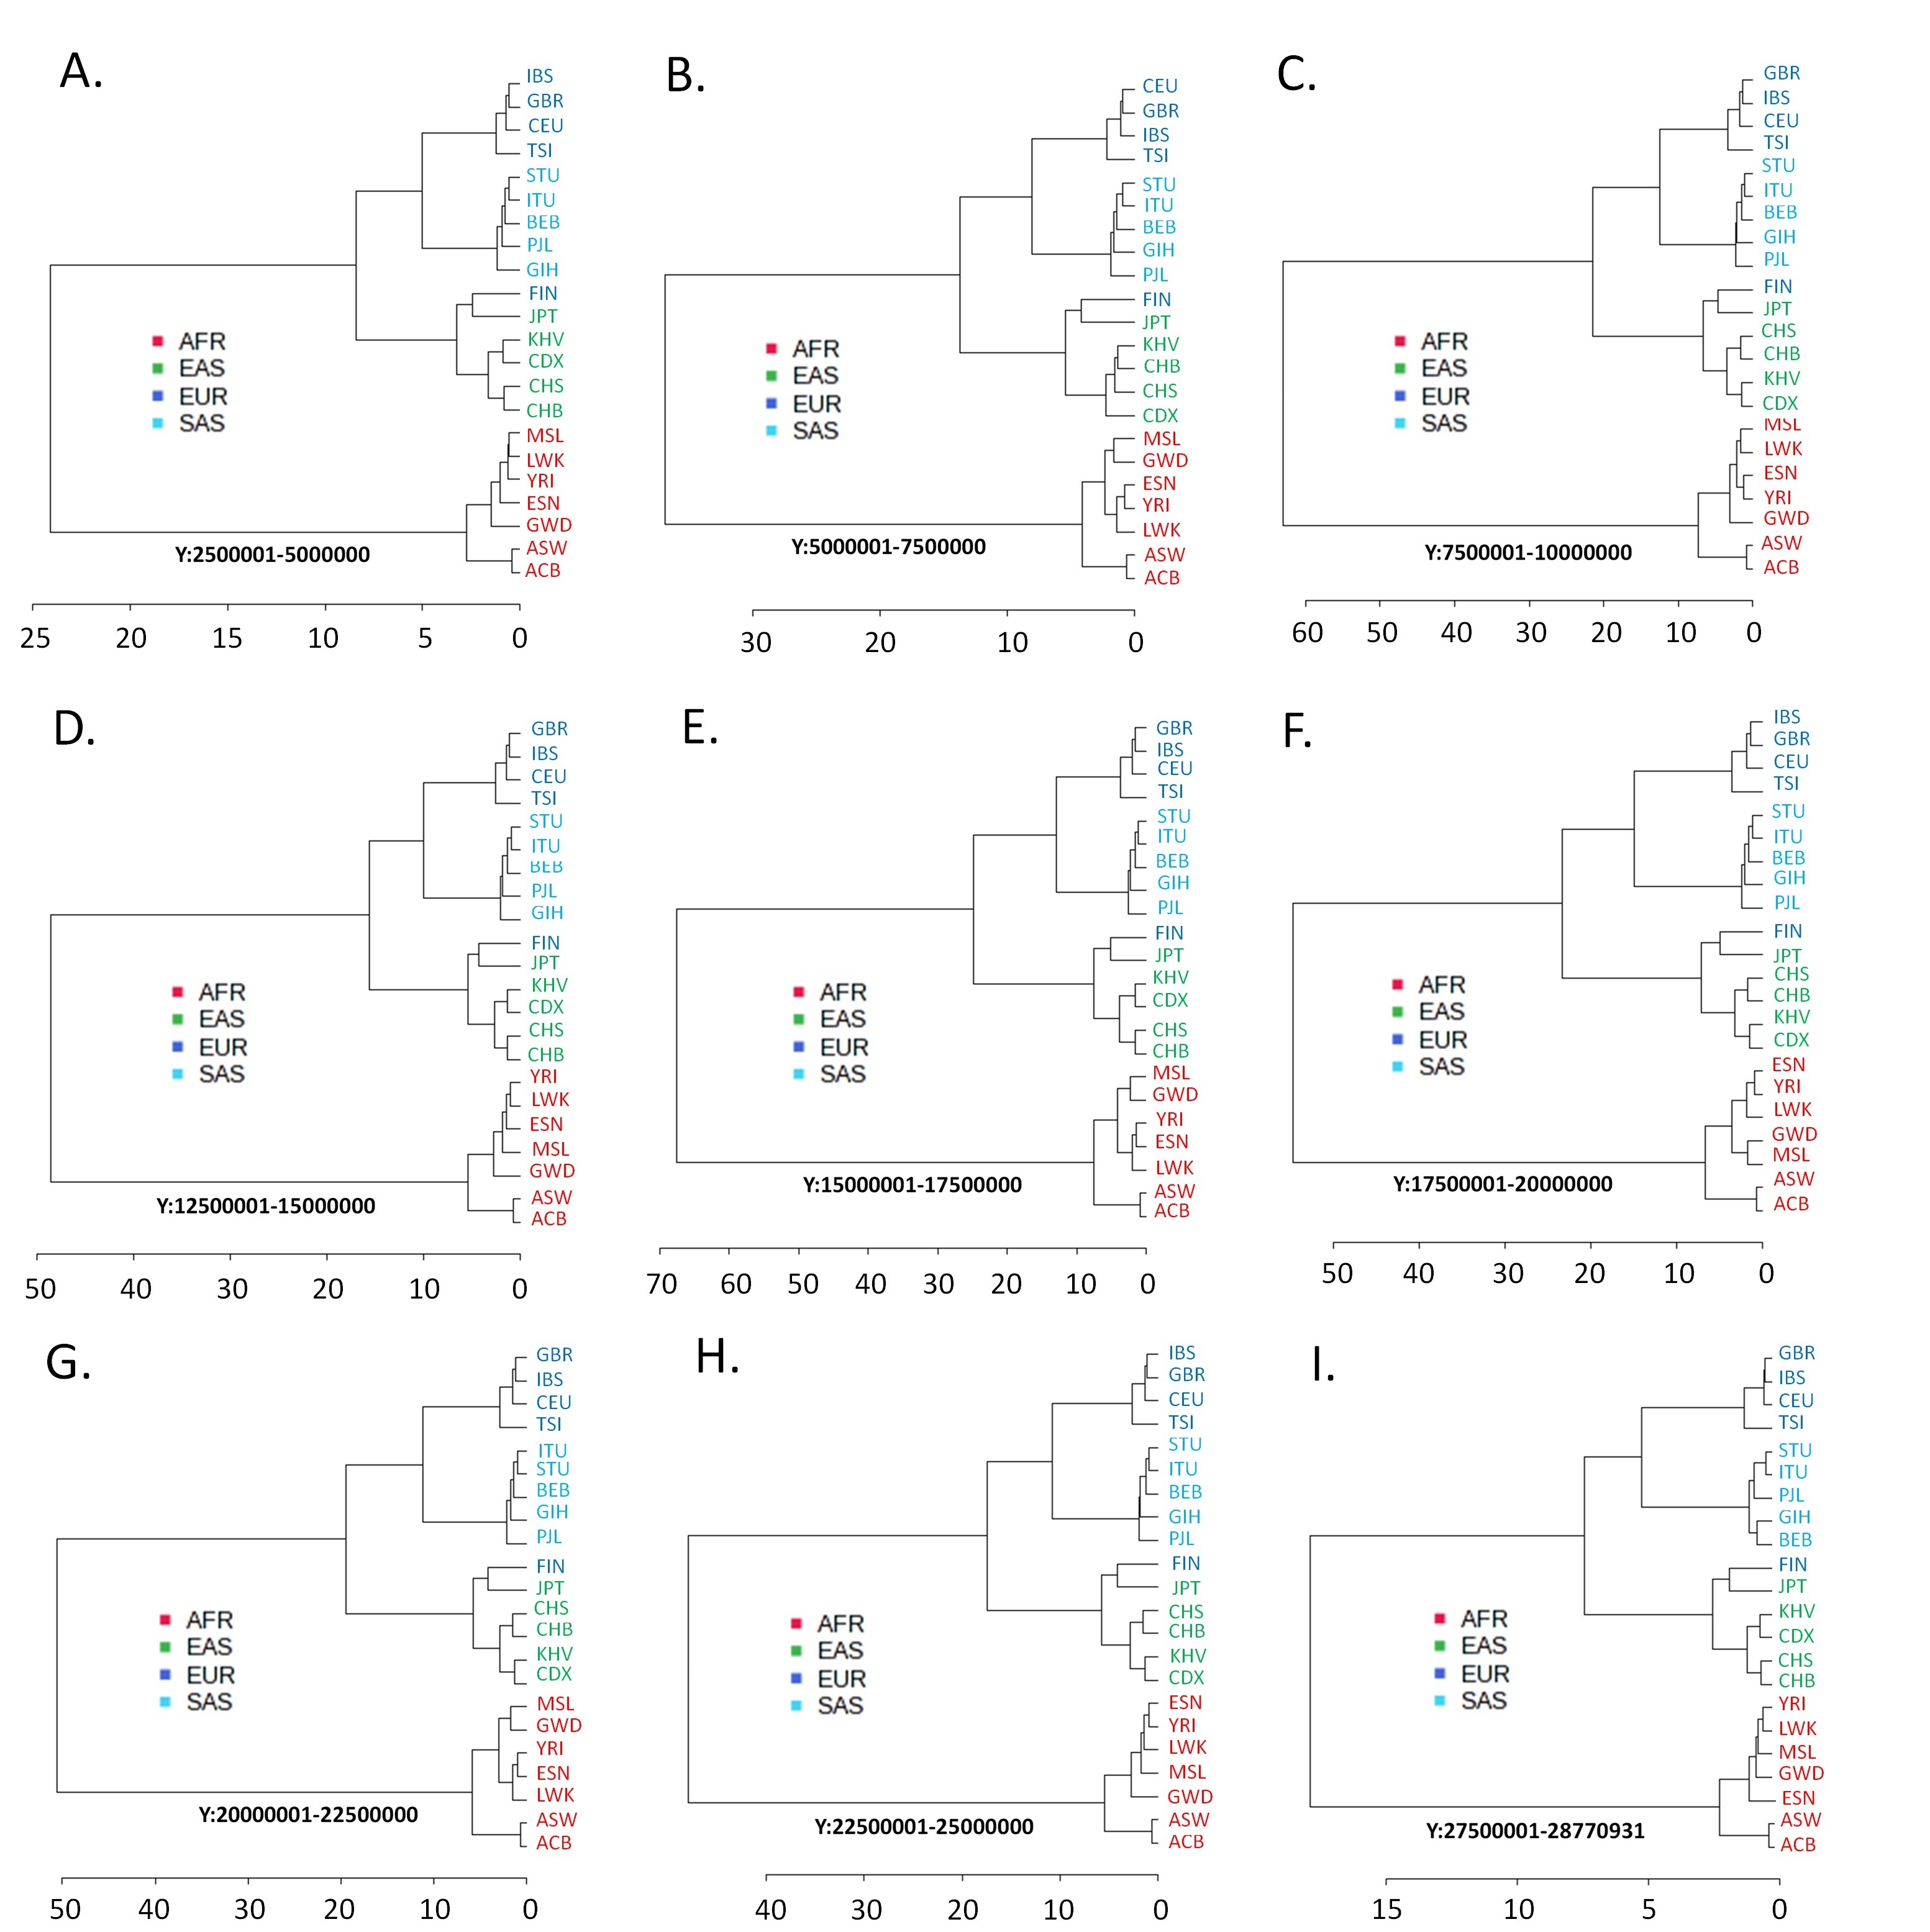
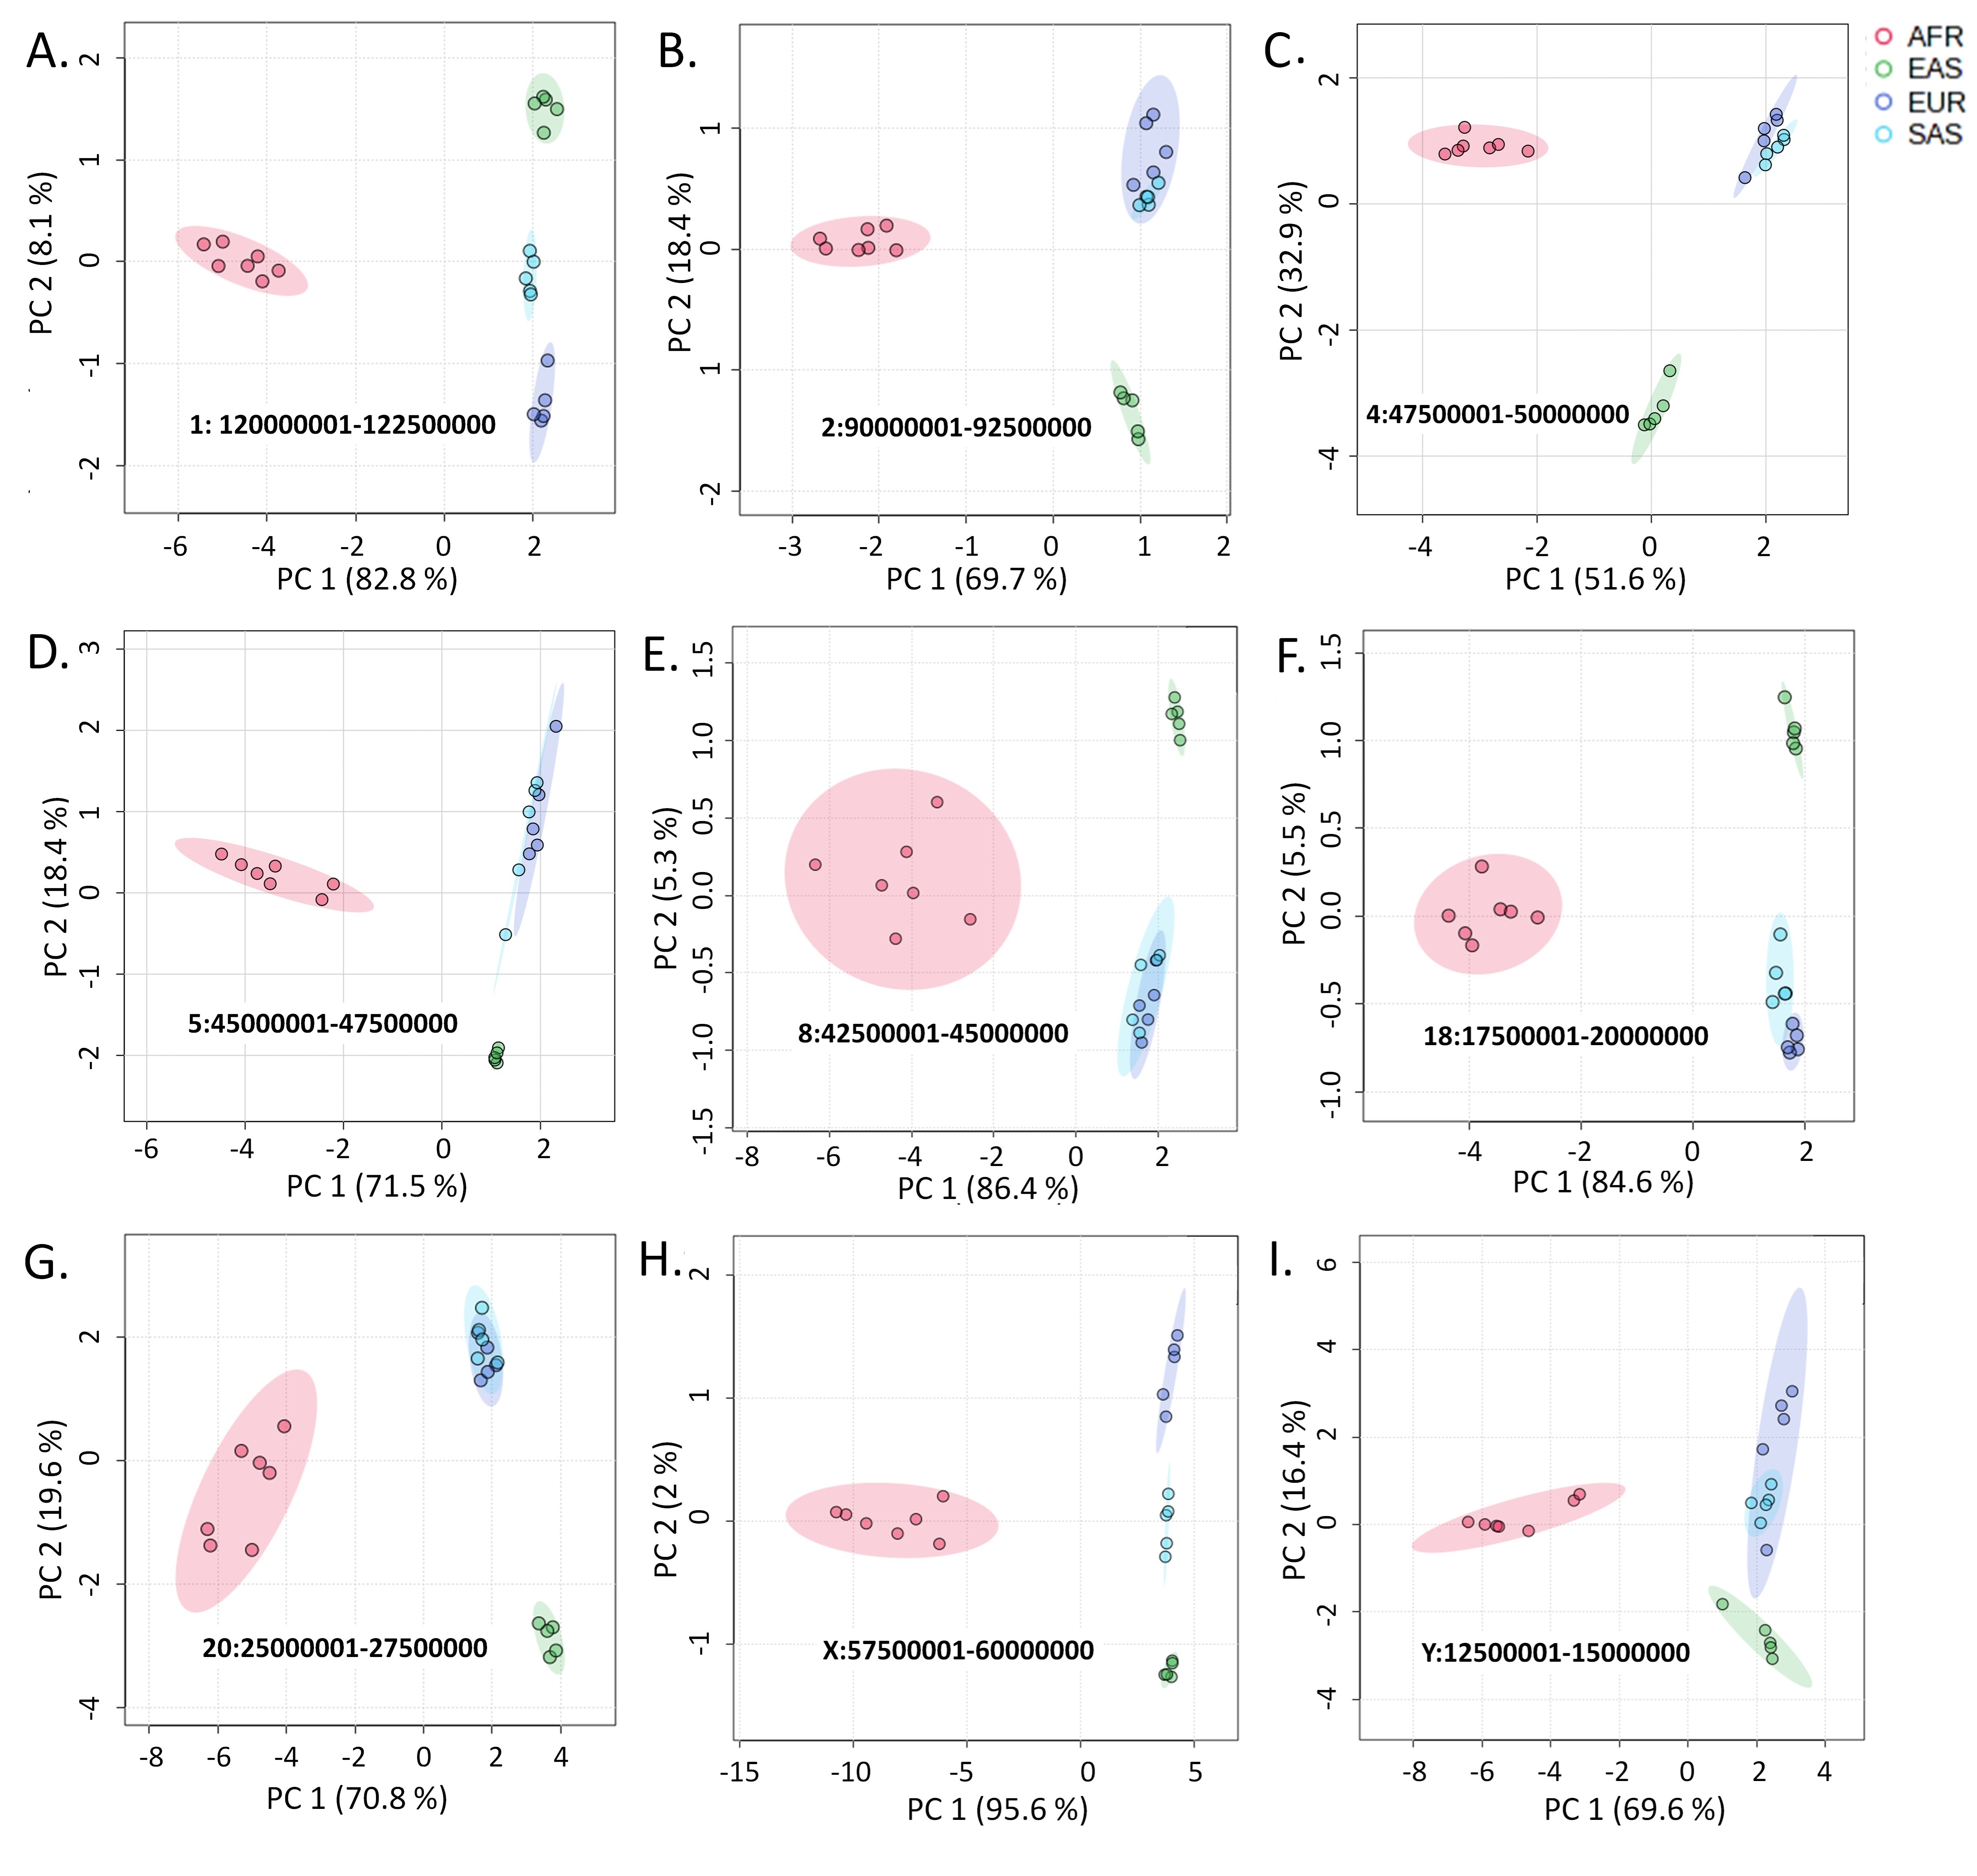
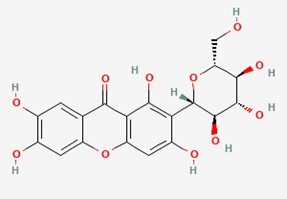
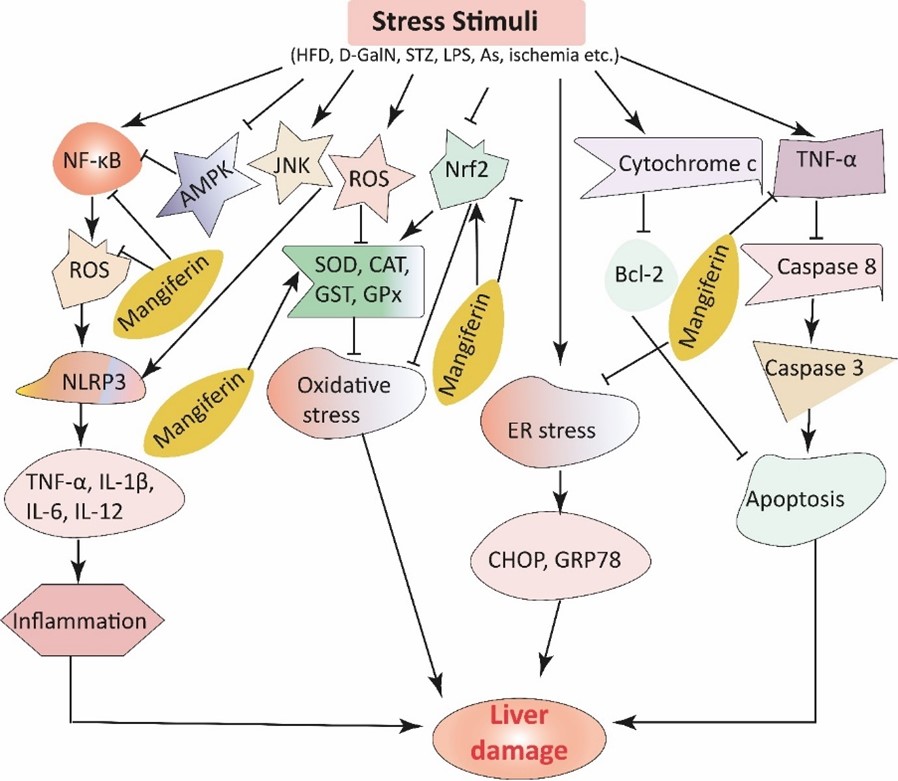
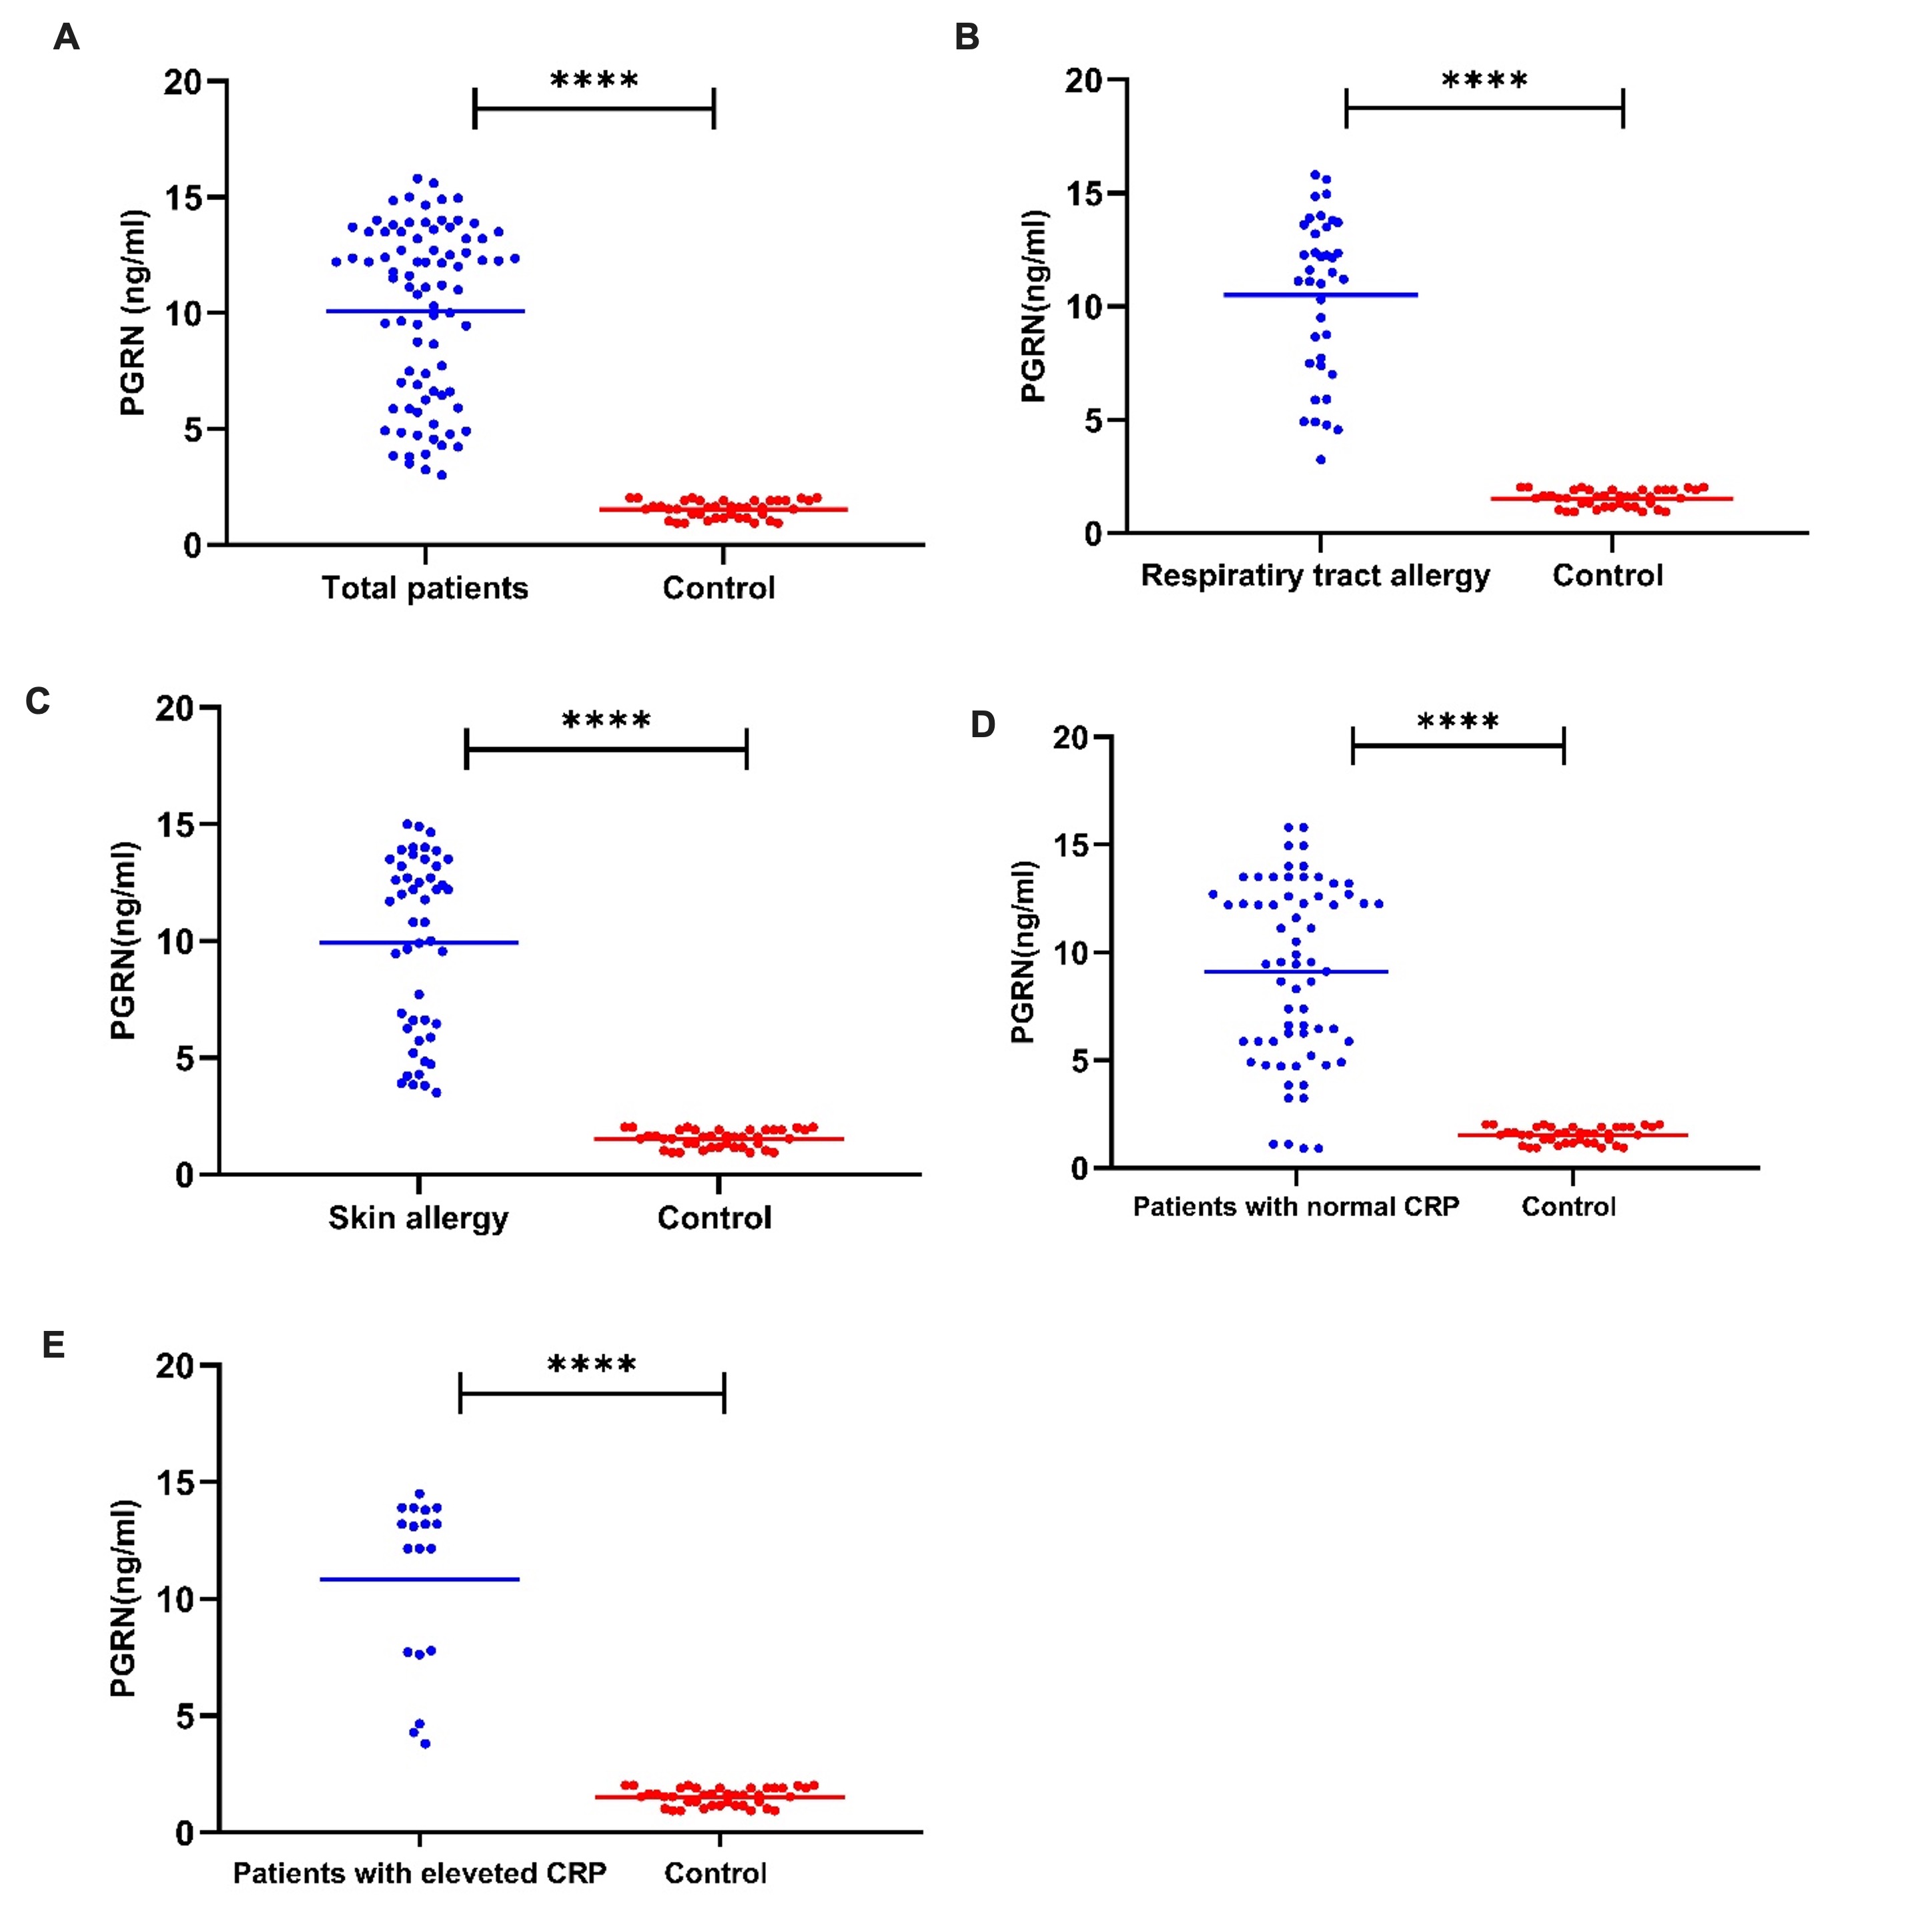
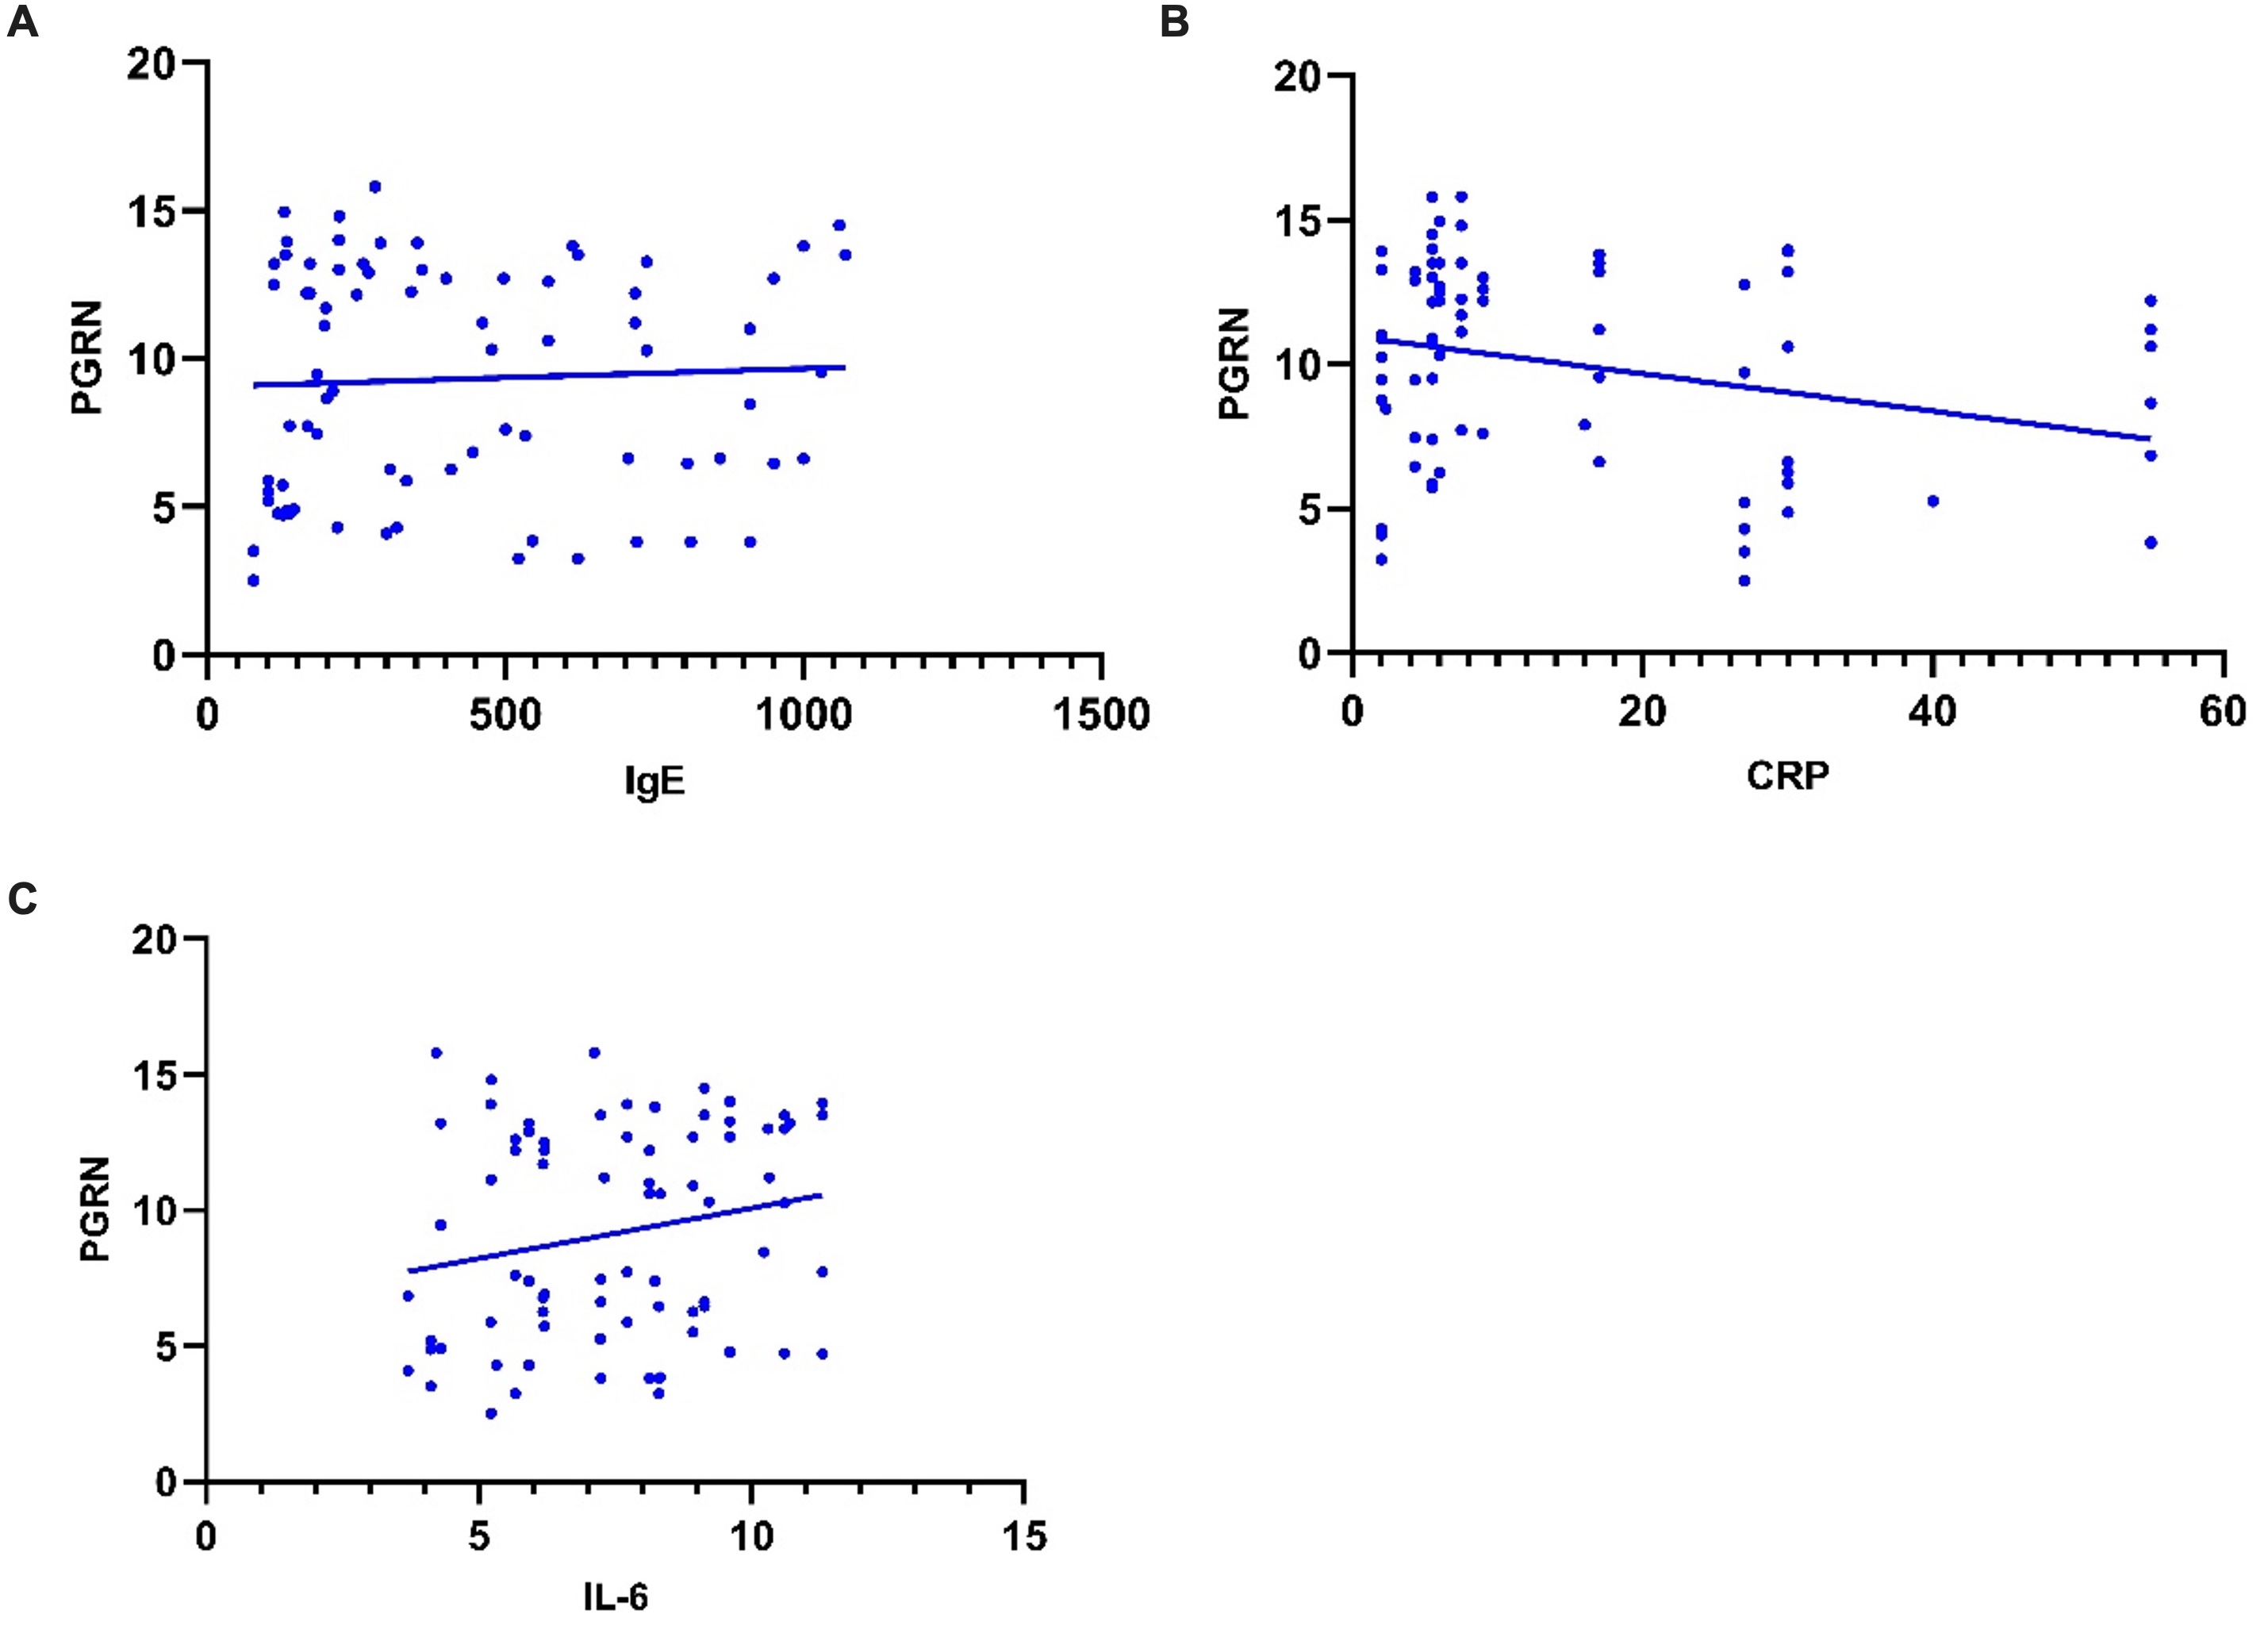
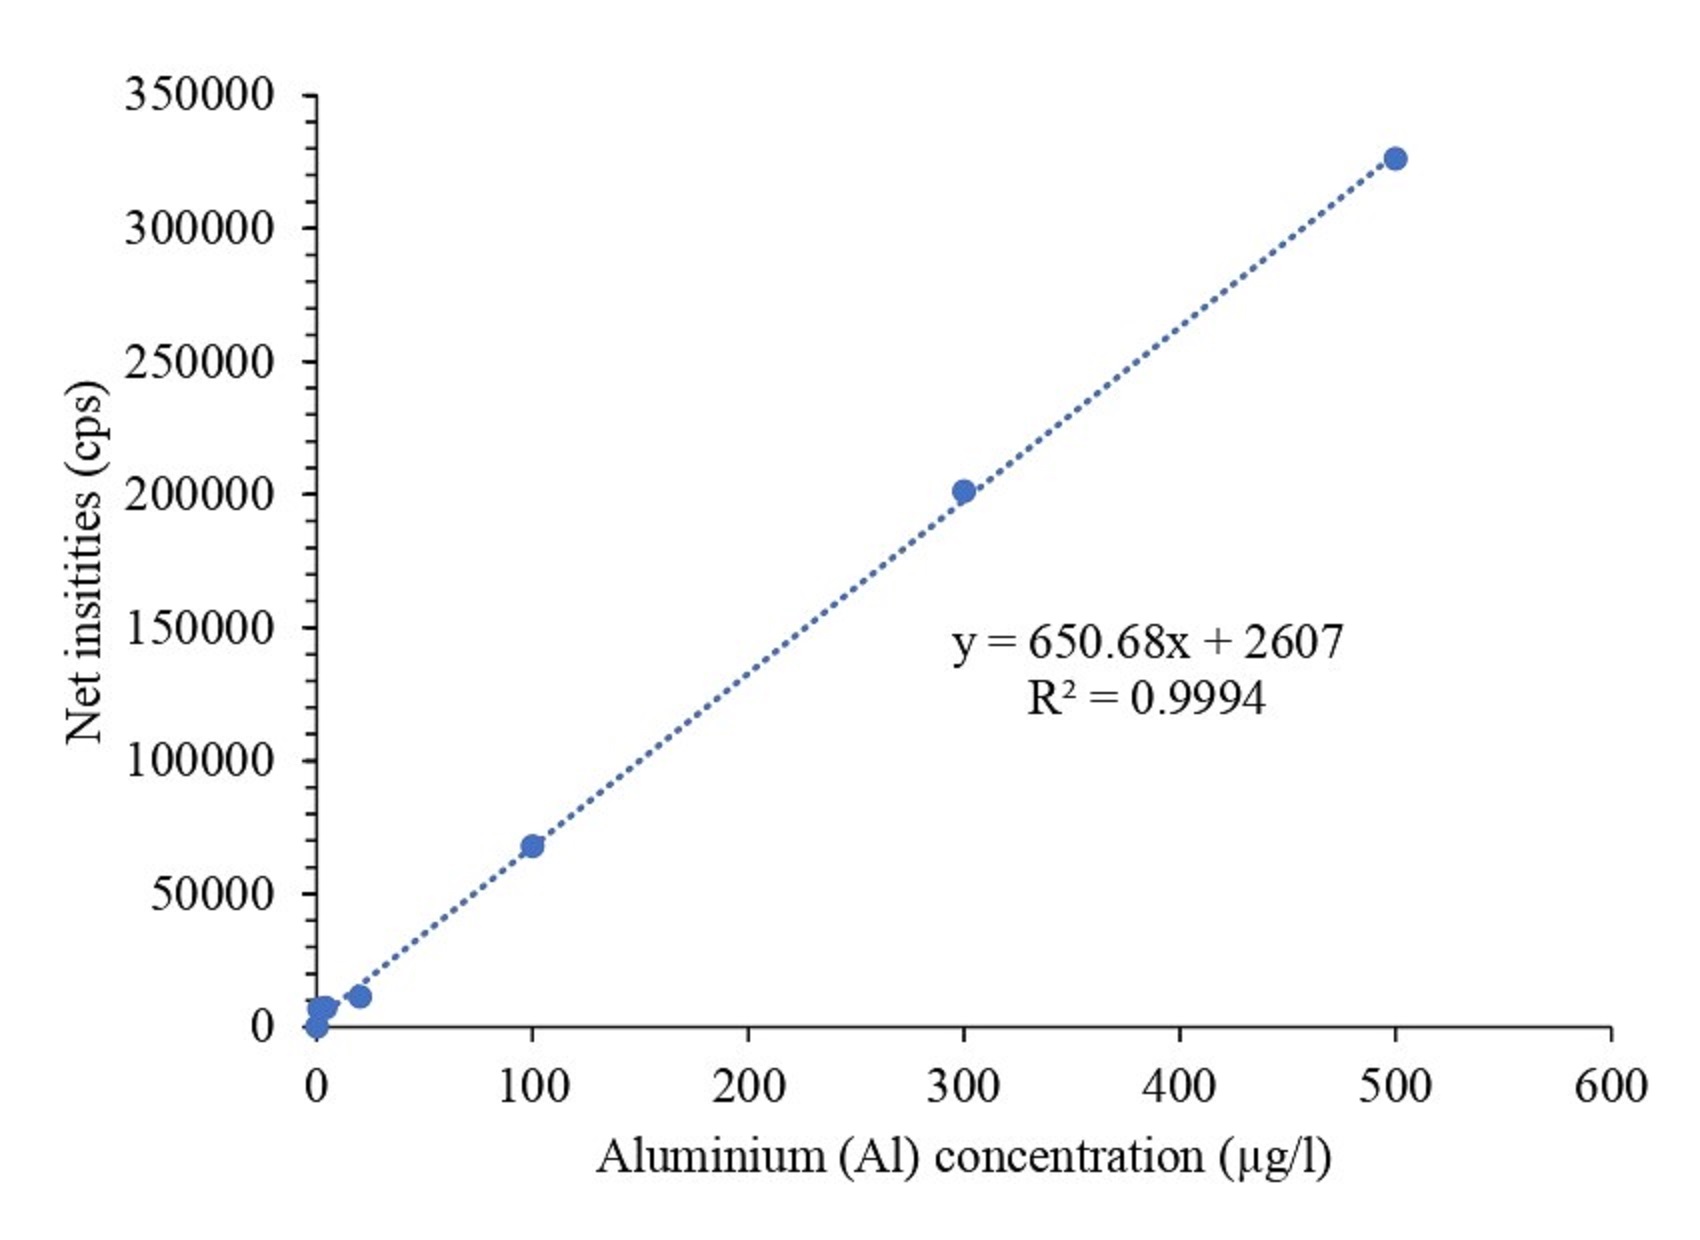
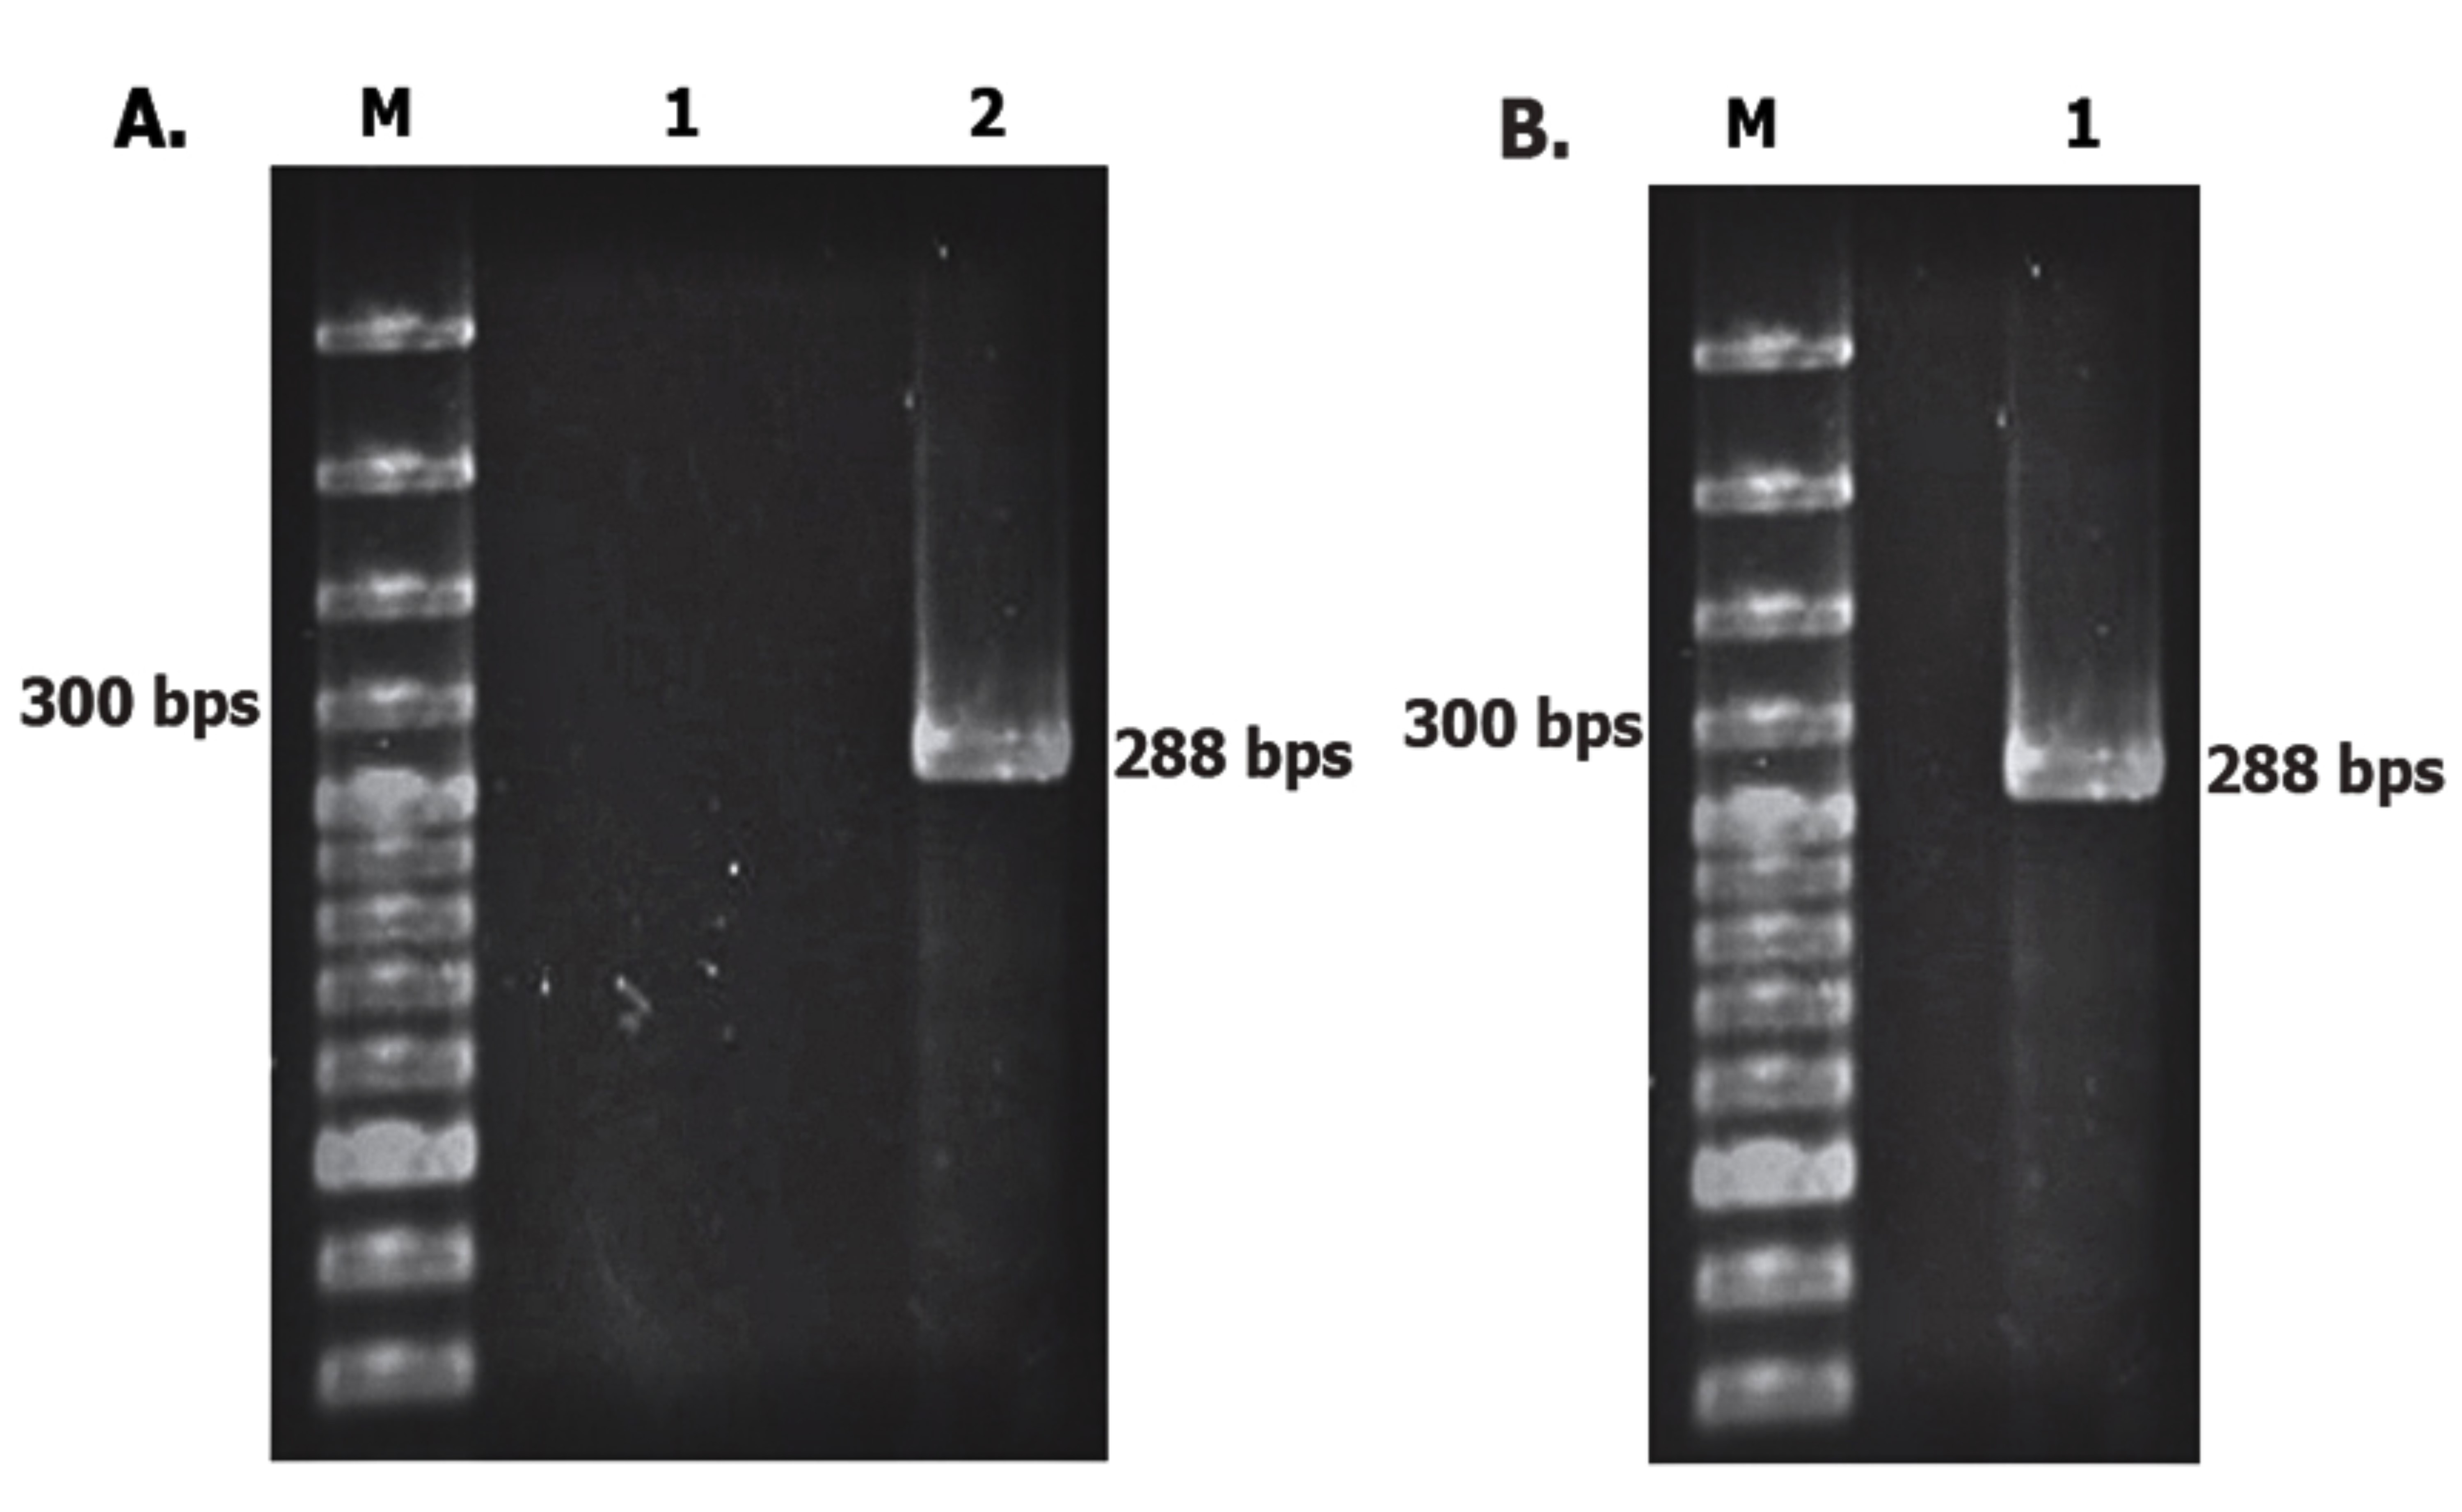
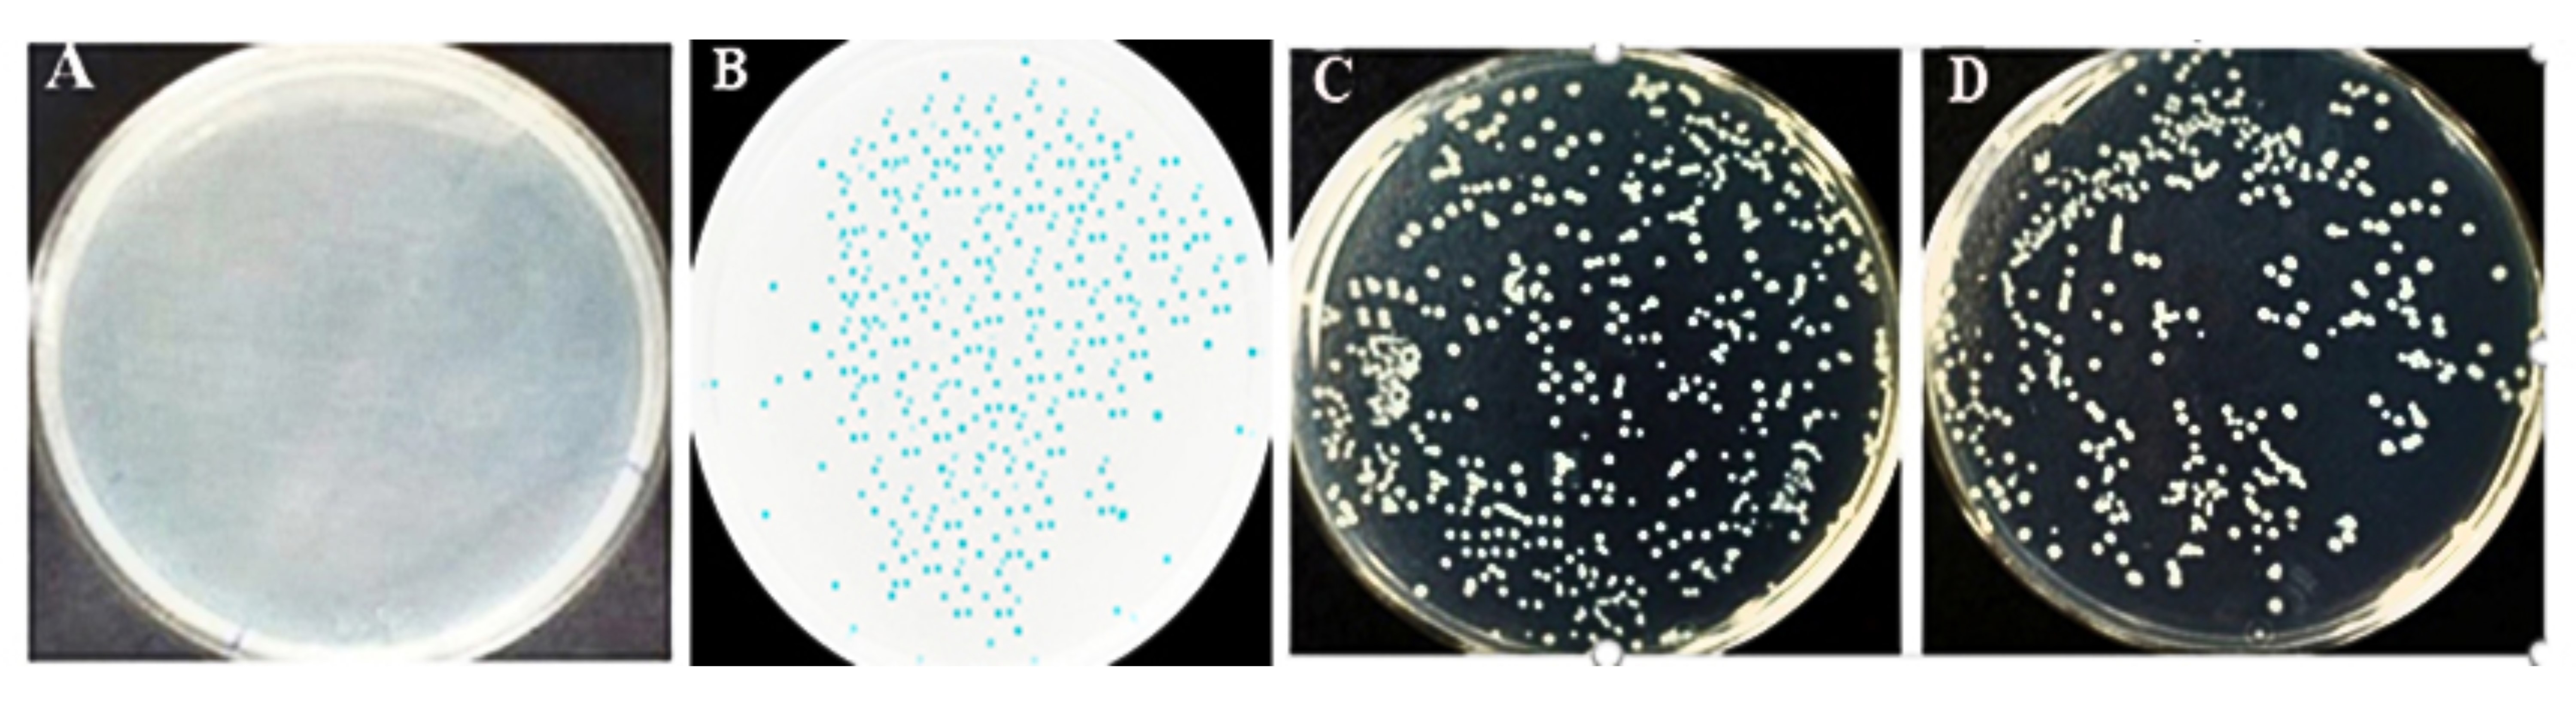
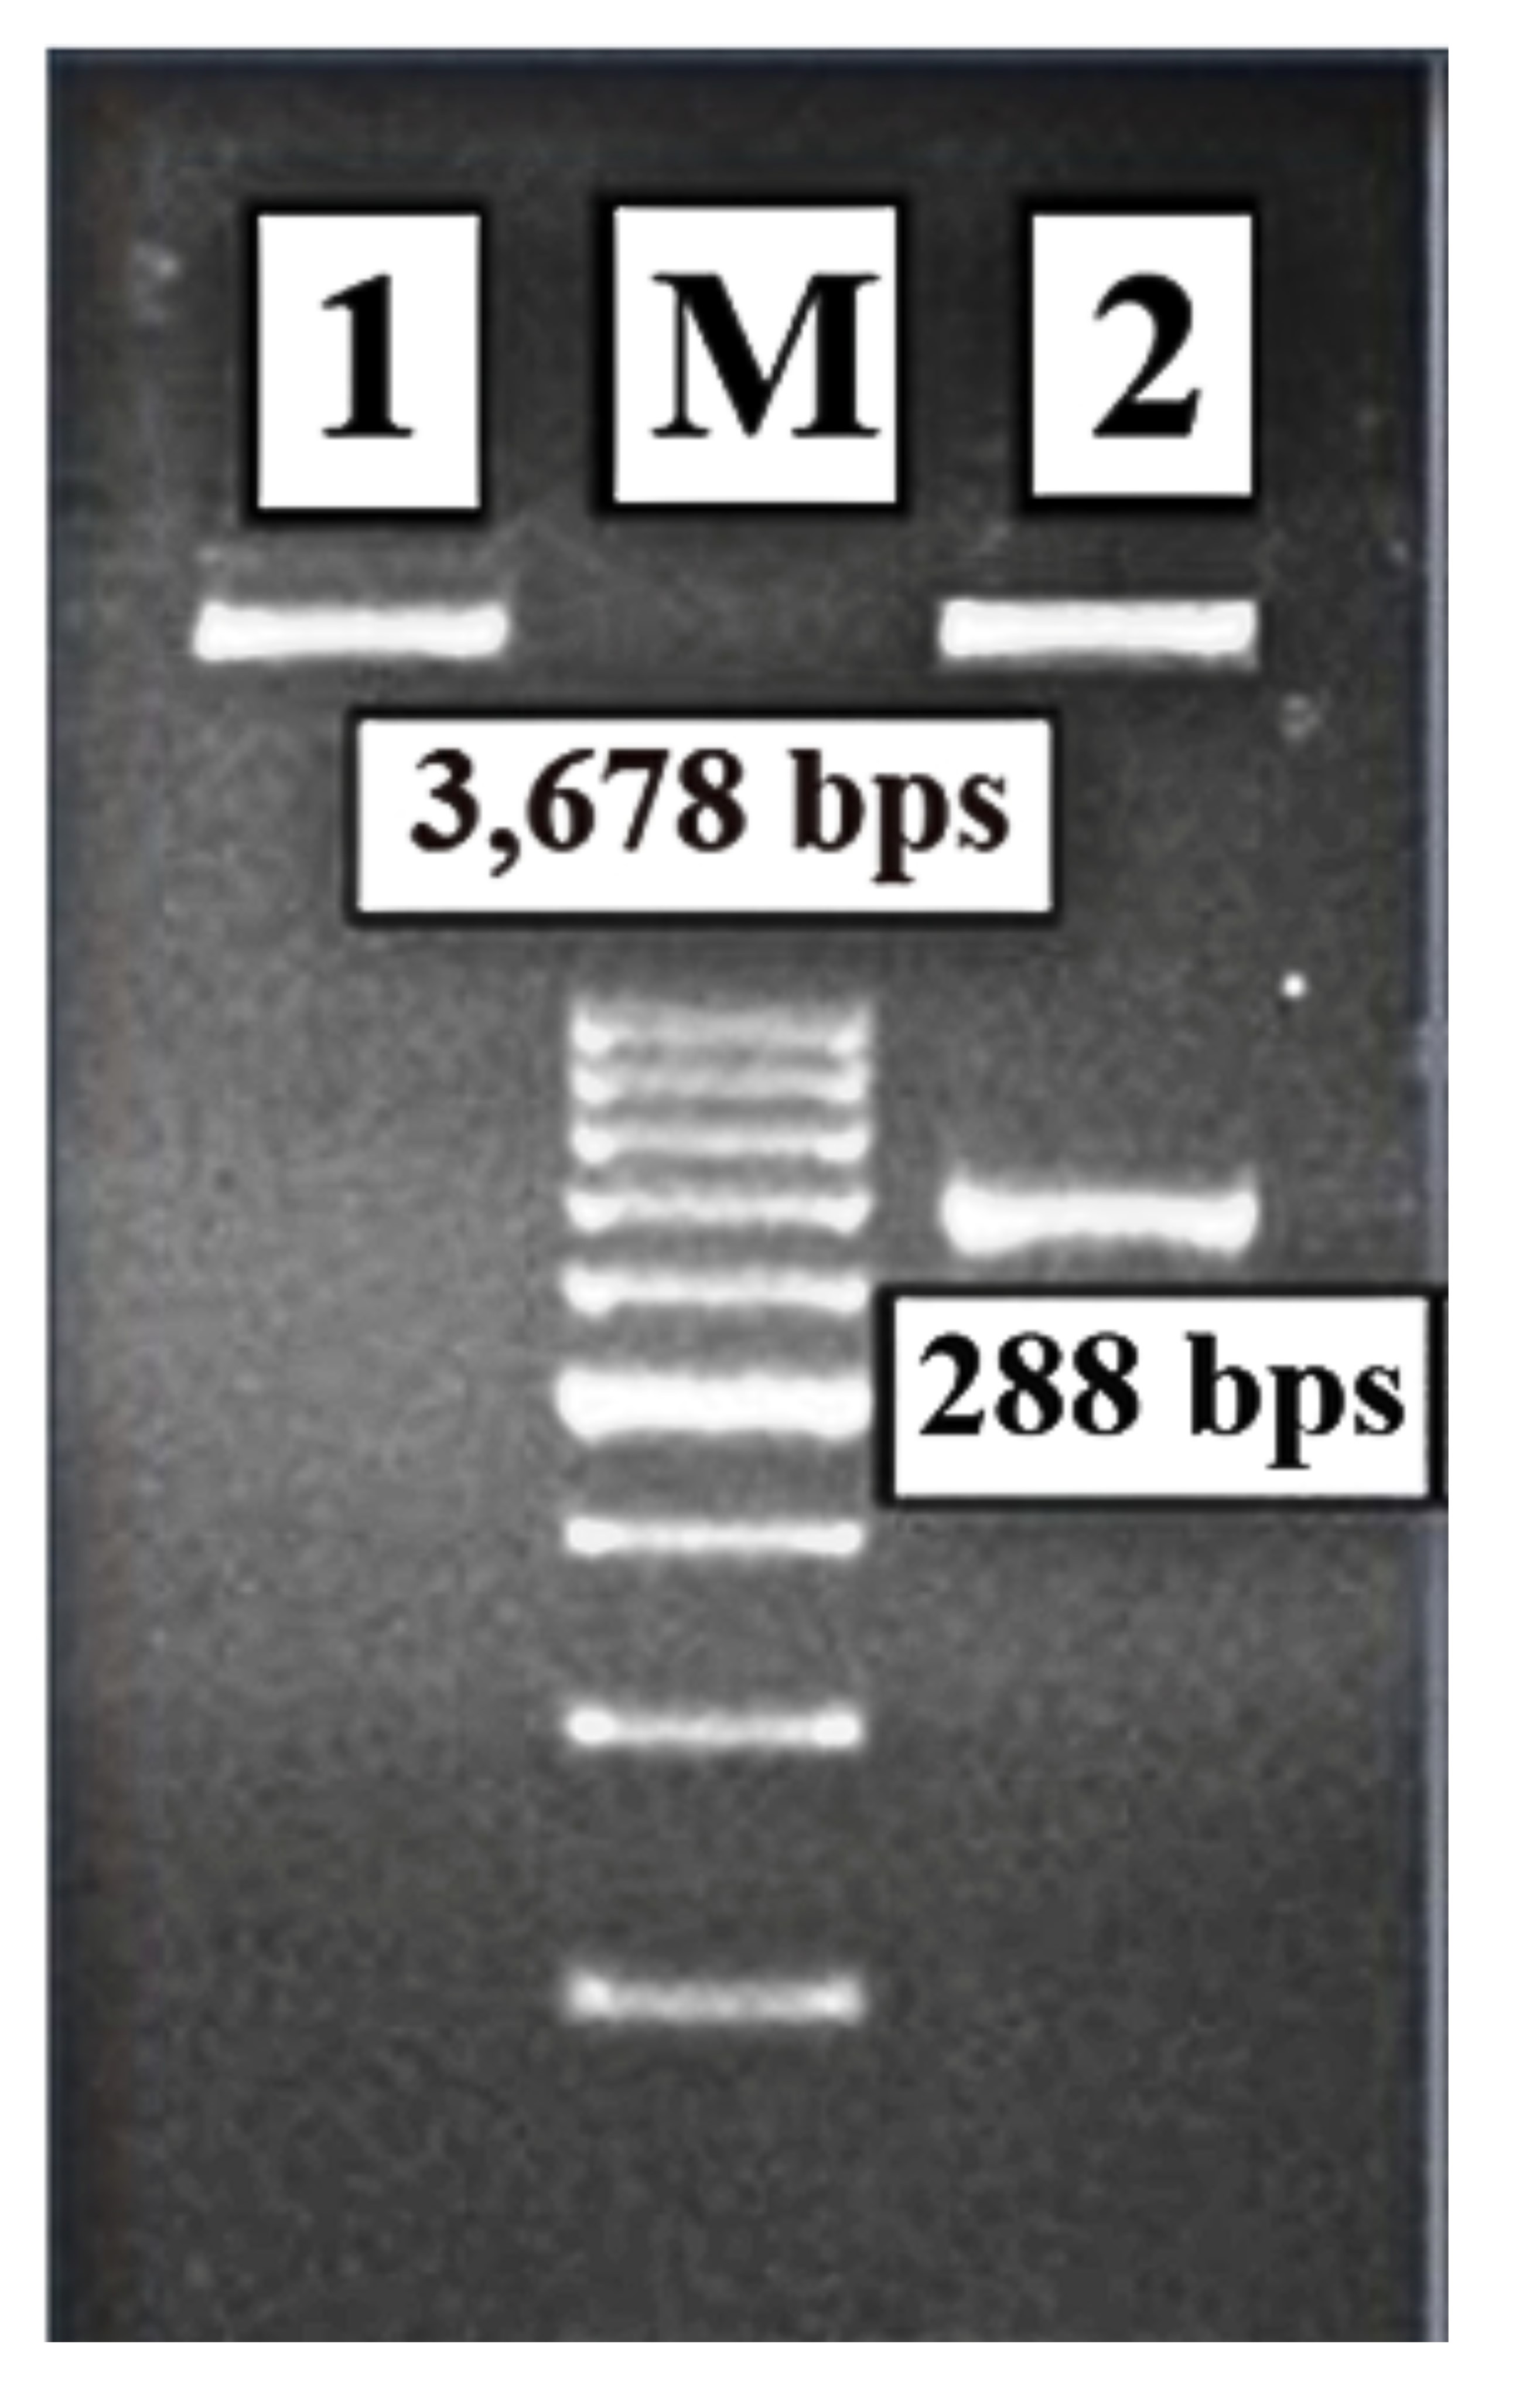
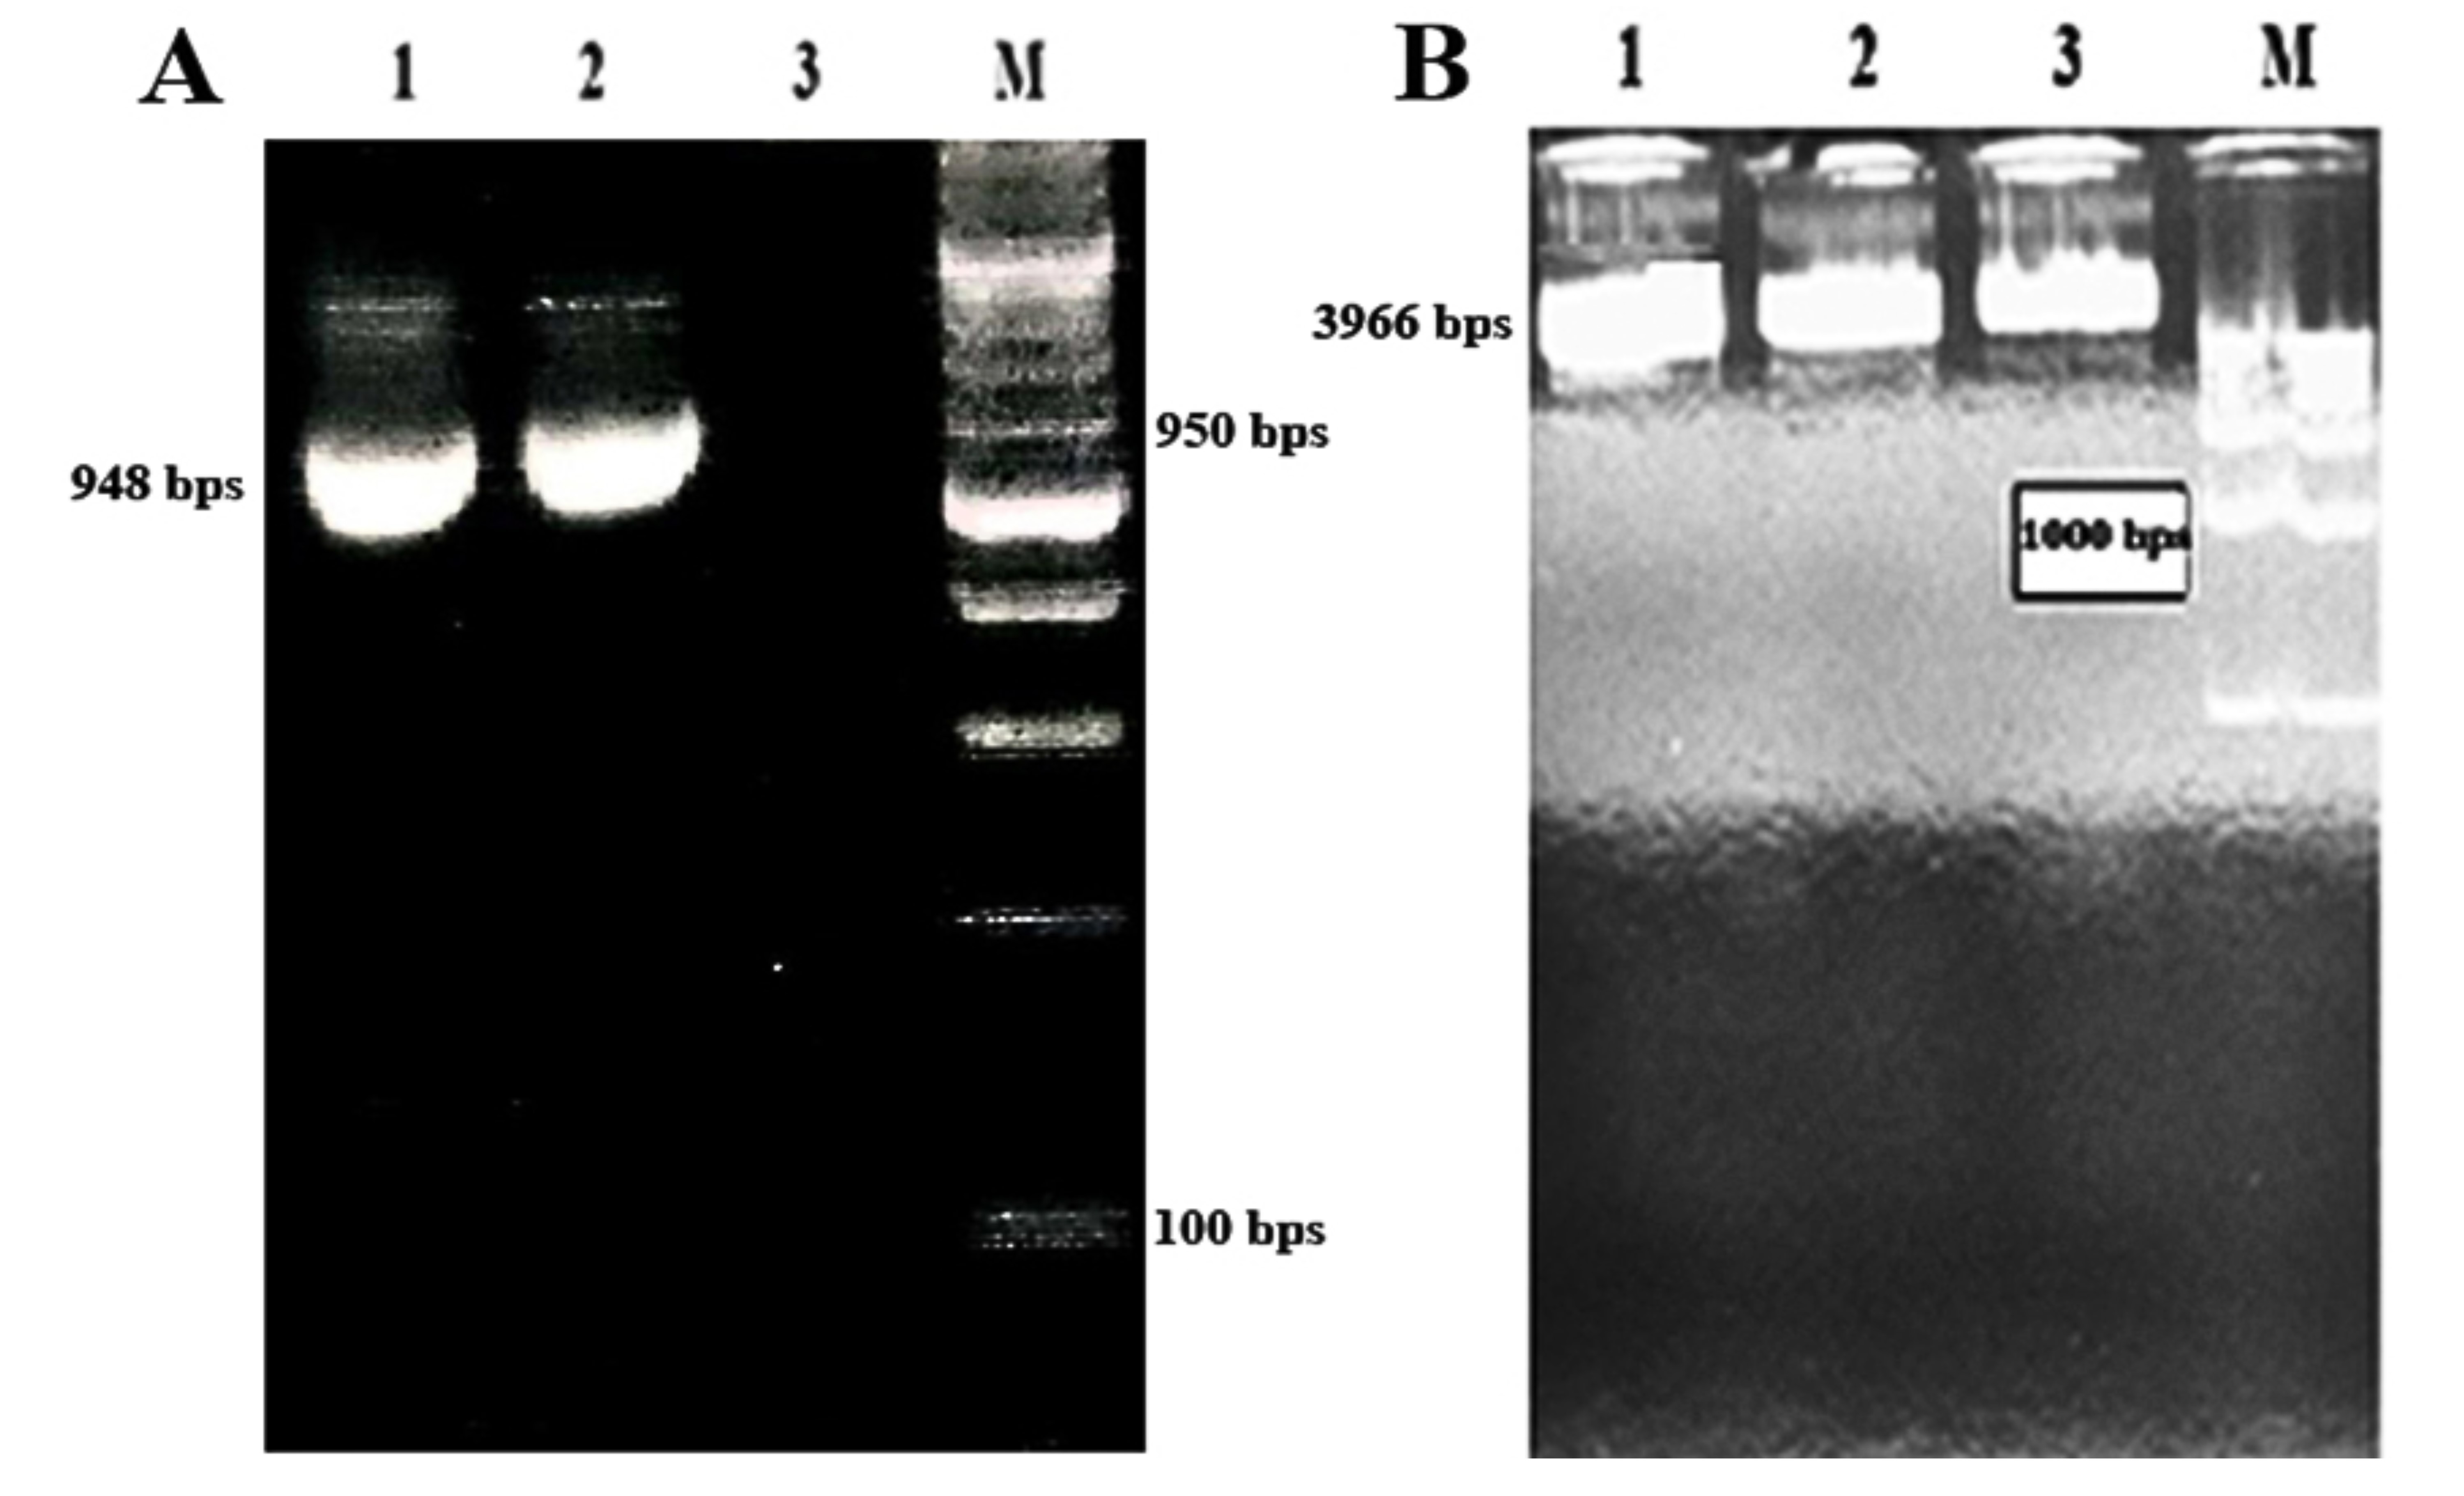
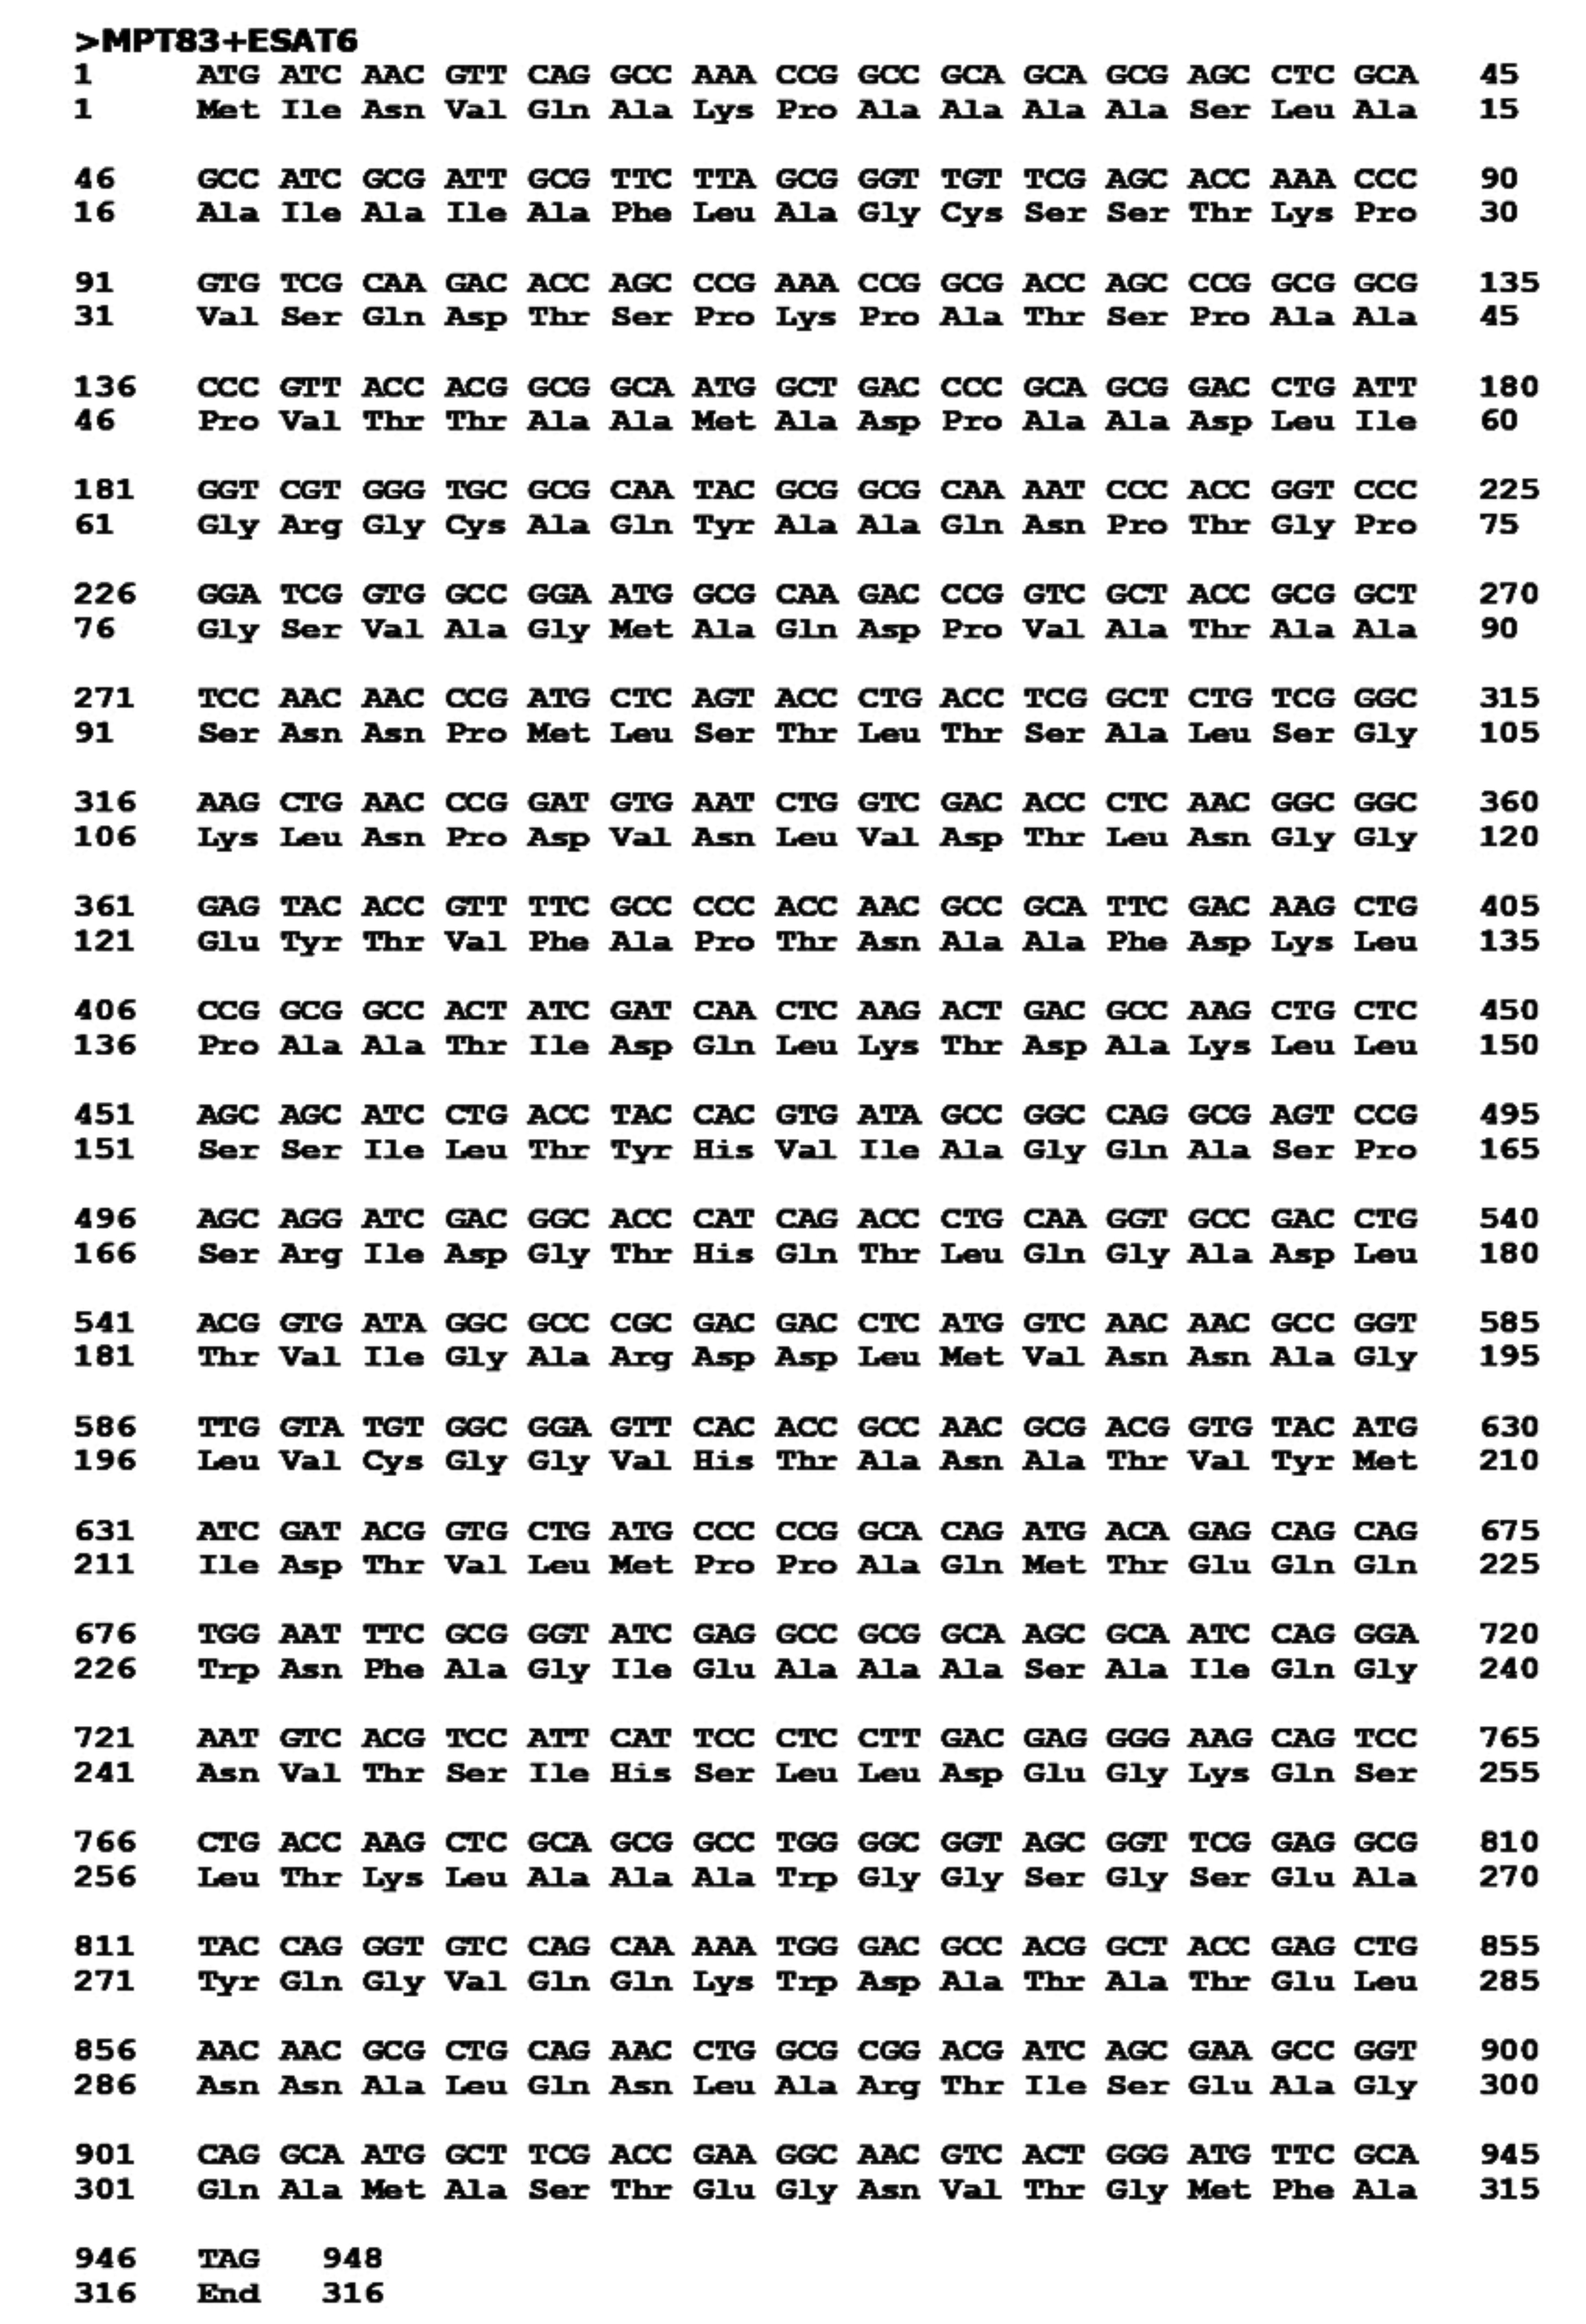
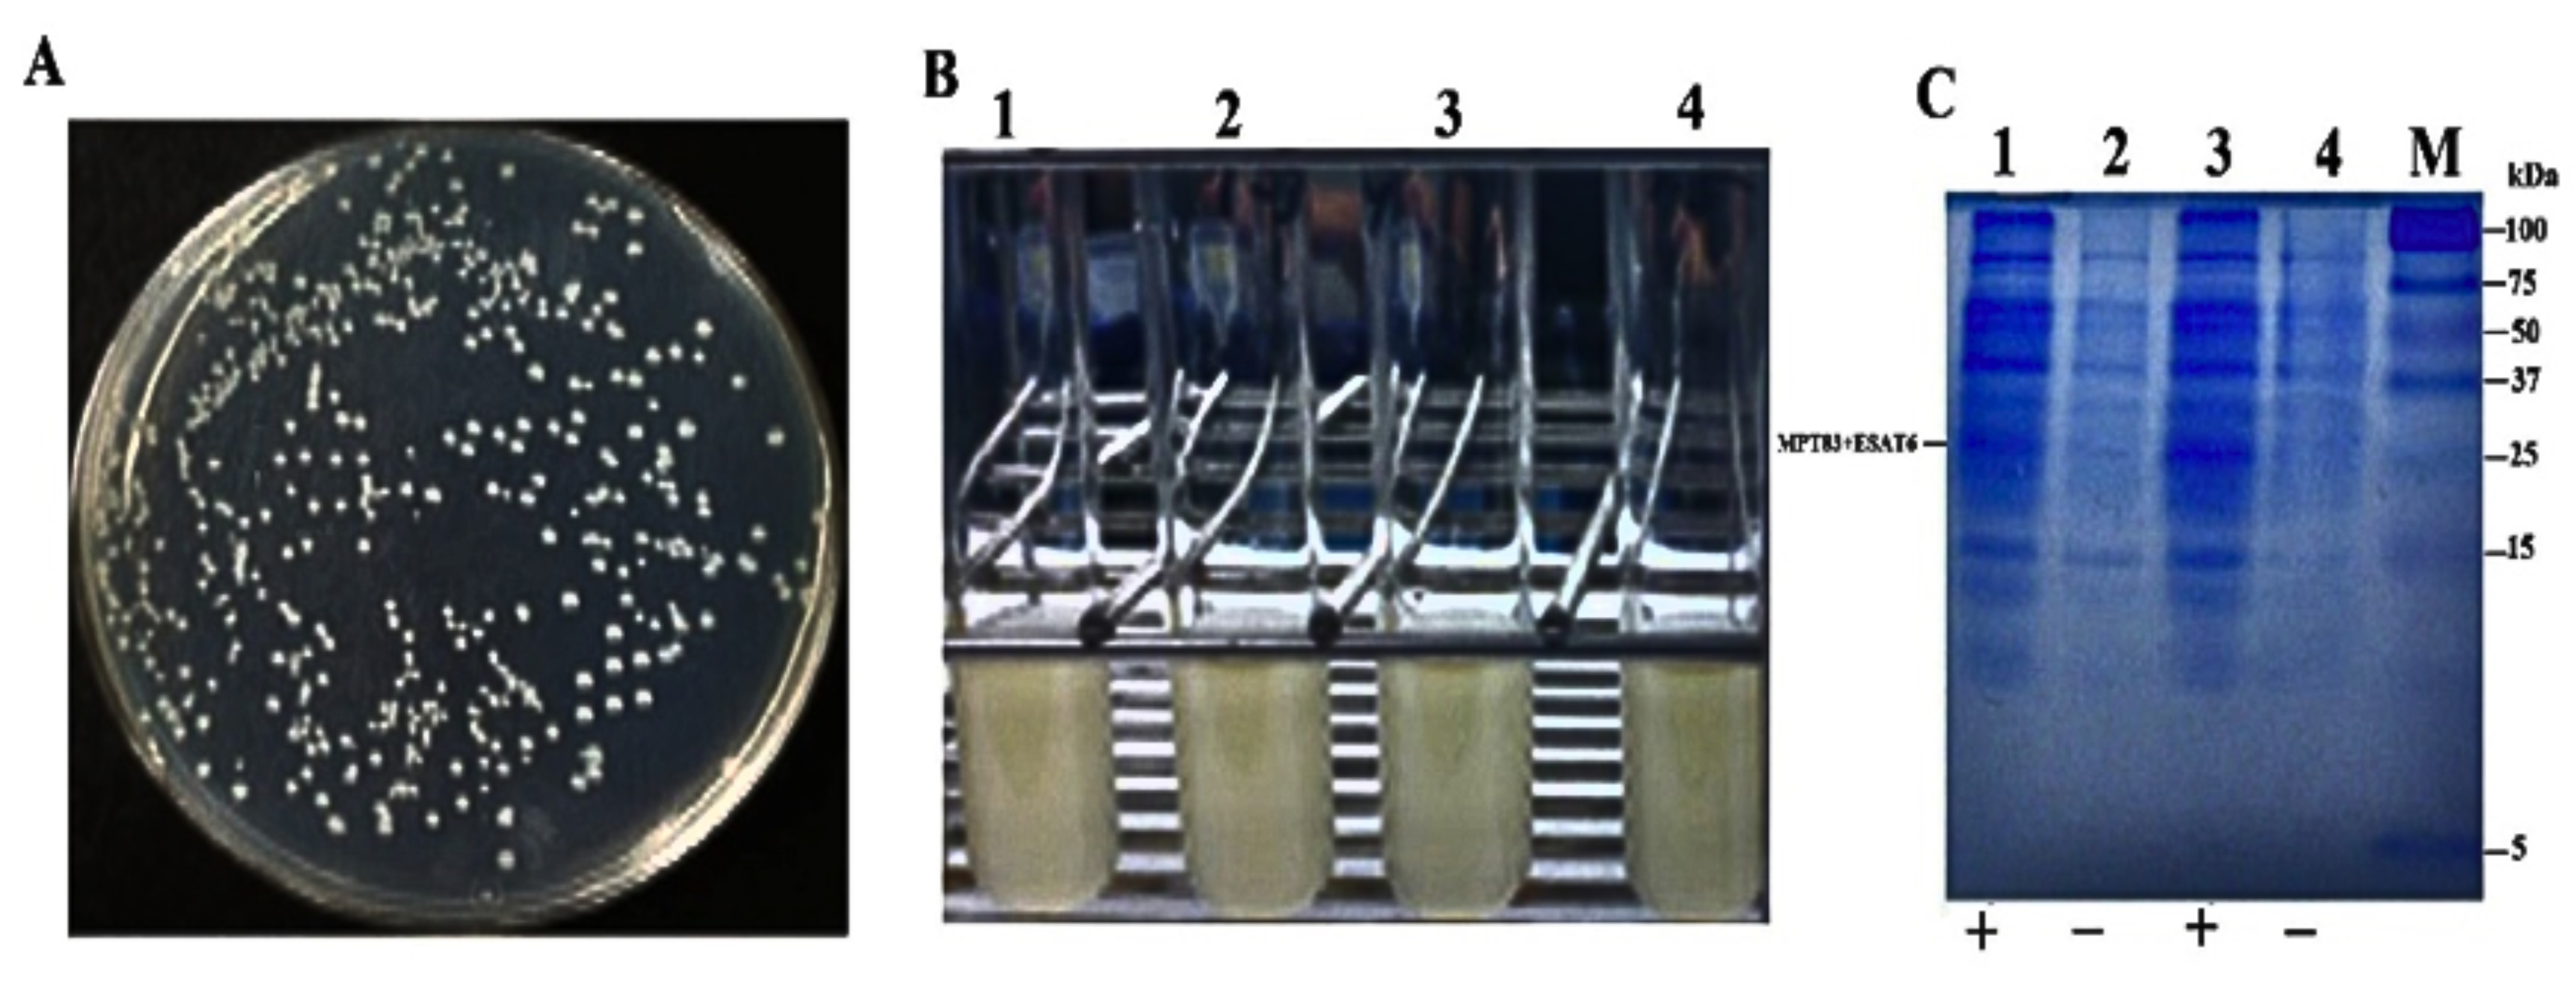
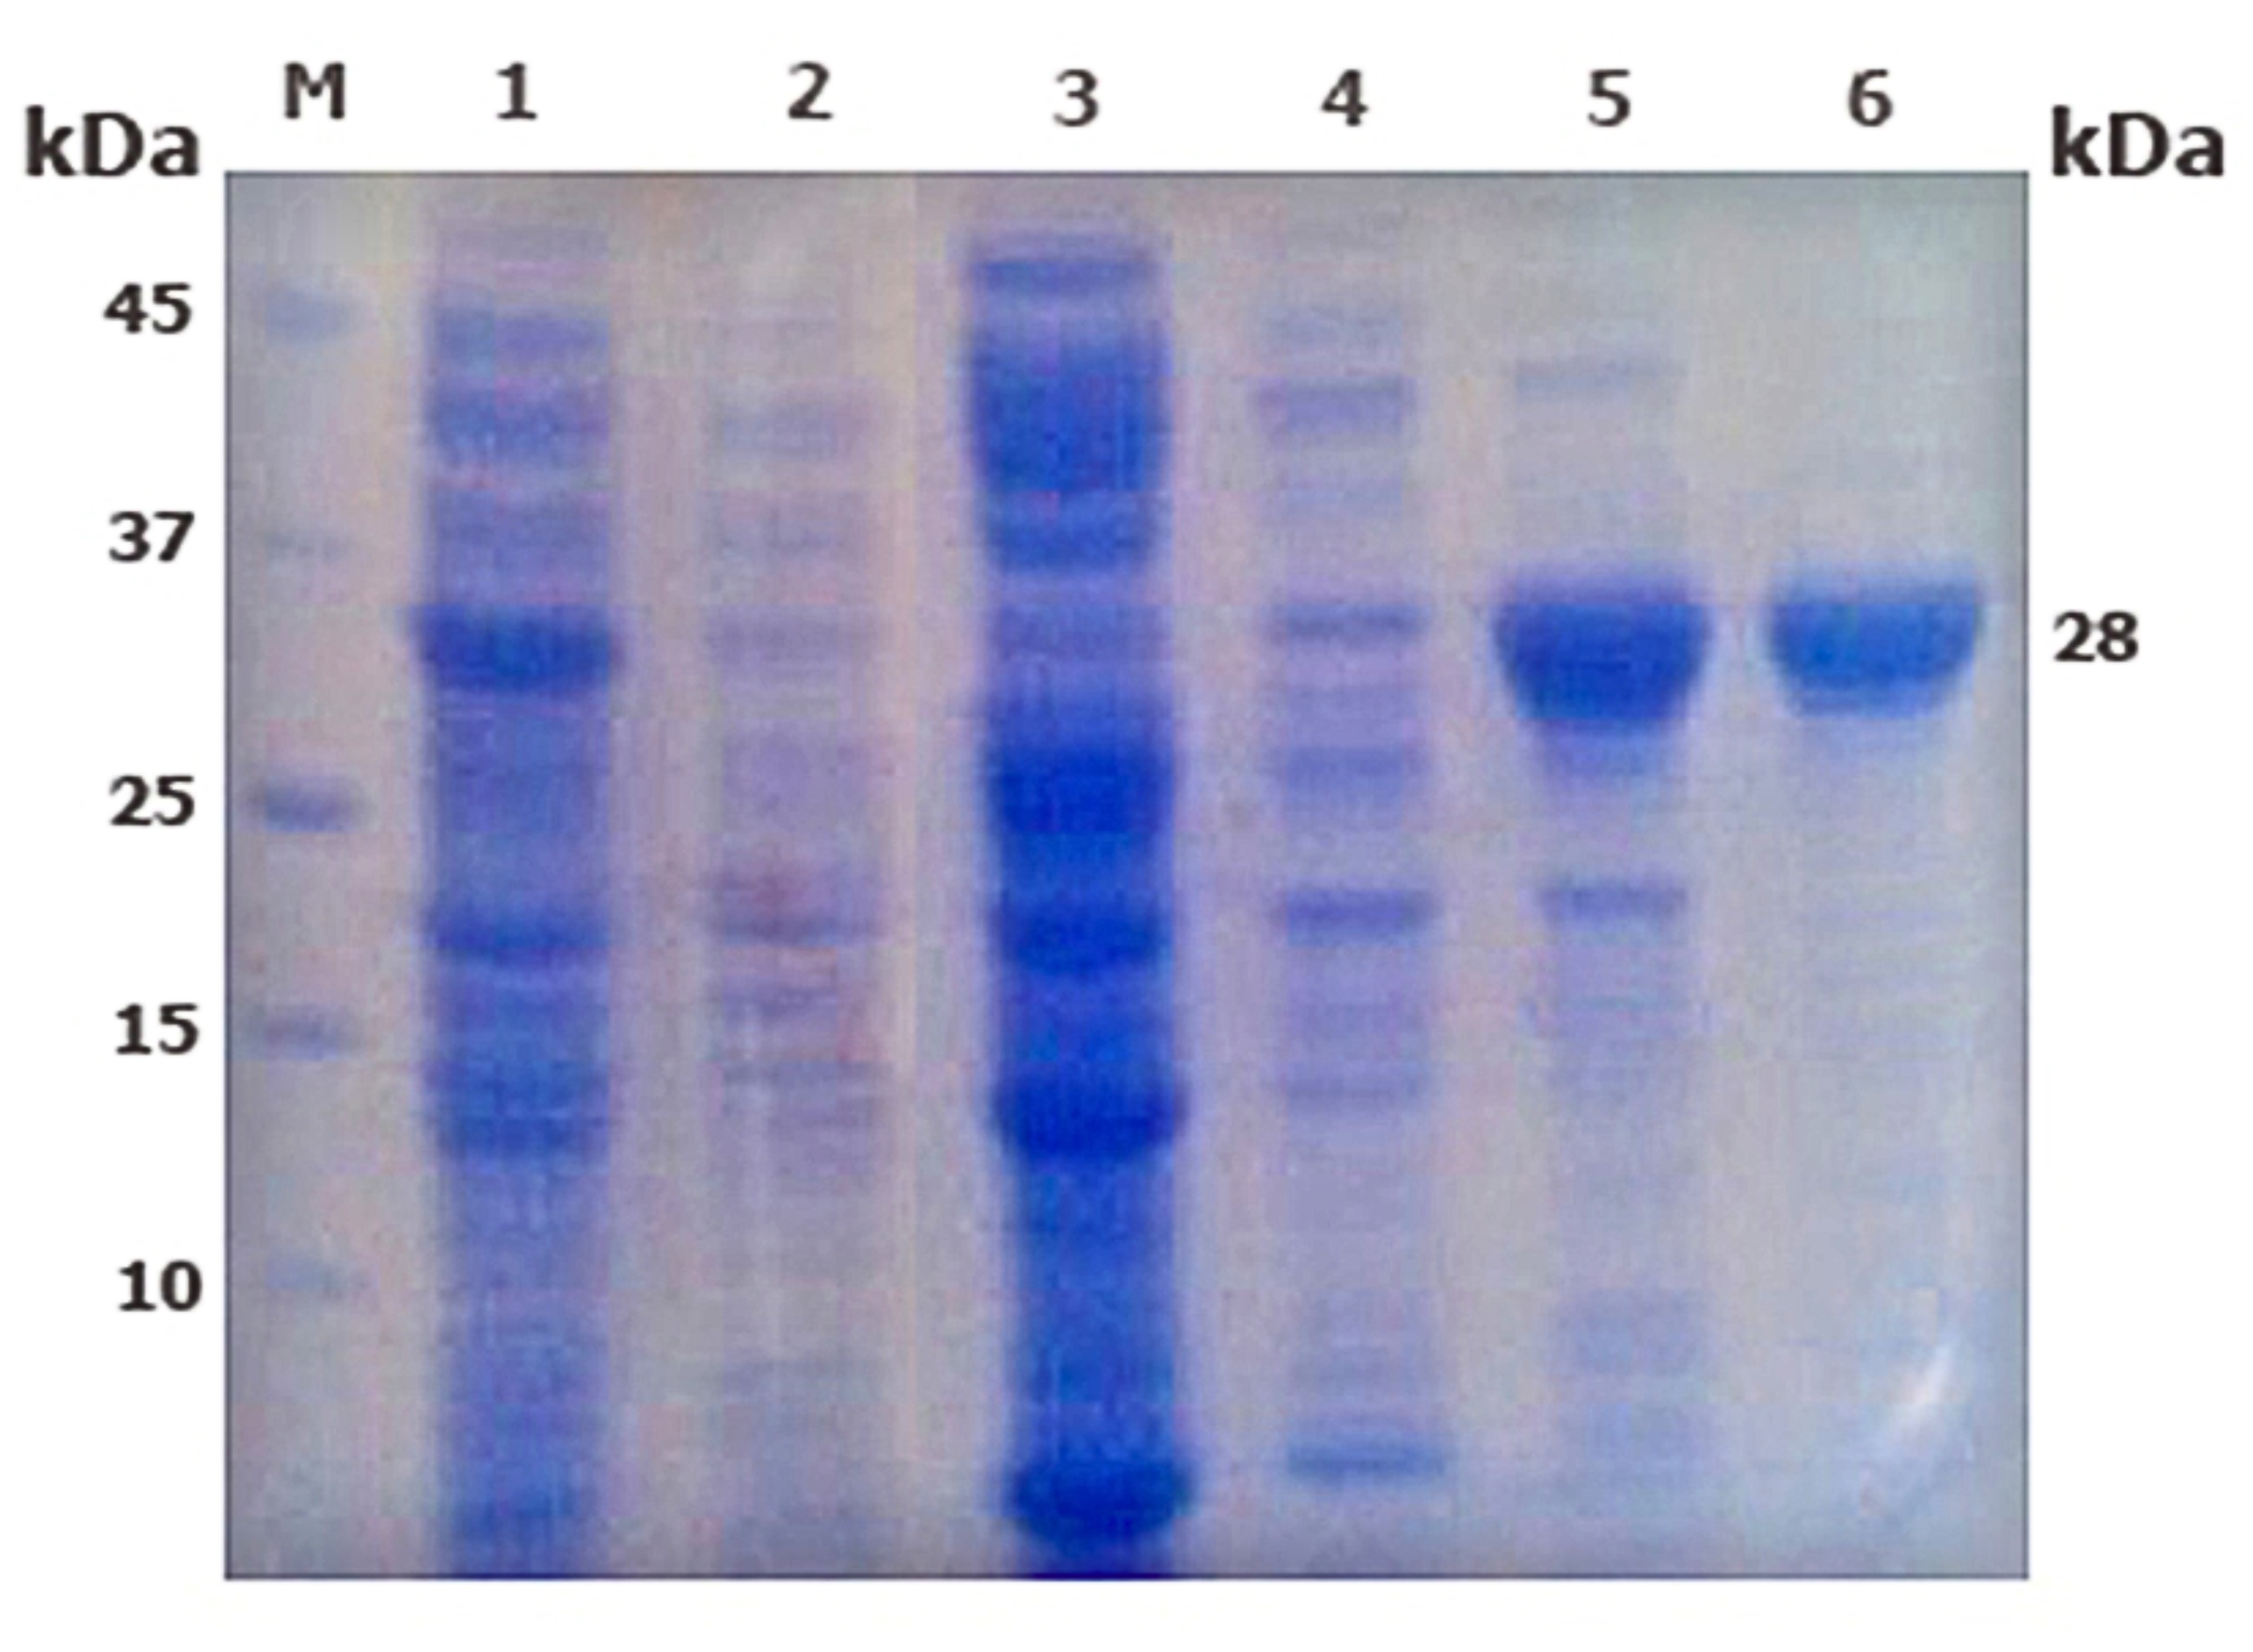
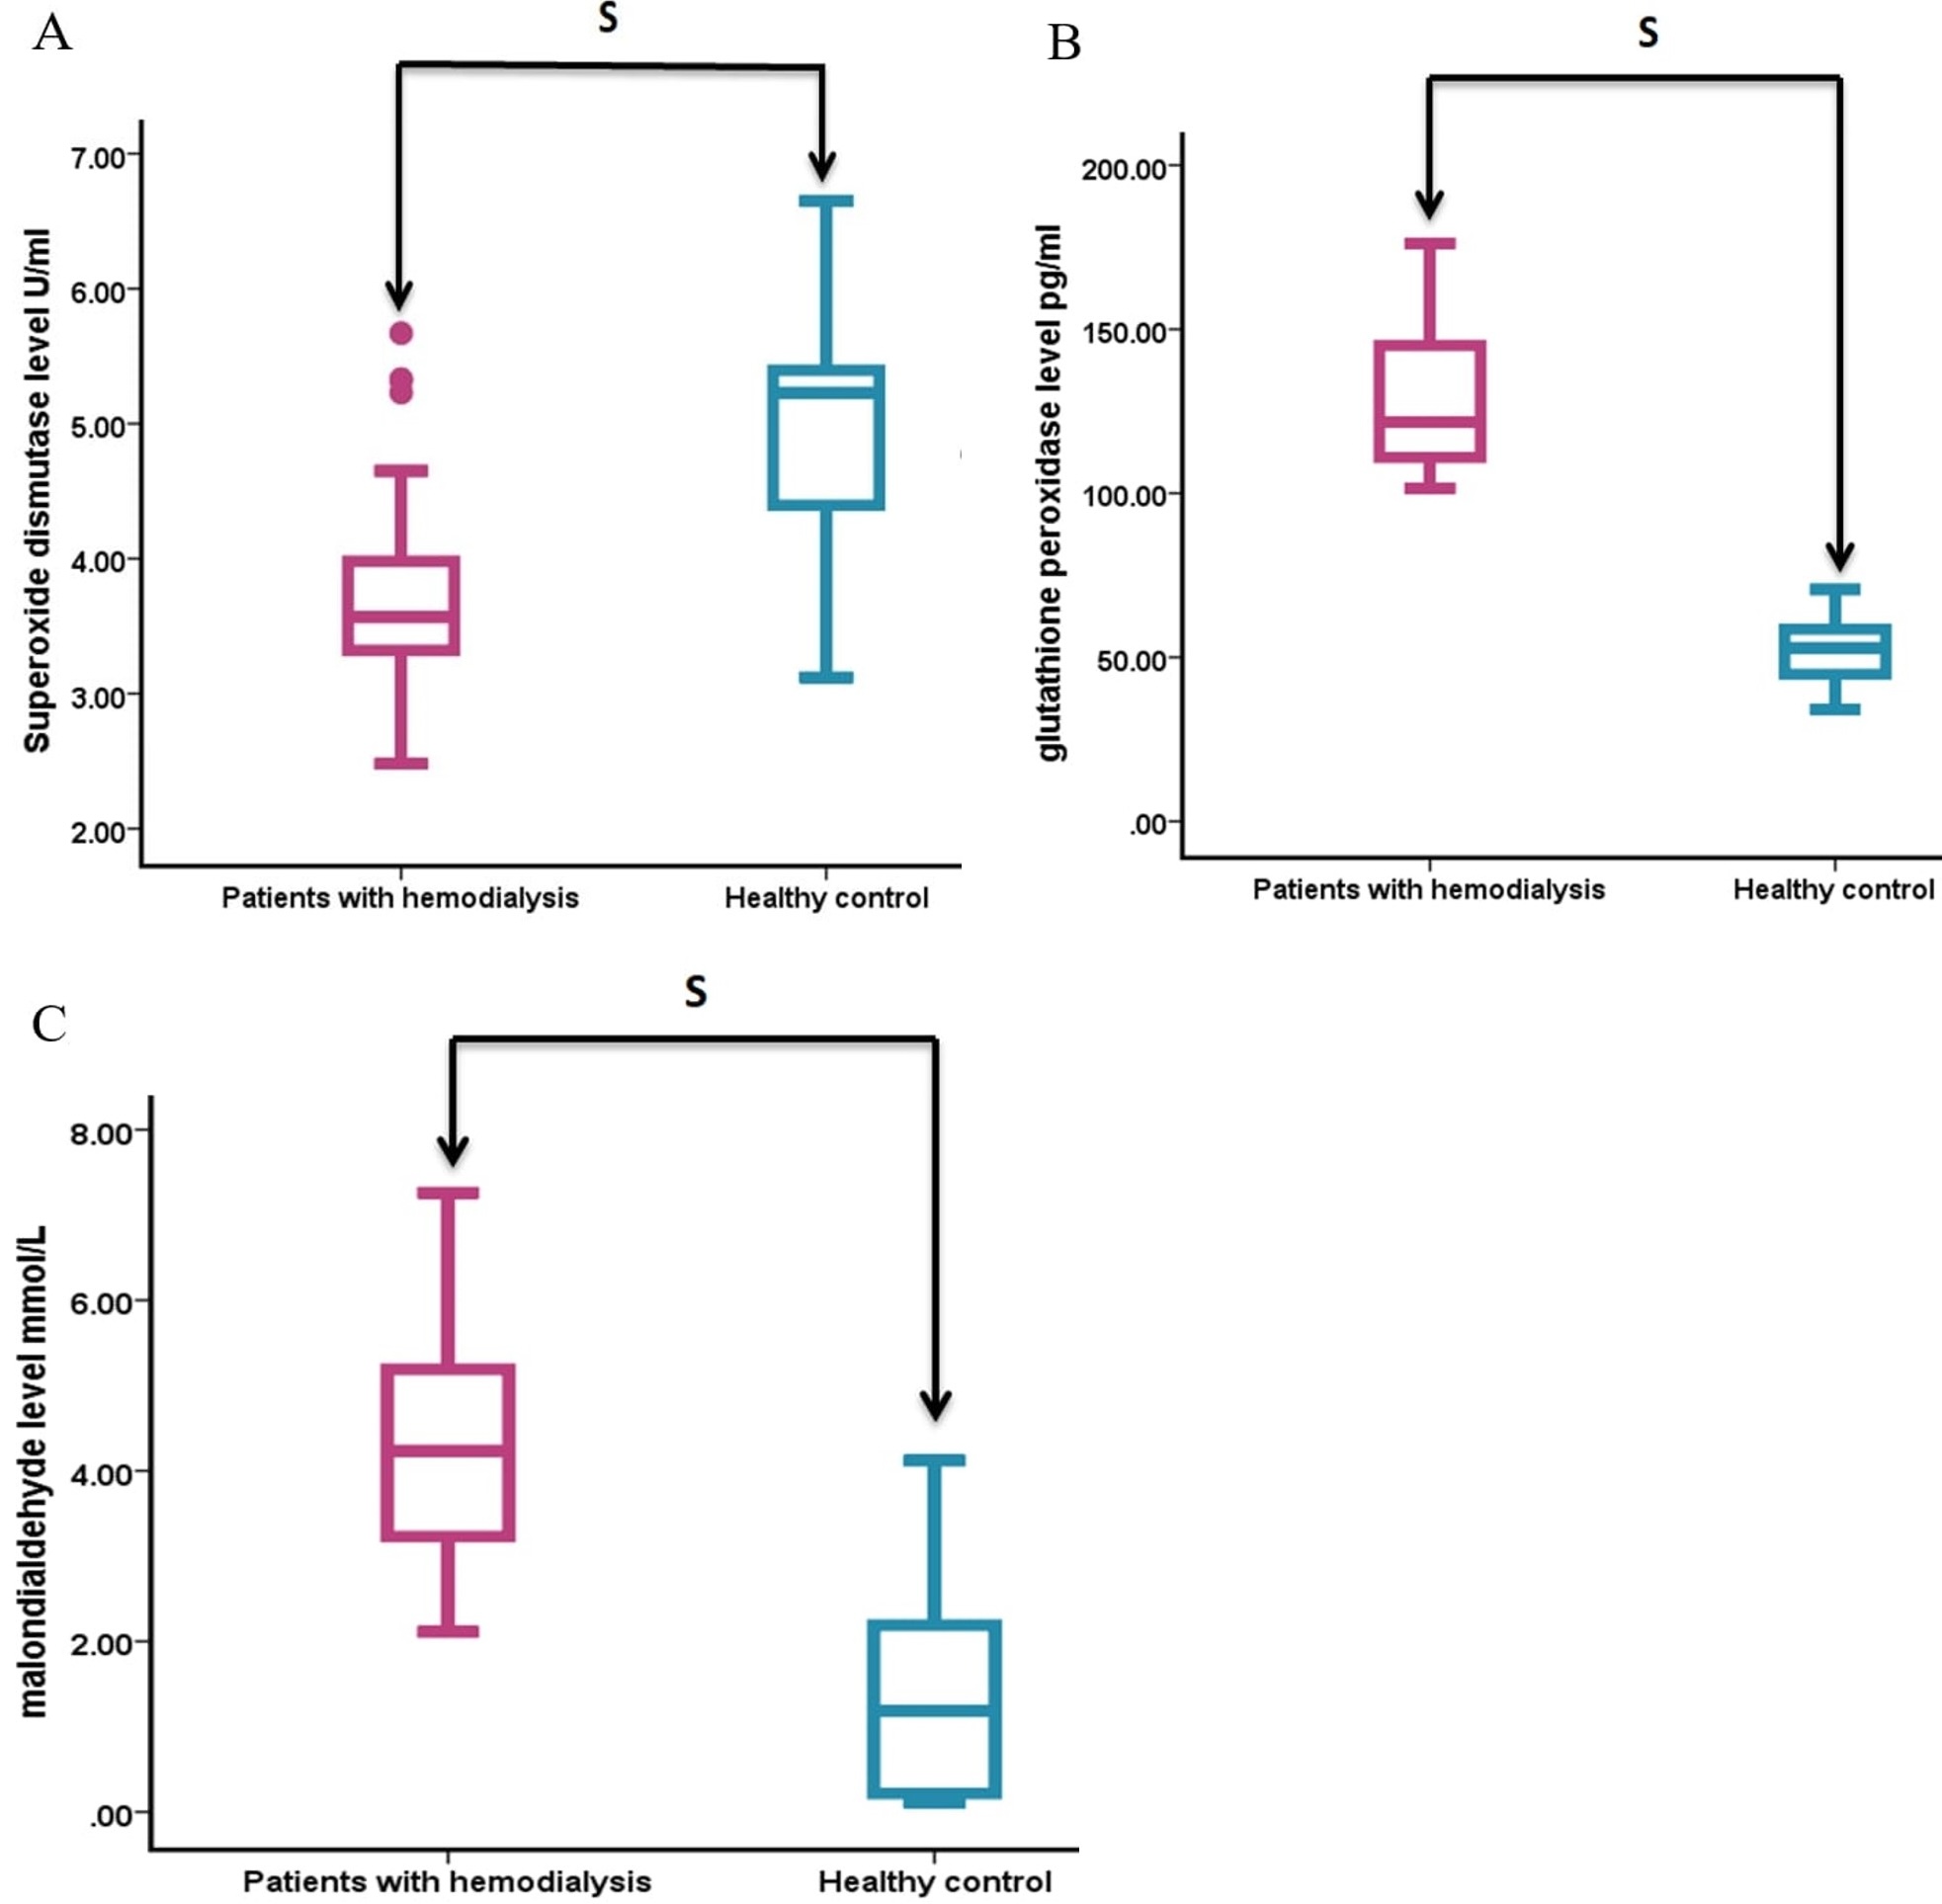
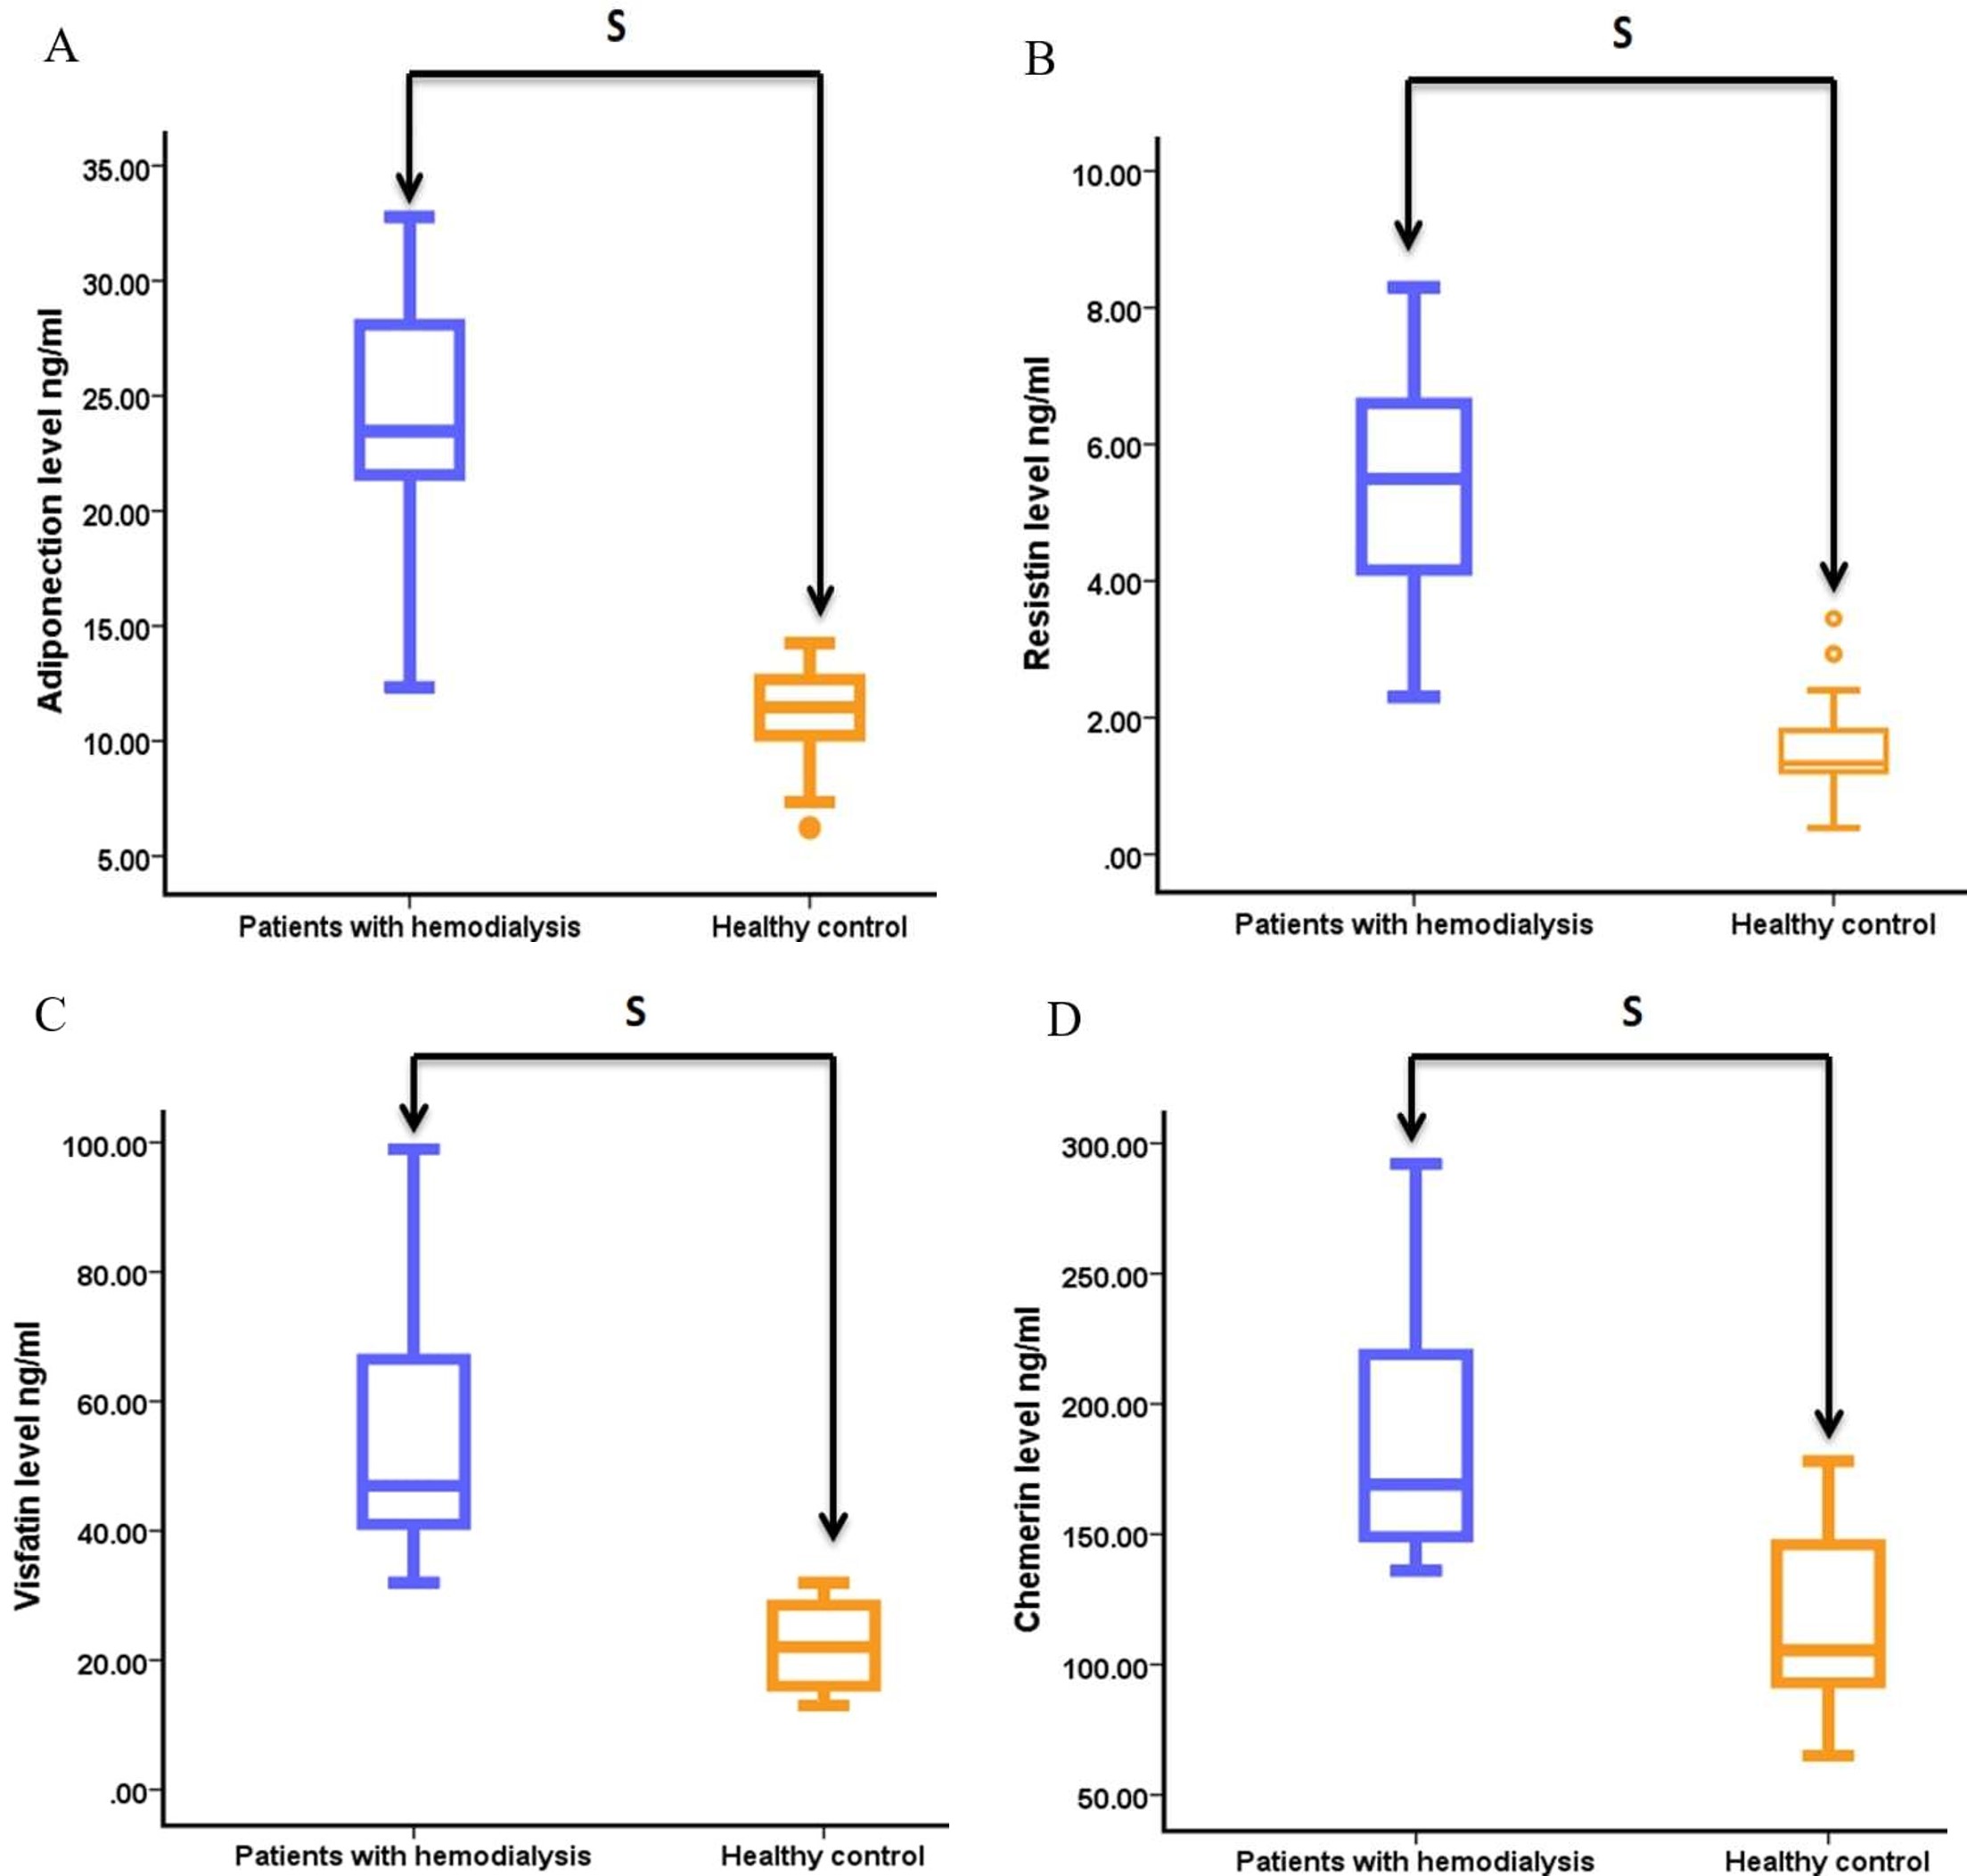
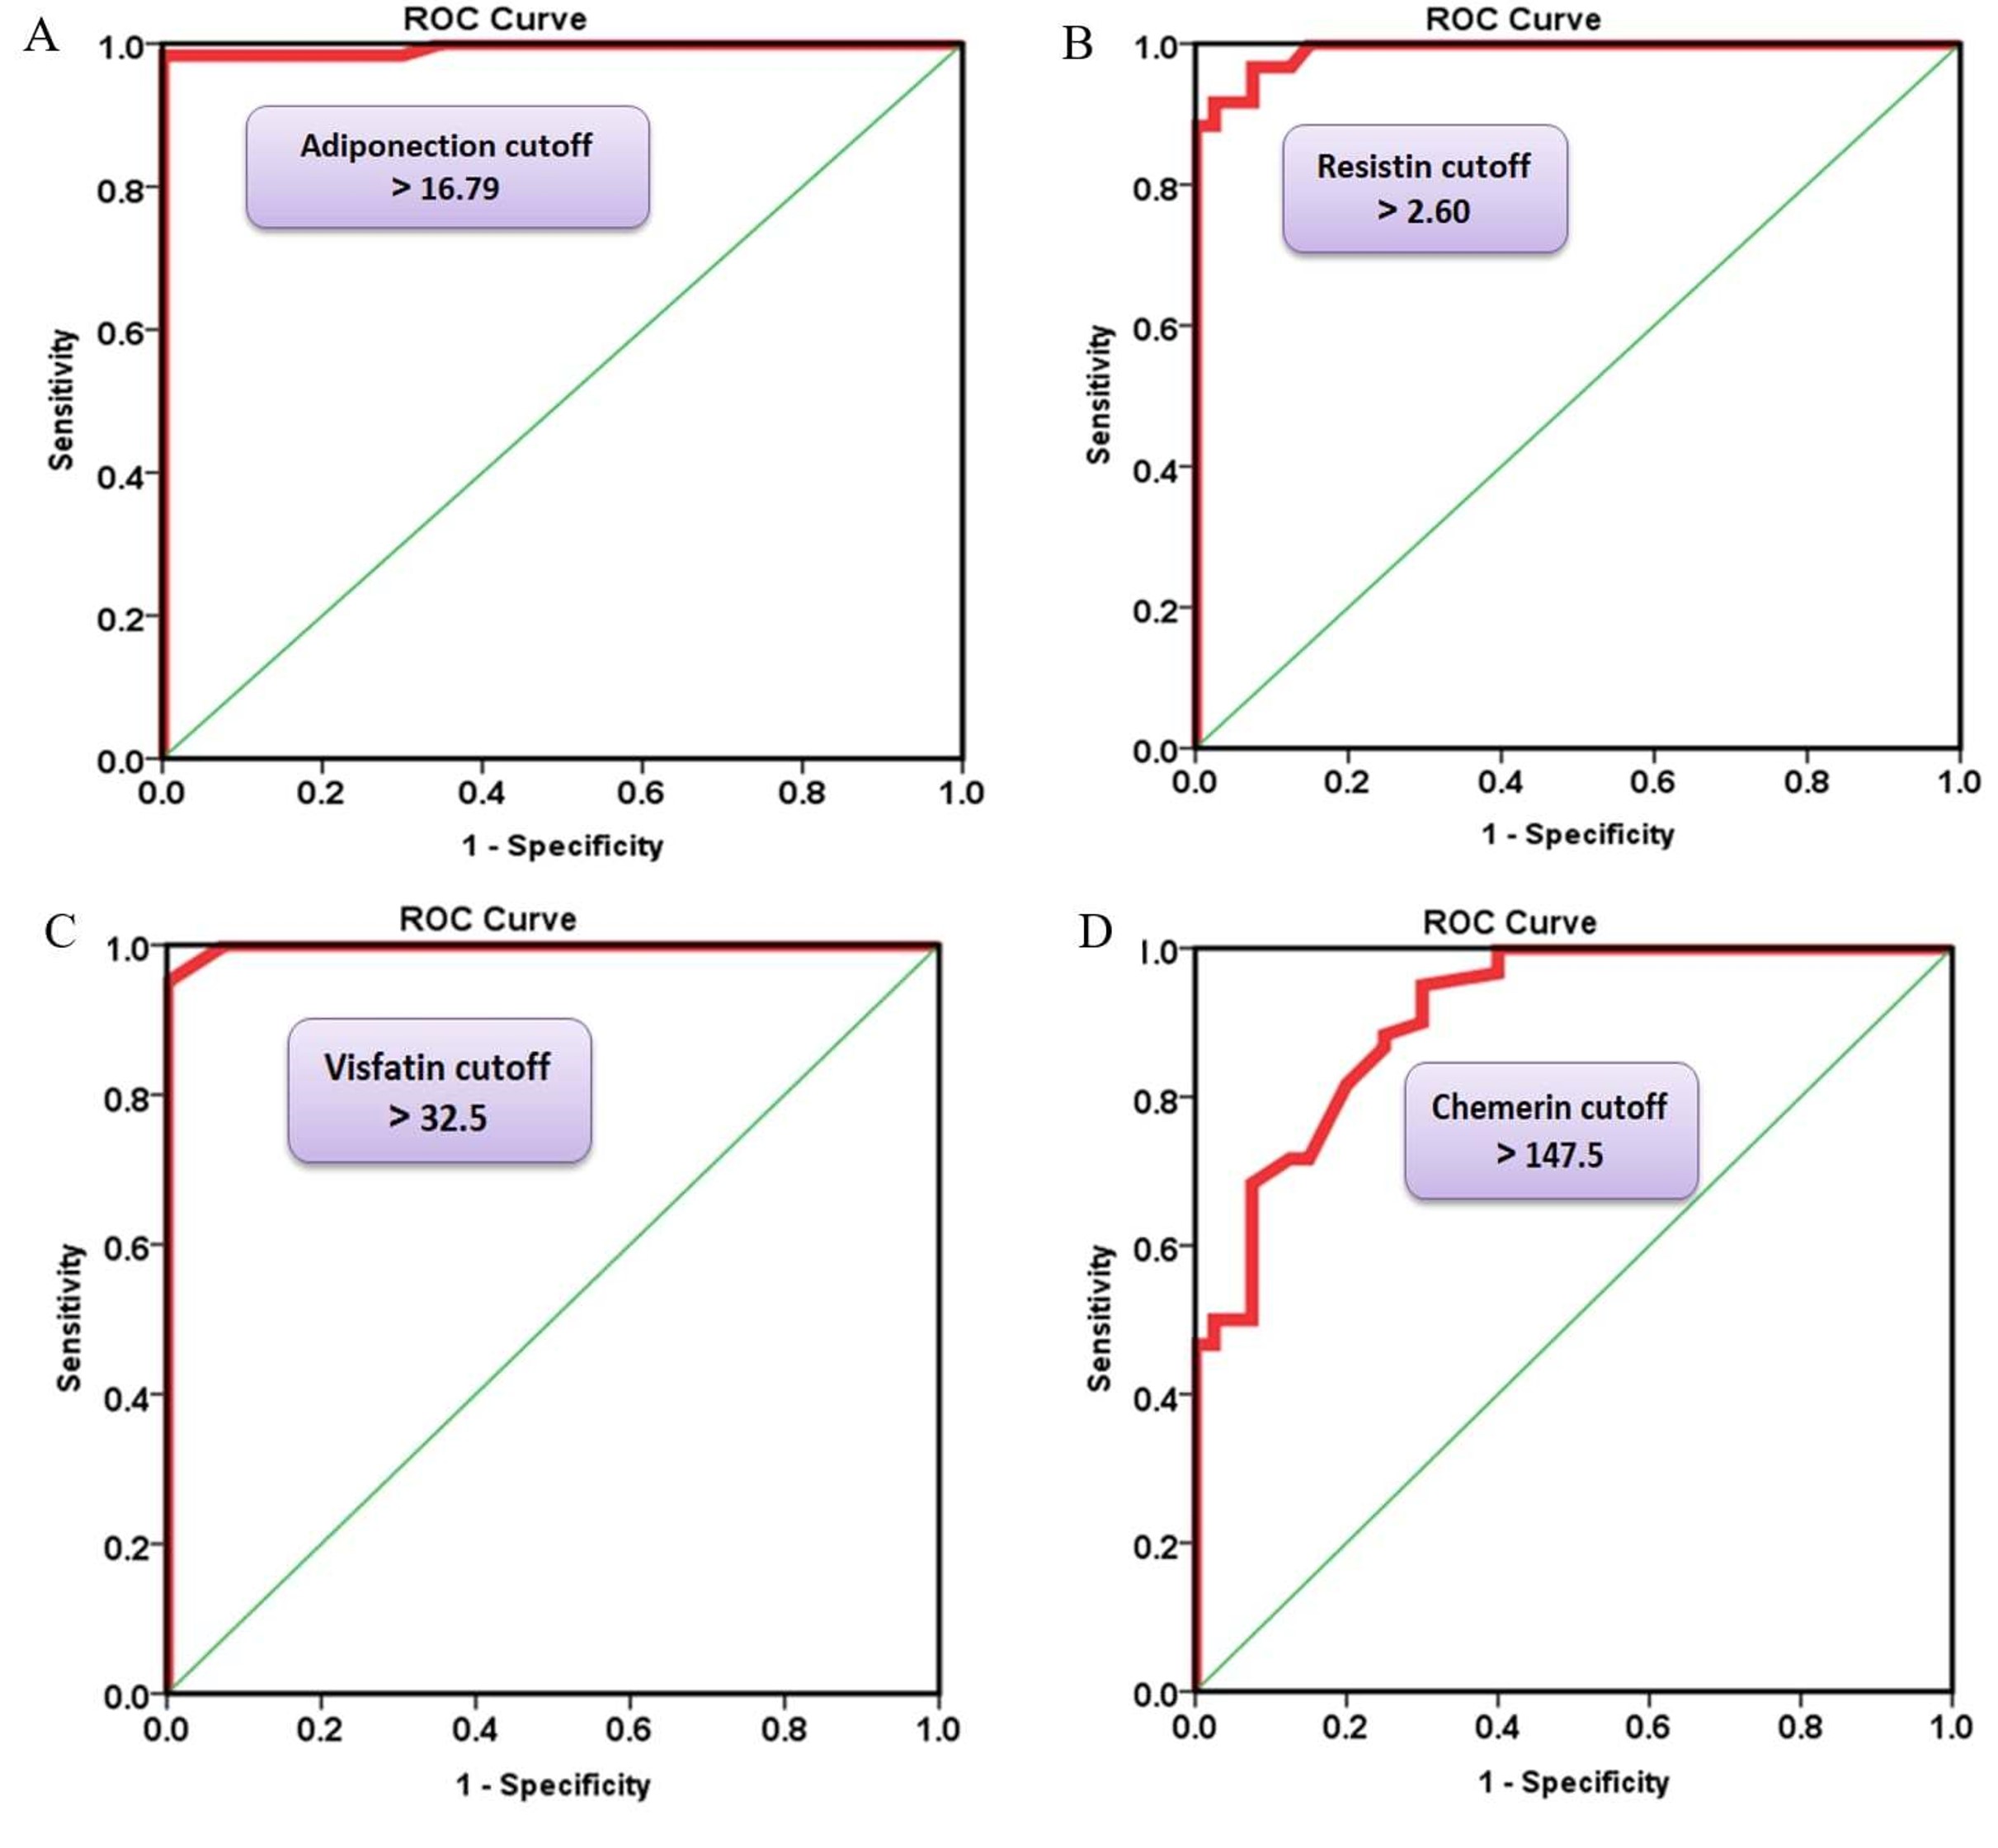
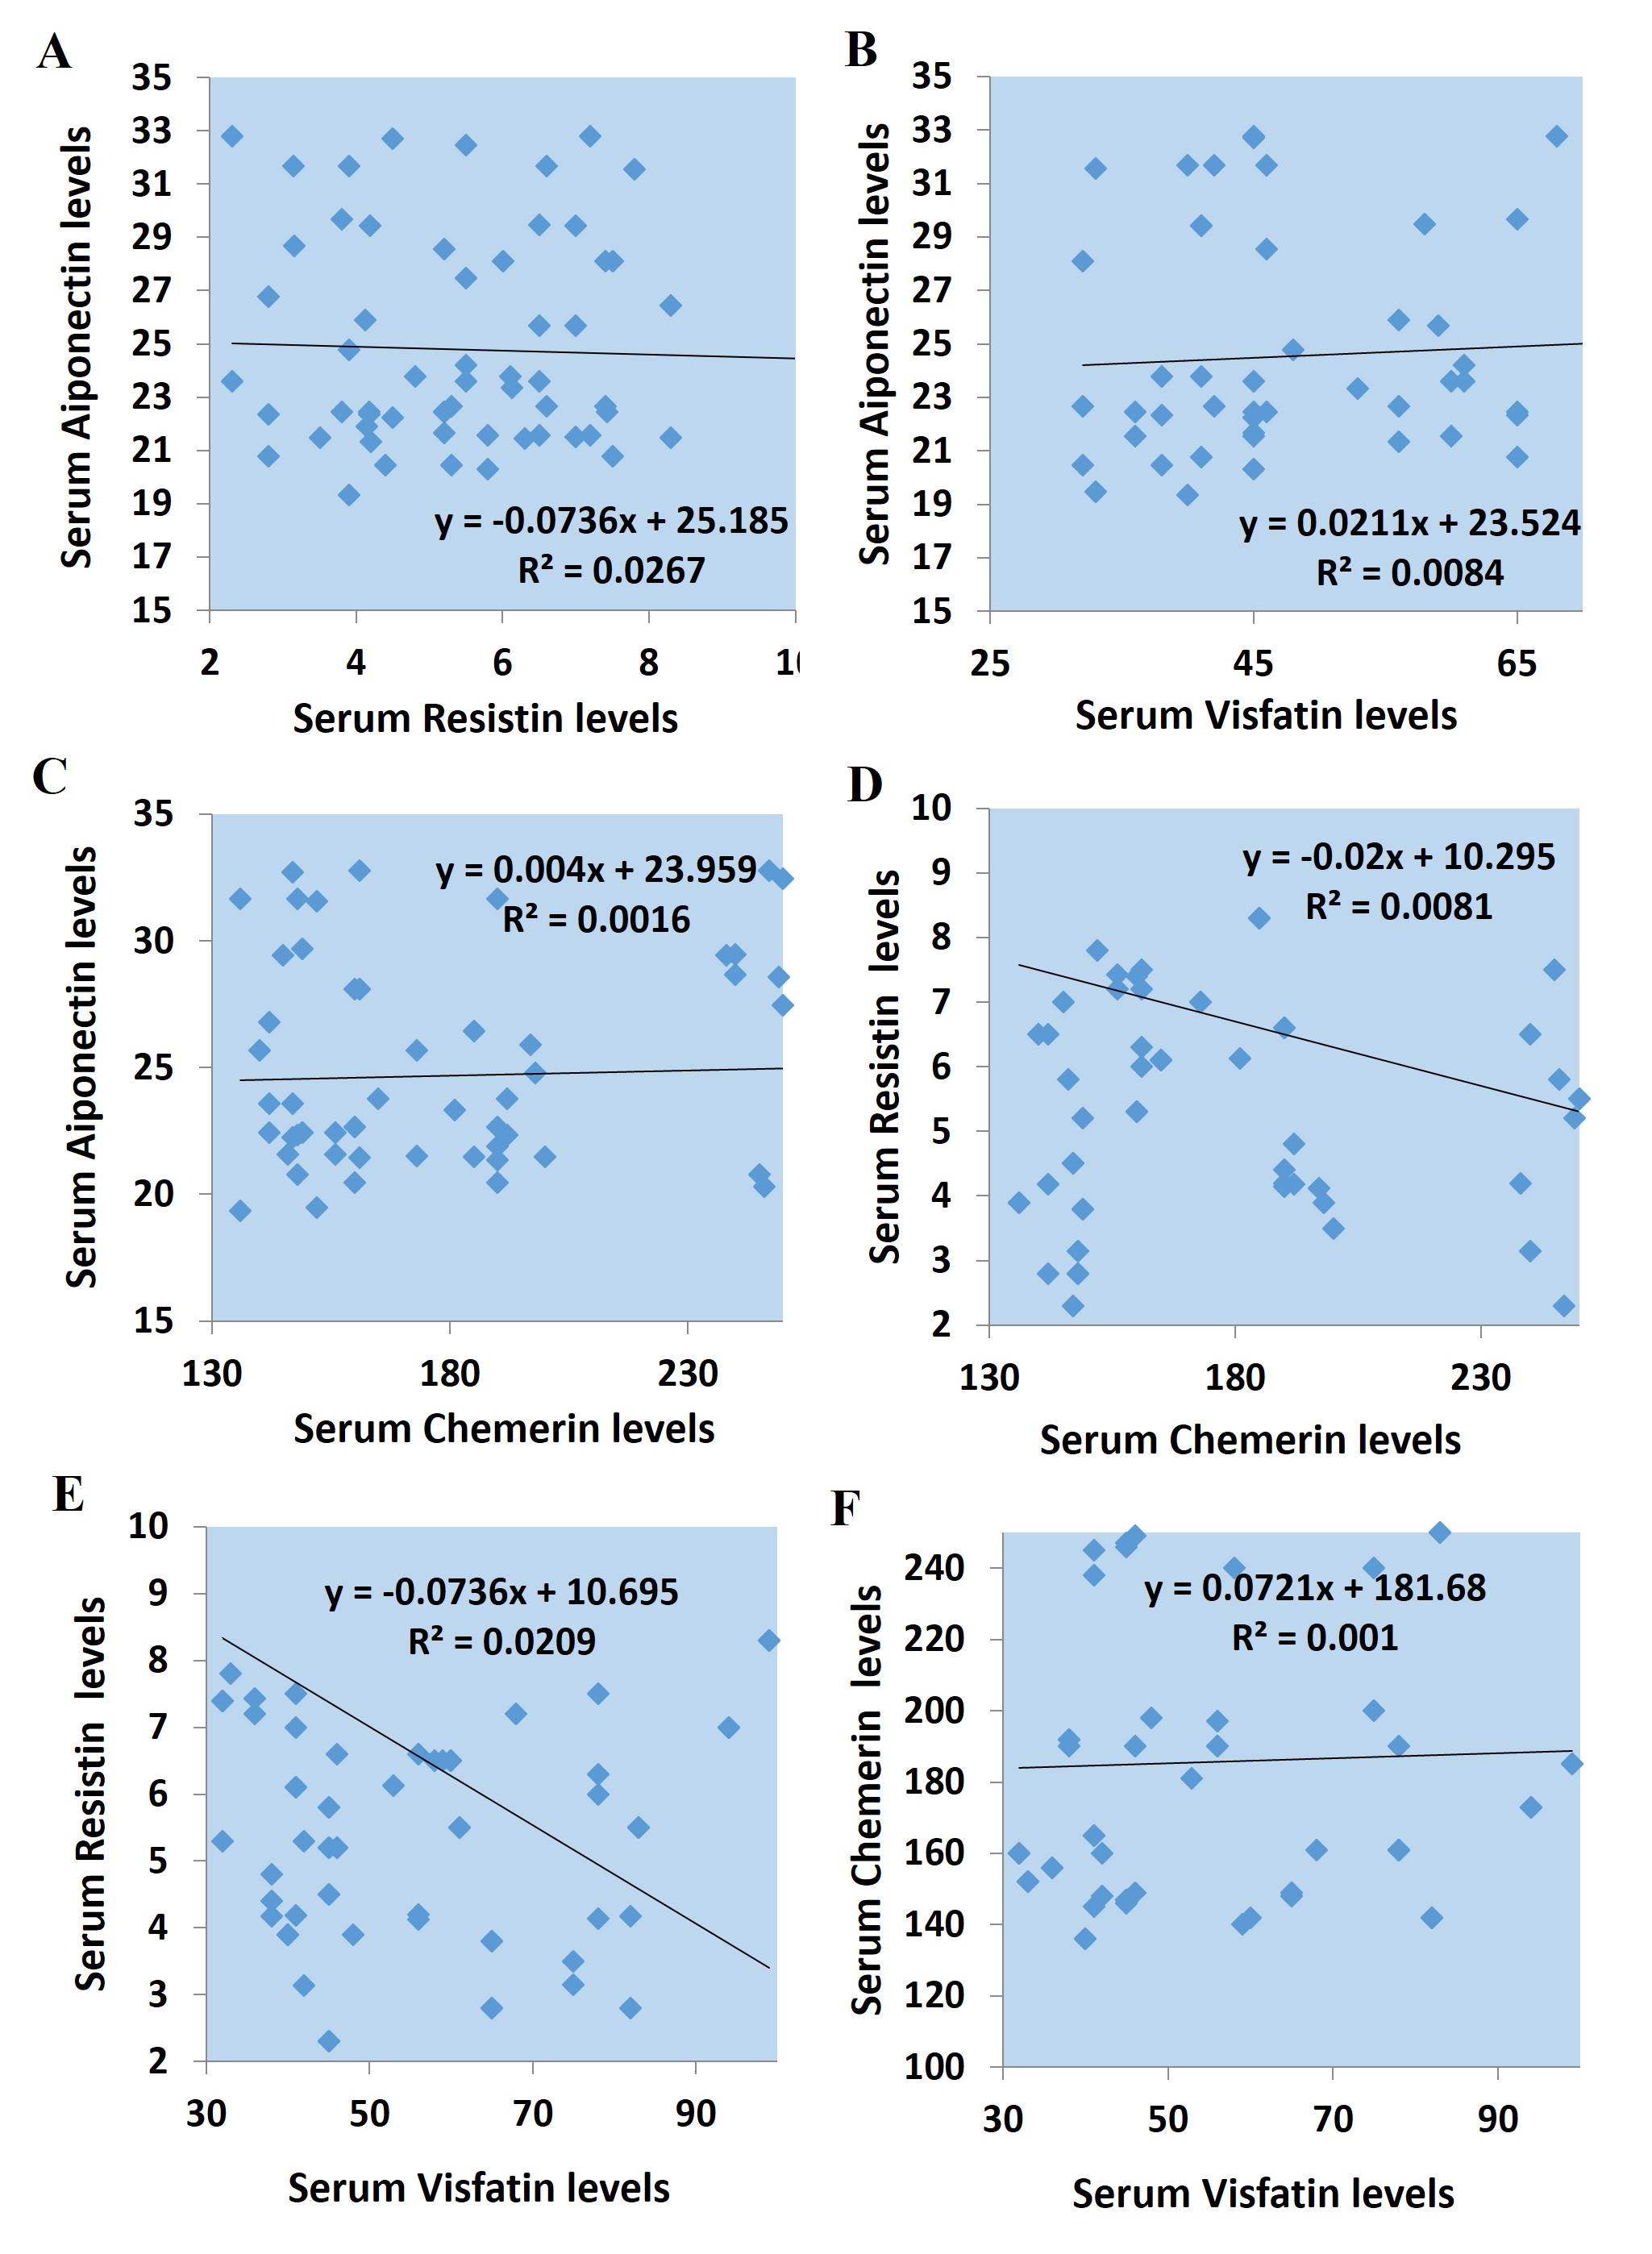