HTTP 200 OK
Allow: GET, HEAD, OPTIONS
Content-Type: application/json
Vary: Accept
{
"count": 321,
"next": "https://jabet.bsmiab.org/articles/?format=api&page=19",
"previous": "https://jabet.bsmiab.org/articles/?format=api&page=17",
"results": [
{
"id": 89,
"slug": "178-1643719256-isolation-documentation-and-biochemical-characterization-of-cellulolytic-bacteria-from-rumen-fluid-of-cattle",
"featured": false,
"slider": false,
"issue": "Vol5 Issue2",
"type": "original_article",
"manuscript_id": "178-1643719256",
"recieved": "2022-04-09",
"revised": null,
"accepted": "2022-05-09",
"published": "2022-05-15",
"pdf_file": "https://jabet.bsmiab.org/media/pdf_file/2023/21/178-1643719256.pdf",
"title": "Isolation, documentation, and biochemical characterization of cellulolytic bacteria from rumen fluid of cattle",
"abstract": "<p>The microbiological use of cellulose is a significant aspect in achieving the highest possible material flow in the environment. This study aimed at isolation, identification, and biochemical characterization of bacteria with cellulase activity from cellulose samples. Cellulase enzyme has wide applications in various industries including food industry, agriculture, textile, detergent, pulp and paper, biofuel production, brewing and biorefinery. In the present study, cellulolytic bacterium <em>Pseudomonas </em>sp. was isolated from rumen fluid of cattle was collected from slaughter house. This bacterial isolate was identified by morphological, biochemical, and physiochemical characteristics. Cellulase production by the bacteria was optimized. Optimum cellulase was produced by <em>Pseudomonas</em> sp. which was observed under different pH, temperature, and incubation period. The highest production of cellulase enzyme by this bacterium was monitored at pH 7.0 for 48 hours under 3 days of cultivation at 40°C. The enzyme activity was observed at pH 7.0 with cellulosic filter paper for 5 days incubation and its maximum activity was noted at 48 hours. The result of study shows that the <em>Pseudomonas </em>sp. is a good producer of extra cellular cellulase enzyme which can be also beneficial for the degradation of cellulosic pollutants of environment.</p>",
"journal_reference": "J Adv Biotechnol Exp Ther. 2022; 5(2): 433-444.",
"academic_editor": "Hasan-Al-Faruque, PhD; Daegu Gyeongbuk Institute of Sci. &Tech., South Korea",
"cite_info": "Poly NY, Mamtaz S, et al. Isolation, documentation, and biochemical characterization of cellulolytic bacteria from rumen fluid of cattle. J Adv Biotechnol Exp Ther. 2022; 5(2): 433-444.",
"keywords": [
"Cattle",
"Pseudomonas sp.",
"Cellulase",
"Rumen Fluid",
"Cellulose"
],
"DOI": "10.5455/jabet.2022.d126",
"sections": [
{
"section_number": 1,
"section_title": "INTRODUCTION",
"body": "<p>Cellulose is most abundant element of plant biomass and agricultural waste is considered as low-cost biopolymer and renewable energy source [<a href=\"#r-1\">1</a>]. Plant polysaccharide cellulose is primarily fibrous crystalline in nature and consists of the repeating units of β-D-glucose monomers, linked by β-1, 4- glycosidic bond having high molecular weight and soluble in water [<a href=\"#r-2\">2, 3</a>]. This can be broken down into glucose monomers and into other soluble sugars by cellulolysis process. Cellulolysis process is triggered by a set of enzymes called cellulase, which comprises of endoglucanase (endo-1, 4-β-D-glucanase), exoglucanase (exo-1, 4-β-Dglucanase) and β-glucosidase (1, 4-β-D-glucosidase) [<a href=\"#r-4\">4</a>]. According to Cheng et al., every year more than hundreds (100) billion metric tons of cellulose is found naturally, whereas the total biomass is about two hundred eighty (280) billion metric tons [<a href=\"#r-5\">5</a>].<br />\r\nCellulase is well suited for a variety of agro-industrial processes that use biofuels such as bioethanol [<a href=\"#r-6\">6</a>], management of plant and agricultural waste, binding of ligand and separation of chiral studies, thereby resulting in upgrading of the waste or the synthesis of valuable by-products [<a href=\"#r-7\">7</a>]. But there is a shortage of microorganisms those are capable of producing large amounts of cellulase enzymes toward proficiently convert cellulose into fermentable products [<a href=\"#r-8\">8</a>]. Numerous microorganisms synthesize cellulose, a bioactive compound for the period of their life span on cellulosic materials [<a href=\"#r-9\">9</a>]. In soils, cellulosic compounds are degraded mostly by cellulolytic microorganisms such as fungi and bacteria [<a href=\"#r-10\">10</a>]. Bacteria are currently extensively studied for cellulose production due to their enormously high natural diversity and ability to produce stable enzymes that can be used in industry [<a href=\"#r-11\">11, 12</a>]. The prospective cellulose synthesizing bacteria are <em>Cellulomonas, Pseudomonas, Thermoactinomycetes</em>, <em>Bacillus</em> sp. <em>Clostridium, Cellulomonas, Cellulosimicrobium, Thermomonospora</em> [<a href=\"#r-13\">13</a>]. Bacterial cellulase generally act as effective and potent catalyst [<a href=\"#r-14\">14</a>] which is extensively used for their rapid growth, multi-enzyme complexes expression. Moreover, their stability at high temperature and pH helps to reduce activity of inhibition and ability to colonize a comprehensive range of environmental niches [<a href=\"#r-15\">15</a>, <a href=\"#r-8\">8</a>]. Additionally, nature and quality of cellulose, temperature, pH of the medium, incubation period, carbon sources, medium additives, and existence of diverse inducers are also important parameters for the maximization of different cellulase enzymes production [<a href=\"#r-16\">16</a>].<br />\r\nResearch on the isolation and characterization of vigorous cellulase producing microorganisms from different sources have been sustained for numerous years [<a href=\"#r-17\">17</a>]. Most of the previous studies emphasized more on fungi than on bacteria as a potential source for the production of cellulase. Therefore, the primary objective of this research was the isolation and identification of cellulytic bacteria from rumen fluid, their ability to produce cellulase enzyme and the effect of pH, temperature, and incubation period in the production of cellulase enzyme.</p>"
},
{
"section_number": 2,
"section_title": "MATERIALS AND METHODS",
"body": "<p><strong>Sample collection</strong><br />\r\nRumen fluid samples were collected from slaughtering cattle at Kajitula Slaughtering house, Sylhet City Corporation, Bangladesh. Flasks containing warm water were used to carry out rumen fluid following Khan and Chaudhry, [<a href=\"#r-18\">18</a>] protocol in order to maintain survival temperature for microbes. The collected liquid was squeezed out, filtered through a 4-layer cheesecloth, sealed, and stored at 39 ° C.</p>\r\n\r\n<p> </p>\r\n\r\n<p><strong>Reagents and culture media preparation</strong><br />\r\nAnalytically graded inorganic reagents KH<sub>2</sub>PO<sub>4</sub> 1.0 g, K<sub>2</sub>HPO<sub>4 </sub>1.145 g, MgSO<sub>4 </sub>0.4 g, NH<sub>4</sub>SO<sub>4 </sub>5.0 g, CaCl<sub>2</sub> 0.05 g, FeSO<sub>4</sub> 0.00125 g, carboxy methyl cellulose (CMC) 10.0 g and agar 18g were dissolved in 1000 ml double distilled water (ddH<sub>2</sub>O) to prepare culture media. The prepared media was then sterilized by autoclaving at 121°C, 15 psi for around 30 min and subsequently introduced into sterilized petri dishes that were oven dried at 180 °C for 1 hour.</p>\r\n\r\n<p> </p>\r\n\r\n<p><strong>Isolation of cellulolytic bacteria</strong><br />\r\nAt first, rumen fluid (1 ml) was diluted with 9 ml sterile double distilled water (ddH<sub>2</sub>O) (v/v) where 10<sup>−1</sup> to 10<sup>−5</sup> serial dilutions were prepared. Then 0.3 ml of samples was taken from each dilution and streaked into petri dishes containing CMC medium and incubated at 37°C for 24 hours [<a href=\"#r-31\">31</a>]. After 24 h of incubation, no clear zone was formed around the bacterial culture that’s why it was applied iodine to visualize the clear zones produced by cellulolytic bacteria. Subsequently, well grown colonies were chosen to obtain a pure culture of bacteria using two loops of an inoculating needle to transfer and inoculate onto a petri dish containing CMC medium [19]. The selection of cellulolytic species was conducted based on the ratio of clear zone to colony diameter after 48 hours on carboxy methyl cellulose (CMC) media. Later, subcultures were made to produce new culture with a lower density of cells.<br />\r\nNo ethical approval is needed here as rumen fluid was collected from rumen after normal slaughtering of cattle.</p>\r\n\r\n<p> </p>\r\n\r\n<p><strong>Characterization of cellulose-producing bacteria microscopically with gram staining</strong><br />\r\nGram stain was an empirical method of distinguishing bacterial species into two large groups (Gram-positive and Gram-negative) based on the presence of chemicals, primarily the presence of high levels of peptidoglycan and physical properties of their cell walls. A small colony was taken using a loop needle, then smeared on a glass slide and fixed by gentle heating over Bunsen. Gram A (Crystal violet- primary stain) solution was then applied on the smear to stain and left for 2 minutes then rinsed with running water. Next, dropped with Gram B (Lugol’s iodine) solution as mordant for 1 minute and then washed with running water. Then 95 % ethanol was added until the remaining dye disappears for 5 seconds and rinsed again with running water. In the final stage, the preparation was dropped with gram C (safranin) solution as counter stain and allowed to stain and dry for 45 seconds. Then it was drizzled with immersion oil and examined under a microscope at a magnification of 100X. After that, the slide was washed, blotted, and dried in the air, and the observations were performed by looking at cell morphology and color. Gram-positive bacteria change color to purple or blue, while Gram-negative bacteria change color to red [<a href=\"#r-20\">20</a>].</p>\r\n\r\n<p> </p>\r\n\r\n<p><strong>Biochemical test</strong><br />\r\n<em>Catalase test</em><br />\r\nThe catalase test was performed according to Cappucino and Sherman’s method [19]. Colonies that had been cultured for 18-24 hours were transferred to a glass slide with a loop, and 1-2 drops of 3 percent hydrogen peroxide were applied to the colonies. The presence of gas bubbles in the glass slide indicated positive results, whereas the absence of gas bubbles indicated catalase negative results [<a href=\"#r-21\">21</a>].</p>\r\n\r\n<p> </p>\r\n\r\n<p><em>Oxidase test</em><br />\r\nOxidase test was carried out by smearing isolates in filter paper that was soaked with tetramethyl-p-phenylenediaminedihydrochloride. Inoculated were observed on paper for a color change to deep blue or purple within 10-30 seconds. Violet color indicates oxidase positive and white color indicates oxidase negative [<a href=\"#r-21\">21</a>].</p>\r\n\r\n<p> </p>\r\n\r\n<p><em>Citrate test</em><br />\r\nInoculate Simmons citrate agar on the slant by touching a colony that was 18-24 h old with a straight wire. Stabbing the butt and broth culture of the medium was strictly prohibited. After 7 days incubation at 35-37°C, bacterial growth with color changes from green to intense blue along with the slant indicates citrate positive and green slant with no color change indicates citrate negative [<a href=\"#r-21\">21</a>].</p>\r\n\r\n<p> </p>\r\n\r\n<p><em>Indole test</em><br />\r\nIndole test was a commonly used biochemical test to differentiate Enterobacteriaceae and other genera. Indole test was used to determine the ability of an organism to split amino acid tryptophan to form the compound indole. Indole production was detected by Kovac’s or Ehrlich’s reagent which contains 4(p)-dimethylamino benzaldehyde, this reacts with indole to produce a pink or red colored compound indicate indole positive and no color change indicate indole negative [<a href=\"#r-21\">21</a>].</p>\r\n\r\n<p> </p>\r\n\r\n<p><em>Methyl red test</em><br />\r\nUnknown microorganism was inoculated by using sterile inoculation loop into sterile medium, which was prepared from mixing of 7g buffered peptone, 5g glucose and 5g Di-potasium phosphate in per liter of deionized water. The inoculated tube was then subjected to incubate at 35-37°C for two to five days. After incubation, the broths were obtained from the incubator and 5 drops of Methyl Red reagent was added to the broth. Color changes to red indicate Methyl red positive and no color changes indicate Methyl red negative [<a href=\"#r-21\">21</a>].</p>\r\n\r\n<p> </p>\r\n\r\n<p><em>Voges-Proskauer test</em><br />\r\nA tube of MR/VP broth (reagents of alpha-napthol (5%) and absolute ethanol) was taken and a pure culture of the test organism was inoculated into it. Then it was incubated for 24 to 48 hours at 35°C. At the end of this time, aliquot of 1 ml brought to clean test tube. A 0.6 ml of 5% alpha naphthol was added followed by 0.2 ml of 40 % KOH. To expose the medium to atmospheric oxygen, gentle shaking of the tube gently was practiced and then allowed to remain undisturbed for 10 to 15 min. A pink-red color at the surface indicated positive result for this test [<a href=\"#r-21\">21</a>].</p>\r\n\r\n<p> </p>\r\n\r\n<p><em>Glucose fermentation test</em><br />\r\nAt first, trypticase 3g, sodium chloride 5g and phenol red 0.018g were weighed and dissolved in 100 ml distilled water and transferred into conical flasks. Then, 0.5% of dextrose was added into the flasks and autoclaved at 115<sup>o</sup>C for 15 minutes. The mixture was then transferred into fermentation tubes and labeled properly. Carbohydrate broths were inoculated with aseptically labeled bacterial culture and incubated the tubes for 18-24 hours at 37oC. Color changes to yellow indicated positive and no color changes indicated negative [<a href=\"#r-21\">21</a>].</p>\r\n\r\n<p> </p>\r\n\r\n<p><strong>Cellulolytic enzyme production and assay</strong><br />\r\nFor cellulolytic enzyme production, at first seed production in CMC media (40 ml) was prepared without agar in a 100 ml conical flask. Later, 10 ml of CMC solution was poured into three conical flasks and maintained different pH (6.0, 6.5 and 7.0) which was measured and set accordingly. Then it was autoclaved and inoculated with 1% inoculum (v/v) using sterilized inoculating loop. The preparation was then subjected to incubate in a shaking incubator at 37°C at 120 rpm for 24 hours. The media without the culture was considered as control. After 18 hours enzyme was collected and evaluated it.</p>\r\n\r\n<p> </p>\r\n\r\n<p><em>Screening for enzymes production</em><br />\r\nAt the end of the incubation, the agar medium along with bacterial colonies was flooded with an aqueous solution of Congo red (1% w/v) for 15 minutes. The congo red solution was then poured off and the plates were further treated by flooding with 1M NaCl for 15 minutes. The formation of a clear zone due to hydrolysis, indicated cellulose degradation, but the results were so poor that Gram’s iodine (KI+I<sub>2</sub>) was used [<a href=\"#r-22\">22</a>]<sub>. </sub>The ratio of the highest cellulose activity producer was assumed to contain the highest activity [<a href=\"#r-23\">23, 24</a>].</p>\r\n\r\n<p> </p>\r\n\r\n<p><em>Cellulolytic enzyme activity assay</em><br />\r\nFilter paper (FPase) was used to measure the activity of cellulolytic enzyme, as described by Mandels and Weber [25]. 1.8 ml 50 micromole sodium citrate buffer was absorbed with double ring 102 filter paper (pH 4.8). Then 0.2 ml of culture was added and incubated for 60 minutes at 40 <sup>0</sup>C. The reaction was stopped by adding 3.0 ml of dinitro-salicylic acid (DNS) reagent to the reagent tubes and placing them in a water bath at 100 °C for 15 minutes. To stabilize the color, 1 ml Rochelle salt solution (40 g Rochelle salt in 100 ml distilled water) was added. In a spectrophotometer, the absorbance/optical density (OD) was measured at 575 nm against a blank of 50 µM citrate buffer. One micromole of glucose liberated per ml enzyme per minute equaled one unit of CMCase activity.</p>\r\n\r\n<p> </p>\r\n\r\n<p><strong>Measurement of glucose liberated by crude cellulase</strong><br />\r\nTo create a standard curve, the absorbance of a known glucose concentration solution (0.2 to 1 mg/ml) was measured in a spectrophotometer and compared to distilled water (control) as mentioned above. 1 µM of glucose liberated per ml enzyme per minute was defined as one unit of enzyme.</p>\r\n\r\n<p> </p>\r\n\r\n<p><strong>Effect of pH on the cellulase production</strong><br />\r\nThe influence of optimum pH for cellulase production by the experimental microorganism was determined by culturing the bacteria and measuring the enzyme activity at different pH value ranging from 6, 6.5 and 7 at optimum condition. Different suitable buffer, 50mM sodium citrate (pH 4.0), 50 mM sodium acetate (pH 5.0 and 6.0), 50 mM sodium phosphate (pH 7.0 and 8.0) were used.</p>\r\n\r\n<p> </p>\r\n\r\n<p><strong>Effect of temperature on the cellulase production</strong><br />\r\nTemperature plays a significant role for the production of cellulase by the test organism. To observe the effect of temperature on the production of cellulase, the fermentation was carried out at different temperatures ranging from 25-45°C.</p>\r\n\r\n<div id=\"figure1\">\r\n<figure class=\"image\"><img alt=\"\" height=\"279\" src=\"/media/article_images/2023/02/06/178-1643719256-Figure1.jpg\" width=\"500\" />\r\n<figcaption><strong>Figure 1. </strong>Glucose standard curve for measuring glucose concentration by DNS method.</figcaption>\r\n</figure>\r\n\r\n<p> </p>\r\n</div>\r\n\r\n<p><strong>Effect of incubation period on cellulase activity</strong><br />\r\nThe experiment was carried out to find out the effect of incubation time on the production of cellulose. The flasks containing 50 ml sterile production medium were inoculated with 10 ml seed culture and incubated for 3 days at optimum temperature.</p>"
},
{
"section_number": 3,
"section_title": "RESULTS",
"body": "<p><strong>Isolation and screening of cellulolytic bacteria from rumen fluid sample</strong><br />\r\nA number of cellulolytic bacterial colonies were isolated from the rumen fluid of cattle on CMC medium and screening of cellulolytic activity were visualized using Congo red staining 0.1%. Degradation of cellulose was indicated by the presence of a clear zone around the bacterial colonies as shown in <a href=\"#figure2\">Figure 2</a>. Strain was found to have cellulolytic activity and based on the cellulolytic index calculated by the diameter of the clear zone; the isolate had cellulolytic activity. +2.5 cm (<a href=\"#figure2\">Figure 2</a>). Clear zone producing bacterial isolates were then subjected to various biochemical tests [<a href=\"#r-26\">26</a>] .</p>\r\n\r\n<div id=\"figure2\">\r\n<figure class=\"image\"><img alt=\"\" height=\"286\" src=\"/media/article_images/2023/02/06/178-1643719256-Figure2.jpg\" width=\"330\" />\r\n<figcaption><strong>Figure 2. </strong>Visualization of cellulolytic activity based on the cellulolytic index.</figcaption>\r\n</figure>\r\n\r\n<p> </p>\r\n</div>\r\n\r\n<p><strong>Biochemical test for genus identification</strong><br />\r\nResults from the biochemical tests, it was observed that the bacterium was a gram-negative and rod shaped. Bubbles of oxygen gas were generated on the slide when the amylolytic bacterial colonies were brought for catalase test that indicates the isolates have the ability to catalyze H<sub>2</sub>O<sub>2</sub>. Enzyme Catalase catalyzes the breakdown of H<sub>2</sub>O<sub>2 </sub>and O<sub>2</sub>. Hydrogen peroxide (H<sub>2</sub>O<sub>2</sub>) is toxic to cells and so it stimulates enzymes in cells. In case of oxidase test, the colonies showed positive results by producing purple color on moist filter paper that is able to produce cytochrome C oxidase (<a href=\"#Table-1\">Table 1</a>). The other genus confirmatory identification test was based on methyl red, voges-proskuer, glucose fermentation, citrate test and indole test. Among these, the bacterial colonies gave positive result for methyl red, voges-proskuer, glucose fermentation, citrate test except for indole test (<a href=\"#Table-1\">Table 1</a>). Based on biochemical and morphological test results, the isolates were identified to belong to the genus of <em>Pseudomonas</em> sp. This bacterial genus is gram negative; rod shaped and have cellulolytic activities.</p>\r\n\r\n<div id=\"Table-1\">\r\n<p><a href=\"https://jabet.bsmiab.org/table/178-1643719256-table1/\">Table-1</a><strong>Table 1. </strong>Biochemical test for identification of Genus.</p>\r\n\r\n<p> </p>\r\n</div>\r\n\r\n<p><strong>Effect of pH on cellulase production</strong><br />\r\nCellulase production by the <em>Pseudomonas</em> sp. isolated from rumen fluid of cattle was adjusted under varying cultural conditions and observed at different pH i.e. 6, 6.5, 7 after 72 hours of incubation at 37°C (<a href=\"#figure3\">Figure 3</a>). Maximum cellulase production was recorded at pH 7.0 (0.053 U/ml) and the minimum cellulase production was recorded at pH 6 and 6.5 (0.0011 U/ml) after 66 hours of cultivation period.</p>\r\n\r\n<div id=\"figure3\">\r\n<figure class=\"image\"><img alt=\"\" height=\"292\" src=\"/media/article_images/2023/02/06/178-1643719256-Figure3.jpg\" width=\"500\" />\r\n<figcaption><strong>Figure 3. </strong>Effect of different pH on cellulase production by the <em>Pseudomonas</em> sp.</figcaption>\r\n</figure>\r\n\r\n<p> </p>\r\n</div>\r\n\r\n<p><strong>Effect of temperature on cellulase production</strong><br />\r\nFor the production of cellulase enzyme, the identified bacteria (<em>Pseudomonas</em> sp.) was taken under different temperature 28°C, 32°C, 35° C, 37° C, 40° C and 43° C. Among them, the bacteria showed the highest level of cellulase production at 370 C (0.21 U/ml) (<a href=\"#figure4\">Figure 4</a>).</p>\r\n\r\n<div id=\"figure4\">\r\n<figure class=\"image\"><img alt=\"\" height=\"285\" src=\"/media/article_images/2023/14/06/178-1643719256-Figure4.jpg\" width=\"500\" />\r\n<figcaption><strong>Figure 4. </strong>Effect of temperature on the production of cellulase.</figcaption>\r\n</figure>\r\n\r\n<p> </p>\r\n</div>\r\n\r\n<p><strong>Effect of incubation period on cellulose production</strong><br />\r\nFor producing cellulase enzyme, the identified bacteria (Pseudomonas sp.) was taken under different incubation period 12,18, 24, 36, 48, 52, 66 and 72 hours. Among them, the bacteria showed the maximum production (0.053 U/ml) at 48 hours of incubation period (<a href=\"#figure5\">Figure 5</a>).</p>\r\n\r\n<div id=\"figure5\">\r\n<figure class=\"image\"><img alt=\"\" height=\"265\" src=\"/media/article_images/2023/14/06/178-1643719256-Figure5.jpg\" width=\"500\" />\r\n<figcaption><strong>Figure 5. </strong>Effect of incubation period on the production of cellulase.</figcaption>\r\n</figure>\r\n\r\n<p> </p>\r\n</div>\r\n\r\n<p><strong>Effect of cellulase enzyme on filter paper</strong><br />\r\nThe result of the test was strong evident that cellulase was produced in order to degrade cellulose. CMC was most effective as a carbon source for cellulose enzyme production by <em>Pseudomonus</em> sp. result in increase in enzyme activity [<a href=\"#r-27\">27</a>]. The application of cellulase enzyme was carried by using double ring 102 filter paper. It was observed that the cellulase enzyme showed maximum degradation in 2nd day under 5 days of incubation in shaking incubator (<a href=\"#figure6\">Figure 6</a>).<br />\r\nIn short, it was found that isolated bacterium was <em>Pseudomonus </em>sp<em>. </em>Where CMC used as the production media. This bacterium produced optimum level of cellulase at 37°C, maximum production occurred at 48 hours of incubation period at pH 7 and filter paper degradation was highest at 2nd day of incubation.</p>\r\n\r\n<div id=\"figure6\">\r\n<figure class=\"image\"><img alt=\"\" height=\"298\" src=\"/media/article_images/2023/14/06/178-1643719256-Figure6.jpg\" width=\"500\" />\r\n<figcaption><strong>Figure 6. </strong>Observation of cellulase enzyme activity on filter paper.</figcaption>\r\n</figure>\r\n\r\n<p> </p>\r\n</div>"
},
{
"section_number": 4,
"section_title": "DISCUSSION",
"body": "<p>As cellulose is abundant in nature and awaited to be converted into more valuable products used for mankind. Numerous microorganisms capable of converting polysaccharide cellulose into simple carbohydrates had been revealed for decades. Cellulase enzyme that is commonly used in several industries, the present study was dealt with isolation, identification and biochemical characterization of cellulolytic bacteria and assessed their potentiality. The cellulose-containing rumen fluid of cattle samples was used for this study, where only one bacterial isolates were identified with higher enzymatic activities, cellulose degraders and considered to use as cellulose degradation to decompose plants more effectively [<a href=\"#r-28\">28</a>].<br />\r\nCMC media is utilized for cellulose production as well as the identification and screening of cellulolytic bacteria by the formation of a clear hydrolytic zone [<a href=\"#r-29\">29, 30</a>]. When CMC is used as a substrate, more cellulose is produced, which could be due to the enzyme being introduced, as cellulose is known to be a universal inducer of cellulase synthesis.<br />\r\n<em>Pseudomonas</em> sp., a cellulolytic bacterium, was isolated from cattle rumen fluid. This bacterial isolate was identified by morphological, biochemical, and physiochemical characteristics. Biochemical tests have been carried for the identification of unknown genus as described by Cowan and Steel [<a href=\"#r-31\">31</a>]. In the present study cellulase production by the bacteria was observed. The major concern of present study is to keep an eye on the cellulase manufacturing circumstances. The most prominent features for optimizing enzyme production, according to Pelczar et al. [<a href=\"#r-32\">32</a>], are pH and temperature. In the manufacturing of enzymes, the incubation duration is equally important. <em>Pseudomonas</em> sp. produced optimal cellulase at various pH, temperatures, and incubation times. Optimum temperature for this study was 40°C but a considerable amount of cellulase is produced from 35°C. Sohag et al. [<a href=\"#r-33\">33</a>] and Khatiwada et al. [<a href=\"#r-34\">34</a>] also found that optimum temperature was 40°C for <em>Pseudomonas</em> sp. It was previously reported that cellulolytic bacteria produced highest level of cellulase at a pH range of 6.0-7.5 [<a href=\"#r-35\">35, 36</a>] and enzyme production through <em>Pseudomonas</em> sp. is required similar criteria and result found same as the previous study conducted by other researchers. The highest production of cellulase enzyme by <em>Pseudomonas</em> sp. was observed at pH 7.0 under 3 days of cultivation which is similar as the results of the experiment conducted by Sohag et al. [<a href=\"#r-33\">33</a>] and Khatiwada et al. [<a href=\"#r-34\">34</a>]. The highest enzyme activity was observed at pH 7.0 with cellulosic filter paper for 5 days of incubation and its maximum activity was noted at 48 hours. The result of study shows that the <em>Pseudomonas</em> sp. is a good producer of extra cellular enzyme cellulase which can be also beneficial for the degradation of cellulosic pollutants of environment.<br />\r\nThe collection of more bacterial isolates from rumen fluid sample and genetic engineering approach would provide more pace to degrade the organic wastes that is now a concern for the development of ecologically sound and health promoting ways for the management of the environment.</p>"
},
{
"section_number": 5,
"section_title": "CONCLUSIONS",
"body": "<p>Cellulase offers an important opportunity to bring great benefits to the use of biomass [<a href=\"#r-37\">37</a>]. Cellulose-degrading microorganisms can alter cellulose into diverse soluble sugars by either enzymatic hydrolysis or acidic reaction. A significant amount of cellulase was produced by <em>Pseudomonas </em>sp<em>. </em>using cellulosic substrates in shake flask with optimized parameters. This bacterium is an important species and showed better cellulolytic activity. Besides, the crude enzyme isolated from <em>Pseudomonas </em>sp<em>. </em>acted efficiently for degradation of filter paper. So, it is expected that this bacterial species can be a good source to remove cellulosic pollutants from the environment. Using various techniques, in the case of cellulase, it can convey performance industrial application. In future, study of fungus can be isolated from rumen fluid and cellulolytic activity of that fungus could be monitored.</p>"
},
{
"section_number": 6,
"section_title": "ACKNOWLEDGEMENT",
"body": "<p>This work is funded by Ministry of Science and Technology (MoST), Government of the People’s Republic of Bangladesh.</p>"
},
{
"section_number": 7,
"section_title": "AUTHOR CONTRIBUTIONS",
"body": "<p>MMHK designed and supervised the overall research work; NYP and SM performed the research work; MNH wrote the manuscript and analyzed the data; AKA revised the manuscript and some of the lab works has conducted in his laboratory; MH critically overviewed the manuscript. All authors revised and approved the final version of the manuscript.</p>"
},
{
"section_number": 8,
"section_title": "CONFLICTS OF INTEREST",
"body": "<p>There is no conflict of interest among the authors.</p>"
}
],
"figures": [
{
"figure": "https://jabet.bsmiab.org/media/article_images/2023/02/06/178-1643719256-Figure1.jpg",
"caption": "Figure 1. Glucose standard curve for measuring glucose concentration by DNS method.",
"featured": false
},
{
"figure": "https://jabet.bsmiab.org/media/article_images/2023/02/06/178-1643719256-Figure2.jpg",
"caption": "Figure 2. Visualization of cellulolytic activity based on the cellulolytic index.",
"featured": false
},
{
"figure": "https://jabet.bsmiab.org/media/article_images/2023/02/06/178-1643719256-Figure3.jpg",
"caption": "Figure 3. Effect of different pH on cellulase production by the Pseudomonas sp.",
"featured": false
},
{
"figure": "https://jabet.bsmiab.org/media/article_images/2023/14/06/178-1643719256-Figure4.jpg",
"caption": "Figure 4. Effect of temperature on the production of cellulase.",
"featured": false
},
{
"figure": "https://jabet.bsmiab.org/media/article_images/2023/14/06/178-1643719256-Figure5.jpg",
"caption": "Figure 5. Effect of incubation period on the production of cellulase.",
"featured": false
},
{
"figure": "https://jabet.bsmiab.org/media/article_images/2023/14/06/178-1643719256-Figure6.jpg",
"caption": "Figure 6. Observation of cellulase enzyme activity on filter paper.",
"featured": false
}
],
"authors": [
{
"id": 333,
"affiliation": [
{
"affiliation": "Department of Biochemistry and Molecular Biology, Khulna Agricultural University, Khulna -9100, Bangladesh"
}
],
"first_name": "Nilufa Yasmin",
"family_name": "Poly",
"email": null,
"author_order": 1,
"ORCID": null,
"corresponding": false,
"co_first_author": false,
"co_author": false,
"corresponding_author_info": "",
"article": 89
},
{
"id": 334,
"affiliation": [
{
"affiliation": "Faculty of Biotechnology and Genetic Engineering, Sylhet Agricultural University, Sylhet-3100, Bangladesh."
}
],
"first_name": "Sabrina",
"family_name": "Mamtaz",
"email": null,
"author_order": 2,
"ORCID": null,
"corresponding": false,
"co_first_author": false,
"co_author": false,
"corresponding_author_info": "",
"article": 89
},
{
"id": 335,
"affiliation": [
{
"affiliation": "Department of Biochemistry and Chemistry, Sylhet Agricultural University, Sylhet-3100, Bangladesh."
}
],
"first_name": "Mohammad Mehedi Hasan",
"family_name": "Khan",
"email": "khanmmh.biochem@sau.ac.bd",
"author_order": 3,
"ORCID": "http://orcid.org/0000-0002-4814-3065",
"corresponding": true,
"co_first_author": false,
"co_author": false,
"corresponding_author_info": "Mohammad Mehedi Hasan Khan, PhD; Department of Biochemistry and\r\nChemistry, Sylhet Agricultural University, Sylhet, Bangladesh, e-mail: khanmmh.biochem@sau.ac.bd",
"article": 89
},
{
"id": 336,
"affiliation": [
{
"affiliation": "Department of Biochemistry and Molecular Biology, Khulna Agricultural University, Khulna -9100, Bangladesh"
}
],
"first_name": "Md. Najmol",
"family_name": "Hoque",
"email": null,
"author_order": 4,
"ORCID": null,
"corresponding": false,
"co_first_author": false,
"co_author": false,
"corresponding_author_info": "",
"article": 89
},
{
"id": 337,
"affiliation": [
{
"affiliation": "Department of Genetic Engineering and Biotechnology, Shahjalal University of Science and Technology, Sylhet-3100, Bangladesh"
}
],
"first_name": "Abul Kalam",
"family_name": "Azad",
"email": null,
"author_order": 5,
"ORCID": null,
"corresponding": false,
"co_first_author": false,
"co_author": false,
"corresponding_author_info": "",
"article": 89
},
{
"id": 338,
"affiliation": [
{
"affiliation": "Pharmaceutical and Industrial Biotechnology, Sylhet Agricultural University, Sylhet-3100, Bangladesh"
}
],
"first_name": "Mahmudul",
"family_name": "Hasan",
"email": null,
"author_order": 6,
"ORCID": null,
"corresponding": false,
"co_first_author": false,
"co_author": false,
"corresponding_author_info": "",
"article": 89
}
],
"views": 1531,
"downloads": 241,
"references": [
{
"id": 2711,
"serial_number": 1,
"pmc": null,
"reference": "Khaleel HL, Abd AN, Ali KM. Preparation of Nano-Cellulose from Industrial Waste by Ultrasonic Device. Journal of Biochemical Technology 2018; 9: 35.",
"DOI": null,
"article": 89
},
{
"id": 2712,
"serial_number": 2,
"pmc": null,
"reference": "Zaghoud L, Gouamid M, Benmenine A, Khanblouche A. Kinetic and Thermodynamic of Gentian Violet Removal by 2, 3-Dialdehyde Nanocellulose. Journal of Biochemical Technology 2019; 10: 38-42.",
"DOI": null,
"article": 89
},
{
"id": 2713,
"serial_number": 3,
"pmc": null,
"reference": "Malherbe S, Cloete TE. Lignocellulose biodegradation: fundamentals and applications. Reviews in Environmental Sciences and Biotechnology 2003; 1: 105-114.",
"DOI": null,
"article": 89
},
{
"id": 2714,
"serial_number": 4,
"pmc": null,
"reference": "Li X, Gao P. Isolation and partial properties of cellulose-decomposing strain of Cytophaga sp. LX-7 from the soil. J. Appl. Microbiol. 2008; 82: 73-80.",
"DOI": null,
"article": 89
},
{
"id": 2715,
"serial_number": 5,
"pmc": null,
"reference": "Cheng Q, Wang J, McNeel JF, Jacobson PM. Water Retention Value Measurements of Cellulosic Materials Using a Centrifuge Technique. BioResources 2010; 5: 1945-1954.",
"DOI": null,
"article": 89
},
{
"id": 2744,
"serial_number": 6,
"pmc": null,
"reference": "Acharya A, Joshi DR, Shrestha K, Bhatta DR. Isolation and screening of thermophilic cellulolytic bacteria from compost piles. Scientific world. 2012; 10: 43-6.",
"DOI": null,
"article": 89
},
{
"id": 2745,
"serial_number": 7,
"pmc": null,
"reference": "Lu WJ, Wang HT, Nie YF. Effect of inoculating flower stalks and vegetable waste with lignocellulolytic microorganisms on the composting process. Journal of Environmental Science and Health 2004; 39: 871–887.",
"DOI": null,
"article": 89
},
{
"id": 2746,
"serial_number": 8,
"pmc": null,
"reference": "Maki M, Leung KT, Qin W. The prospects of cellulase-producing bacteria for the bioconversion of lignocellulosic biomass. Int. J. Biol. Sci. 2009; 5: 500-516.",
"DOI": null,
"article": 89
},
{
"id": 2747,
"serial_number": 9,
"pmc": null,
"reference": "Ojumu T, Solomon V, Bamidele O, Betiku E, Layokun SK. Cellulase Production by Aspergillus flavus Linn Isolate NSPR 101 fermented in sawdust, bagasse and corncob. African J. Biotechnol. 2003; 2: 150–152.",
"DOI": null,
"article": 89
},
{
"id": 2748,
"serial_number": 10,
"pmc": null,
"reference": "Gomashe AV, Gulhane PA, Bezalwar PM. Isolation and screening of cellulose degrading microbes from Nagpur region soil. International Journal of Life Science 2013; 1: 291-293.",
"DOI": null,
"article": 89
},
{
"id": 2749,
"serial_number": 11,
"pmc": null,
"reference": "Haakana H, Mittinen-Oinonen A, Joutsjoki V, Mantyla A, Souminen P, Vahmaanpera J. Cloning of cellulase from Melanocarpus albomyces and their efficient expression in Trichoderma reesei. Enzyme Microbial Technology 2004; 34: 159-167.",
"DOI": null,
"article": 89
},
{
"id": 2750,
"serial_number": 12,
"pmc": null,
"reference": "Ashjaran A, Sheybani S. Drug Release of Bacterial Cellulose as Antibacterial Nano Wound Dressing. International Journal of Pharmaceutical Research & Allied Sciences 2019; 8 :137-143.",
"DOI": null,
"article": 89
},
{
"id": 2751,
"serial_number": 13,
"pmc": null,
"reference": "Godana B, Mitra R, Singh S. Production of Enzymes for Application on Animal Feeds. Submitted in partial fulfillment of the requirements for the degree of Master of Technology (Biotechnology), Department of Biotechnology, Faculty of Science, Engineering and the Built Environment, Durban University of Technology, Durban, South Africa 2007.",
"DOI": null,
"article": 89
},
{
"id": 2752,
"serial_number": 14,
"pmc": null,
"reference": "Gautam SP, Bundela PS, Pandey AK, Awasthi MK, Sarsaiya S. Composting of municipal solid waste of Jabalpur City. Global Journal of Environmental Research 2010; 24: 43–46.",
"DOI": null,
"article": 89
},
{
"id": 2753,
"serial_number": 15,
"pmc": null,
"reference": "Sreeja SJ, Malar PWJ, Joseph FRS, Tiburcius S, Immanuel G, Palavesam A. Optimization of cellulase production by Bacillus altitudinis APS MSU and Bacillus licheniformis APS2 MSU, gut isolates of fish Etroplussuratensis. Int. J. Adv. Res. & Tech. 2013; 2: 401-406.",
"DOI": null,
"article": 89
},
{
"id": 2754,
"serial_number": 16,
"pmc": null,
"reference": "Angsana R, Warinthorn S, Annoop N, Pawinee C. Combination effect of pH and acetate on enzymatic cellulose hydrolysis. Journal of Environmental Science 2009; 21: 965- 970.",
"DOI": null,
"article": 89
},
{
"id": 2755,
"serial_number": 17,
"pmc": null,
"reference": "Doi RH. Cellulase of mesophilic microbes: cellulosome and non–cellulosome producers. Ann. N.Y. Acad. Sci. 2008; 1125: 267–279.",
"DOI": null,
"article": 89
},
{
"id": 2756,
"serial_number": 18,
"pmc": null,
"reference": "Khan MMH, Chaudhry AS. Comparing Rumen Fluid to Buffer Ratios to Estimate in vitro Degradability, Fermentation, and Methane Profiles of Seven Forages at Two Incubation Times. Iranian Journal of Applied Animal Science 2021; 11: 431-441.",
"DOI": null,
"article": 89
},
{
"id": 2757,
"serial_number": 19,
"pmc": null,
"reference": "Cappucino JG, Sherman N. Microbiology a Laboratory Mannual. 2th Ed. California: The Benjamins Columningn Publishers Company. 1987.",
"DOI": null,
"article": 89
},
{
"id": 2758,
"serial_number": 20,
"pmc": null,
"reference": "Faridha BI, Meignanalaksmi S, Pandima DM. Isolation and Characterization of Cellulase Producing Paracoccus Pantotrophus fmr19 (jx012237) from Goat Rumen Fluid and Its Effects on pH, Temperature and Carbon Sources. International Journal of Advanced Biotechnology and Research 2013; 4: 384-390.",
"DOI": null,
"article": 89
},
{
"id": 2759,
"serial_number": 21,
"pmc": null,
"reference": "Sharma N, Baliarsingh S, Kaushik GG. Serum Electrolytes Changes with Atherogenic Index of Plasma in Hypothyroid Hiabetic (type-2) Young Males. International Journal of Pharmaceutical Science and Research 2013; 4: 3046-3050.",
"DOI": null,
"article": 89
},
{
"id": 2760,
"serial_number": 22,
"pmc": null,
"reference": "Kasana R, et al. A rapid and easy method for the detection of microbial cellulases on agar plates using gram s iodine. Current Microbiology 2008; 57: 503-507.",
"DOI": null,
"article": 89
},
{
"id": 2761,
"serial_number": 23,
"pmc": null,
"reference": "Howard RL, Abotsi E, Jansen V, Rensburg EL, Howard S. Lignocellulose biotechnology: issues of bioconversion and enzyme production. Review: African Journal of Biotechnology 2003; 12: 602-619.",
"DOI": null,
"article": 89
},
{
"id": 2762,
"serial_number": 24,
"pmc": null,
"reference": "Ariffin H, Abdullah N, Hasan MA. Production and Characterization of Cellulase by Bacillus pumilus EB3, International Journal of Environmental Technology 2006; 3: 44-53.",
"DOI": null,
"article": 89
},
{
"id": 2763,
"serial_number": 25,
"pmc": null,
"reference": "Mandels M, Weber J. The production of celluases and their applications. Hajny, G.J. and E.T. Resse (ed.), Amer. Chem. Soc. Adv. Ser. 1969; 95: 391 -414.",
"DOI": null,
"article": 89
},
{
"id": 2764,
"serial_number": 26,
"pmc": null,
"reference": "Khatiwada P, Ahmed J, Sohag MH, Islam K, Azad AK. Isolation, screening and characterization of cellulase producing bacterial isolates from municipal solid wastes and rice straw wastes. J Bioprocess Biotech. 2016; 6: 2.",
"DOI": null,
"article": 89
},
{
"id": 2765,
"serial_number": 27,
"pmc": null,
"reference": "Gautam SP, Bundela PS, Pandey AK, Awasthi MK, Sarsaiya S. Composting of municipal solid waste of Jabalpur City. Global Journal of Environmental Research 2010; 24: 43–46.",
"DOI": null,
"article": 89
},
{
"id": 2766,
"serial_number": 28,
"pmc": null,
"reference": "Mahmood R, Afrin N, Jolly SN, Shilpi RY. Isolation and identification of cellulose-degrading bacteria from different types of samples. World 2020; 9: 8-13.",
"DOI": null,
"article": 89
},
{
"id": 2767,
"serial_number": 29,
"pmc": null,
"reference": "Das P, Solanki R, Khanna M. Isolation and screening of cellulolytic actinomycetes from diverse habitats. International Journal of Advanced Biotechnology and Research 2014; 5:4 38-451.",
"DOI": null,
"article": 89
},
{
"id": 2768,
"serial_number": 30,
"pmc": null,
"reference": "Gomashe AV, Gulhane PA, Bezalwar PM. Isolation and screening of cellulose degrading microbes from nagpur region soil. Int. J. of Life Sciences 2013; 1: 291-293.",
"DOI": null,
"article": 89
},
{
"id": 2769,
"serial_number": 31,
"pmc": null,
"reference": "Cowan I, Steel ST. Cowan and Steel’s Manual for the identification of medical bacteria.3rd edn. Cambridge University Press, London. 1974.",
"DOI": null,
"article": 89
},
{
"id": 2770,
"serial_number": 32,
"pmc": null,
"reference": "Pelczar JM, Chan ECS, Krieg RN. Microbiology. 5th edition 2004. Tata McGraw Hill, New Delhi, India.",
"DOI": null,
"article": 89
},
{
"id": 2771,
"serial_number": 33,
"pmc": null,
"reference": "Sohag MMH, Hasan MM, Ahmed J, Daud SNA, Alam MK, Amin MR, Azad AK. Production and Partial Characterization of Cellulase from Pseudomonas Isolates Obtained from Cow Dung and Municipal Solid Wastes. Bangladesh Journal of Microbiology 2013; 30: 11-16.",
"DOI": null,
"article": 89
},
{
"id": 2772,
"serial_number": 34,
"pmc": null,
"reference": "Khatiwada P, Ahmed J, Sohag MH, Islam K., Azad AK. Isolation, screening and characterization of cellulase producing bacterial isolates from municipal solid wastes and rice straw wastes. J Bioprocess Biotech 2016; 6: 280- 2.",
"DOI": null,
"article": 89
},
{
"id": 2773,
"serial_number": 35,
"pmc": null,
"reference": "Otajevwo FD, Aluyi HSA. Cultural conditions necessary for optimal cellulase yield by cellulolytic bacterial organisms as they relate to residual sugars released in broth medium. Modern Applied Science 2011; 5: 141.",
"DOI": null,
"article": 89
},
{
"id": 2774,
"serial_number": 36,
"pmc": null,
"reference": "Kushwaham A, Vipul V, Alpika V. Isolation & production of cellulase enzyme from bacteria isolated from agricultural fields in district Hardoi, Uttar Pradesh, India. Advances in Applied Science Research 2012; 3: 171-174.",
"DOI": null,
"article": 89
},
{
"id": 2775,
"serial_number": 37,
"pmc": null,
"reference": "Wen Z, Liao W, Chen S. Production of cellulase by Trichoderma reesei from dairy manure. Bioresource Technology 2005; 96 :4 91-499.",
"DOI": null,
"article": 89
}
]
},
{
"id": 87,
"slug": "178-1643767322-study-on-relationship-between-genetic-abnormalities-and-clinicopathological-features-in-k-hospitals-patients-with-colorectal-cancer",
"featured": false,
"slider": false,
"issue": "Vol5 Issue2",
"type": "short_communication",
"manuscript_id": "178-1643767322",
"recieved": "2022-02-02",
"revised": null,
"accepted": "2022-04-21",
"published": "2022-04-25",
"pdf_file": "https://jabet.bsmiab.org/media/pdf_file/2023/34/178-1643767322.pdf",
"title": "Study on relationship between genetic abnormalities and clinicopathological features in K hospital’s patients with colorectal cancer",
"abstract": "<p>The MAPK-ERK, as well as PI3K-AKT signaling transduction pathway, represents a pivotal function in tumorigenesis. Genetic alterations of potential tumor-driven genes, for instance, <em>KRAS</em>, <em>BRAF</em>, <em>NRAS,</em> and <em>PIK3CA </em>can result in uncontrolled cell proliferation and progression. The main aims of the study were not only to identify the prevalence of <em>KRAS, BRAF, NRAS, PIK3CA</em> molecular modifications but also to evaluate the relationship between gene changes and clinical and/or pathological characteristics of 251 Vietnamese colorectal cancer. Genetic abnormalities on <em>KRAS, BRAF, NRAS,</em> and <em>PIK3CA</em> were detected through the utility of Realtime PCR, Pyrosequencing, and Direct sequencing methods, respectively. The frequency of <em>KRAS, BRAF, NRAS,</em> and <em>PIK3CA</em> mutations were 34.3%, 6.4%, 7.2%, and 17.5%, in turn. <em>KRAS </em>mutation was mutually exclusive against that of <em>NRAS</em> and <em>BRAF</em> mutations in CRC. <em>BRAF</em>, as well as<em> RAS/RAF </em>mutations<em>,</em> were more usual in older age. A significant association between <em>PIK3CA</em> mutations and age together with differentiation of CRC was determined. In addition, <em>PIK3CA</em> mutation tended to coexist with <em>KRAS</em> but not with <em>NRAS</em> and <em>BRAF</em> mutation. Our results indicate the information of molecular markers that contribute to self-sufficient oncogenic mechanisms in the carcinogenesis of CRC.</p>",
"journal_reference": "J Adv Biotechnol Exp Ther. 2022; 5(2): 408-416.",
"academic_editor": "Md Jamal Uddin, PhD; Ewha Womans University, Seoul, South Korea",
"cite_info": "Vuong LD, Chu HH, et al. Study on relationship between genetic abnormalities and clinicopathological features in K hospital’s patients with colorectal cancer. J Adv Biotechnol Exp Ther. 2022; 5(2): 408-416.",
"keywords": [
"Clinicopathological parameters",
"Colorectal cancer",
"Genetic abnormalities"
],
"DOI": "10.5455/jabet.2022.d124",
"sections": [
{
"section_number": 1,
"section_title": "INTRODUCTION",
"body": "<p>Worldwide, colorectal cancer (CRC) is one of the majority types of cancer, which is the third most widely examined and the fourth malignant neoplastic disease-related mortality. The percentage of Caucasians CRC has been given a picture of being more superior to the Asian Ethnic. For the time being, the occurrence of cancer from parts of the large intestine was considerably accelerated in Asian countries including China, the Republic of Korea, and Vietnam, and there is a speedily rising tendency in the future, which may potentially be related to risk elements such as nutritional factors, diet modification, physical inactivity, the habit of smoking and extravagant alcohol dependence and environmental contamination [<a href=\"#r-1\">1, 2</a>].<br />\r\nActivating mutations in the RAS-RAF-MAPK pathway including <em>KRAS</em>, <em>BRAF</em>, and <em>NRAS</em> abnormalities have been demonstrated to be major prognostic factors about resistance in the expectation of anti- Epidermal Growth Factor Receptor (anti-EGFR) medications. Patients with wild-type <em>KRAS</em>, <em>NRAS</em>, and <em>BRAF</em> display clinical sensitivity to this targeted therapy [<a href=\"#r-3\">3</a>]. Since it’s important to determine <em>RAS</em>/<em>RAF</em> mutation before using cetuximab and panitumumab. This allows us to precisely predict the efficacy of anti-EGFR monoclonal antibodies (mAb) as well as understand the molecular characteristics of CRC [<a href=\"#r-3\">3</a>].<br />\r\nIn addition, Phosphoinositide-3-kinase (PI3K) is the family of lipid kinases in the PI3K/AKT/mTOR transduction route, that assumes a variety of cellular functions and is often dysregulated in solid tumors. Abundant studies have been evidence of activated tumor-derived <em>PIK3CA</em> mutations were observed in many malignancies including CRC [<a href=\"#r-4\">4, 5</a>]. <em>PIK3CA</em> mutation is present in 10-20% of colorectal cancer, in which approximately 80% of variant regions on the subject of the helical along with kinase domains of exon 9 and 20, correspondingly [<a href=\"#r-5\">5</a>]. The <em>PIK3CA</em> mutation is closely associated with <em>KRAS</em> mutations and epigenetic modifications, in particular coincidental hypermethylation of numerous CpG-rich promoters of several genes (the CpG island methylator phenotype, or CIMP) [<a href=\"#r-6\">6</a>]. Monoclonal antibody drugs targeting EGFR such as cetuximab and panitumumab are major target therapy in malignant colorectal cancer, however, <em>PIK3CA</em> pathogenic variant carriers could potentially belong less susceptible toward these target drugs [<a href=\"#r-7\">7</a>]. This suggests that genetic abnormalities of RAS/RAF and PI3K pathway should be evaluated to guide the anti-EGFR treatment. Furthermore, identifying interactions between genetic changes in <em>KRAS</em>, <em>BRAF</em>, <em>NRAS,</em> and <em>PIK3CA</em> oncogenes may help to understand the detailed carcinogenesis mechanism of colorectal tumors, in addition to explaining differences in healing response among individual patients. <em>RAS</em>, <em>RAF</em>, and <em>PIK3CA</em> abnormalities induce to activate of the MAPK and PI3K signaling transduction paths, resulting in the interior of consolidative or conglomerative impact on the edge of being alive of CRC sufferers [<a href=\"#r-8\">8, 9</a>]. Although new insights into the mechanisms have emerged from recent studies, information about molecular changes in Vietnamese CRC patients remains unclear. Hence, this research was designed to meet the needs of frequency in tandem with the dispensation of genetic variations in <em>KRAS</em>, <em>NRAS</em>, <em>BRAF</em> along <em>PIK3CA</em>, on top of that correlation of each with the clinicopathological parameters of the Vietnamese CRC population.</p>"
},
{
"section_number": 2,
"section_title": "MATERIALS AND METHODS",
"body": "<p><strong>Obtaining tissue specimens</strong><br />\r\nDuring the time between Nov 2019 and Oct 2021, we gathered 251 formalin-fixed paraffin-embedded (FFPE) clinical blocks according to the criteria each sample was pathological diagnosed based on the American Joint Committee on Cancer (AJCC) and operated surgical intervention on the edge of National Cancer Hospital K in Vietnam. The patient’s tumor samples used in the study were not only obtained informed consent but also licensed all through the ordinances of the Vietnamese morality commission (Circular No.04/2008/TT-BYT). Sections (5μm thick) were cut from paraffin-embedded tumor tissue blocks and stained with Hematoxylin & Eosin using the Thermo Fisher Scientific system for histopathological examination, following the manufacturer’s protocol.</p>\r\n\r\n<p> </p>\r\n\r\n<p><strong>DNA isolation from CRC tissue</strong><br />\r\nQIAamp DNA FFPE Tissue Kit (Qiagen) was utilized for genomic DNA extraction from formalin-fixed paraffin-embedded tissues. The quality of DNA specimens was evaluated utilizing polymerase chain reaction (PCR) which amplified a single-copy gene, <em>β-globin</em>. Besides, the NanoDrop ND-1000 spectrophotometer (Thermo Fisher Scientific) allows resolving the total DNA amount for this study.</p>\r\n\r\n<p> </p>\r\n\r\n<p><strong>Investigation of <em>KRAS</em>, <em>BRAF,</em> <em>NRAS,</em> and <em>PIK3CA</em> genetic changes from CRC tissue</strong><br />\r\nCobas® KRAS Mutation Test, Cobas® 4800 BRAF V600 Mutation Test (Roche) together with therascreen <em>NRAS </em>Pyro Kit (Qiagen) were used to identify mutations of <em>KRAS</em> exon 2-3; <em>BRAF</em> V600 on exon 15 and <em>NRAS</em> exon 2-3, respectively. <em>PIK3CA </em>transformations in the interior of the exon 9 in tandem with 20 were discovered through the utility of 3130 Genetic Analyzer (Applied Biosystems). All procedures were exactly performed as mentioned by the manufacturers’ instructions. Primer sequences were detailed inward of <a href=\"#Table-1\">Table 1</a>.</p>\r\n\r\n<div id=\"Table-1\">\r\n<p><a href=\"https://jabet.bsmiab.org/table/178-1643767322-table1/\">Table-1</a><strong>Table 1.</strong> Primer sequences used for the study.</p>\r\n\r\n<p> </p>\r\n</div>\r\n\r\n<p><strong>Statistical analysis</strong><br />\r\nThe frequency of <em>KRAS</em>, <em>BRAF</em>, <em>NRAS,</em> and <em>PIK3CA</em> alterations accompanying the correlation between genetic abnormalities, and clinicopathological characteristics of colorectal cancer was evaluated by SPSS software version 20.0. In the present study, the association of variables is measured through the utility of the Fisher’s exact test or else χ<sup>2</sup> test. The probability meaning in the expectation of the entirety of experiments was established at p < 0.05.</p>"
},
{
"section_number": 3,
"section_title": "RESULTS",
"body": "<p><strong>Clinicopathological parameters of patients with colorectal cancer</strong><br />\r\nClinicopathological features of 251 CRC patients in this study were showed in Table 2. Among 251 patients, the intermediate-age getting on for diagnosis was 59.3 years (ranging from 26 to 90 years). On the other hand, the proportion in respect to male to female patients was 1.28. Two hundred fifty-one patients with colorectal cancer including 136 (54.2%) and 115 (45.8%) were collected from the colon and rectum, respectively. Based on histological category, there were 187 (74.5%) adenocarcinoma (A), 54 (21.5%) mucinous adenocarcinoma (MA), 7 (2.8%) squamous cell carcinoma (SCC), and 3 (1.2%) signet ring cell carcinoma (SRCC) (<a href=\"#figure1\">Figure 1</a>). As for tumor differentiation, 12 (4.8%) were well-differentiated, 160 (63.7%) moderately differentiated, and 15 (6.0%) poorly differentiated (excluding 54 mucinous adenocarcinomas, 7 squamous cell carcinomas, and 3 signet ring cell carcinoma). In our study, a predominant part of tumors (71.7%) was smaller than 5 cm in measurement, with a balanced lymph node metastasis status ratio. Pathologic stages showed 4 (1.6%) cases within stage I, 112 (44.6%) cases enclosed by stage II, 115 (45.8%) sufferers in stage III, in tandem with 20 (8.0%) patients in stage IV (<a href=\"#Table-2\">Table 2</a>).</p>\r\n\r\n<div id=\"figure1\">\r\n<figure class=\"image\"><img alt=\"\" height=\"110\" src=\"/media/article_images/2023/29/06/178-1643767322-Figure1.jpg\" width=\"500\" />\r\n<figcaption><strong>Figure 1. </strong>Representative images of H&E staining for histological subtypes. (A) Adenocarcinoma. (B) Mucinous adenocarcinoma. (C) Squamous cell carcinoma. (D) Signet ring cell carcinoma. Photographs were taken at ×200 magnification. Scale bar, 100 μm.</figcaption>\r\n</figure>\r\n\r\n<p> </p>\r\n</div>\r\n\r\n<div id=\"Table-2\">\r\n<p><a href=\"https://jabet.bsmiab.org/table/178-1643767322-table2/\">Table-2</a><strong>Table 2.</strong> Clinical and pathological parameters in the patients owing to CRC.</p>\r\n\r\n<p> </p>\r\n</div>\r\n\r\n<p><strong>The rate together with the distribution of <em>KRAS</em>, <em>NRAS</em>, <em>BRAF,</em> and also <em>PIK3CA</em> mutations in addition to their interrelations with clinicopathologic characteristics in patients with CRC</strong><br />\r\nTable 3 detailed genetic abnormalities in 251 CRC tissue blocks. Our results showed that 86 cases had <em>KRAS</em> mutation, reaching 34.4%, which include 77 patients who harbored mutation situated at codon 12/13 belonging to the exon 2 combined with 9 sufferers found in codon 61 coming out of the exon 3. 17 out of 18 (6.8%) <em>NRAS</em> alterations were distributed in adenocarcinoma. Of 18 <em>NRAS</em> mutations, a greater part of changes was found at codon 12/13 from the exon 2 with regards to 14 patients, achieving 77.8%. Only 4 patients carried an <em>NRAS</em> missense mutation at codon 61 from exon 3<em>. </em>There was no meaningful interaction amongst <em>KRAS</em> variations, <em>NRAS</em> mutation along with clinical and pathological features (agedness, sexual characteristics, tumor position, histological subtypes, differentiation, lymph node metastasis, tumor dimensions, and stage). <em>BRAF</em> mutation occurred in 6.4% (16/251) of cases in codon 600 of the exon 15. Compared with <em>RAF</em> wild-type tumors, <em>BRAF</em> mutant tumors were statistically associated with the younger group (p=0.023) (<a href=\"#Table-3\">Table 3</a>).<br />\r\nThe mutation of either <em>RAS</em> (<em>KRAS</em> and <em>NRAS</em>) or <em>BRAF</em> was detected in 47.8% (120/251) of the cases examined. A critical correlation inward of <em>RAS</em>/<em>RAF</em> modifications with patients’ age was observed within the bounds of our present study (p= 0.032). Regarding pathological parameters, <em>RAS</em>/<em>RAF</em> alterations tended also to be lightly correlated with histological subtypes (p=0.058), differentiation level (p=0.060), and lymph node malignancy status (p=0.059). Whereas <em>RAS</em>/<em>RAF </em>genetic changes in tandem with other clinicopathological features including patients’ gender, tumor location, tumor size, and stages did not show any association in CRC tumors (p>0.05) (Table 3).<br />\r\nIn addition, all data according to the rate in parallel with distribution concerning <em>PIK3CA</em> genetic changes were exhibited within the interior of this study. <em>PIK3CA</em> modification was identified in 44 samples (17.5%), of which 75.0% (33/44) and 25.0% (11/44) were occurred in exon 9 (including 7 E542 and 26 E545) and exon 20 (including 3 H1046, and 8 H1047), respectively (data not shown). The association between <em>PIK3CA</em> variant standing and clinical at the same time as pathological characteristics was not found in the Vietnamese patients with CRC. In contrast, a genetic abnormality in the <em>PIK3CA</em> gene had a higher incidence among males and moderately differentiated tumors (p<0.05).<br />\r\n<a href=\"#Table-4\">Table 4</a> illustrated the interrelationship between somatic alterations of <em>KRAS</em>, <em>BRAF</em>, <em>NRAS,</em> and <em>PIK3CA</em> gene. Our results confirmed that <em>KRAS</em> mutation exhibited a mutually exclusive with <em>NRAS</em> and <em>BRAF</em> mutation pattern in CRC and was a strong association with <em>PIK3CA </em>mutation (<em>p</em>< 0.05). Meanwhile, no statistical correlation was found between <em>BRAF </em>and/or <em>NRAS</em> and <em>PIK3CA</em> mutations (p> 0.05).</p>\r\n\r\n<div id=\"Table-3\">\r\n<p><a href=\"https://jabet.bsmiab.org/table/178-1643767322-table3/\">Table-3</a><strong>Table 3. </strong><em>KRAS</em>, <em>NRAS</em>, <em>BRAF</em> and <em>PIK3CA</em> somatic variations, as well as interrelationships together with clinical and pathological features.</p>\r\n</div>\r\n\r\n<div id=\"Table-4\">\r\n<p><a href=\"https://jabet.bsmiab.org/table/178-1643767322-table4/\">Table-4</a><strong>Table 4.</strong> Correlation with regards to <em>KRAS</em>, <em>NRAS</em>, <em>BRAF</em> and <em>PIK3CA</em> abnormalities in CRC.</p>\r\n\r\n<p> </p>\r\n</div>"
},
{
"section_number": 4,
"section_title": "DISCUSSION",
"body": "<p>The EGFR signaling transduction path is involved in many important functions inside the range of cells, which dysregulate to lead to uncontrolled growth, appearing in solid cancers, including CRC [<a href=\"#r-10\">10</a>]. Based on genetic alterations of this signaling pathway, cetuximab, panitumumab, nimotuzumab, and necitumumab is a group of targeting as concerns EGFR using a monoclonal antibody that has significantly improved the treatment, especially for patients with metastatic CRC [<a href=\"#r-11\">11</a>]. However, De Roock W et al. (2010) confirmed that genetic changes belonging to <em>KRAS</em>, <em>BRAF</em>, <em>NRAS,</em> and <em>PIK3CA </em>genes were related further to a lower response rate after making utilization done by anti-EGFR monoclonal antibodies [<a href=\"#r-12\">12</a>].<br />\r\nThe frequency in regard to <em>KRAS</em>, <em>BRAF</em>, <em>NRAS,</em> and <em>PIK3CA</em> modifications was found in 86 of having 251 (34.3%), 16 of 251 (6.4%), 18 of 251 (7.2%), and 44 of 251 (17.5%) patients examined, respectively. Interestingly, there were 135 (53.8%) cases of patients who carried an oncogenic mutation in at the minimum one gene, including <em>KRAS</em>, <em>BRAF</em>, <em>NRAS,</em> and/or <em>PIK3CA. </em>Our results indicated that out of 165 <em>KRAS</em> wild-type CRC patients, 49 (29.7%) harbor <em>NRAS</em>, <em>BRAF</em>, or <em>PIK3CA</em> mutations. The reported <em>KRAS</em> mutation rate in patients with CRC varies widely between different populations worldwide, ranging from 13% to 66% [<a href=\"#r-13\">13–16</a>]. In Vietnamese research, <em>KRAS</em> missense mutations at codons 12, 13, and 61 were detected in 34.3% of patients about CRC. Inside the range of our study, we discovered 34.3% of suffers harbored <em>KRAS</em> mutations, which was concordant according to reported data deriving out of Asian countries (i.e., China, Japan, and India) (20–66%), and lower than the one revealed surrounded by TCGA data (42%) [<a href=\"#r-17\">17</a>].<br />\r\nRat sarcoma virus (RAS) family members take the part of a key function in cell development. Any activating mutation at the hand of the <em>RAS</em> family, including <em>KRAS</em>, <em>NRAS,</em> and <em>HRAS</em> is an appropriate target for anticancer therapy [18]. Before the present time, there is a minority of studies on the subject of the prevalence of <em>NRAS</em> genetic modifications, ranging from 2.0 % to 10.0 % [<a href=\"#r-14\">14,</a><a href=\"#r-16\">16</a>,<a href=\"#r-19\">19</a>]. The frequency of <em>NRAS</em> mutations was 7.2% of the Vietnamese CRC patients. Similar to <em>KRAS</em> mutations, there was no meaningful relationship between <em>NRAS</em> mutations and clinical parameters were indicated in CRC tissue blocks. The extensive variability in frequency, as well as distribution of <em>KRAS</em> and also the <em>NRAS</em> mutation between studies, may perhaps be due to ethnicity, geographic factor, sample size, and mutation analysis techniques.<br />\r\n<em>BRAF </em>gene composes of 18 exons, which performs the function of a downstream signal transduction component of triggering of the mitogen-activated protein kinase (MAPK) signal transduction.<em> BRAF</em> V600E (exon 15) is the most common activating mutation, interprets as 90% of the aggregate activating <em>BRAF</em> pathogenic variations [<a href=\"#r-20\">20</a>]. All over the world, the described rate appertaining to <em>BRAF</em> alterations inward of dissimilar inhabitants fluctuates broadly, from 1.1% to 25% [<a href=\"http://#r-13\">13–16</a>]. Within the confines of this study, the V600E <em>BRAF</em> variation was discovered in 16 patients, employing a percentage of 6.4% (16/251), which is more lightly outstanding than different Asian publications (1.1% to 5.8%). For the <em>BRAF</em> gene, of extraordinary consideration is the fact that the incidence of V600E mutation gave variety to in terms of age, as far as an outstandingly higher proportion in older convalescents (5.2%) compared to that in younger patients (1.2%) (p=0.023), it was similar to the previous report, showed that <em>BRAF</em> V600E mutation escalated from 10% in the interior of unselectable cases to 37% enclosed by females elder than the 70s [<a href=\"#r-21\">21</a>].<br />\r\nPhosphatidylinositol-4,5-bisphosphate 3-kinase, catalytic subunit alpha (PIK3CA) belongs to the PI3K family that is frequently mutated in solid tumors. In the present research, the rate of <em>PIK3CA</em> genetic changes was found in 44 patients, reaching 17.5% (44/251), consistent with the prevalence from 2% to 18% of metastatic CRCs [13,14,15]. Our study showed a significant association between <em>PIK3CA</em> mutation and patients’ gender and differentiation (p<0.05). Ziv E et al. (2017) indicated that <em>PIK3CA</em> or <em>AKT</em> mutation carriers laid hold of poorer disease progression (55%) than wild-type groups (92%) after radiation, at 1-year post-embolization [<a href=\"#r-22\">22</a>]. This finding suggests that activating mutations belonging to the PI3K signal transduction, especially <em>PIK3CA</em> genetic abnormalities, may potentially affect radiotherapy for CRC patients.<br />\r\nOur present study confirmed that <em>KRAS </em>mutation excludes <em>NRAS</em> and <em>BRAF</em> missense variations in CRC (p< 0.05), suggesting genetic alterations are involved in different oncogenic pathways for colorectal cancer tumorigenesis. This result could potentially be explained by the incompatibility between the mutations, just 1 mutation within the interior of the MAPK signaling pathway is enough to put a stop to the cell cycle [<a href=\"#r-23\">23</a>]. Some genetic alterations may coexist, others are exclusive, such as the coexistence of <em>KRAS</em> mutations and <em>APC</em> inactivation leading to CRC progression [<a href=\"#r-24\">24</a>]. Meanwhile, <em>BRAF</em> and <em>APC</em> pathogenic modifications are rarely found together in CRC. In the earliest precursor of CRC and adenomas, a considerable correlation out of <em>BRAF</em> alteration along with the serrated histological characteristic was detected [<a href=\"#r-25\">25</a>]. In addition, we inaugurated a strong interrelationship between <em>PIK3CA</em> and <em>KRAS</em> mutations; <em>PIK3CA</em> to go with <em>RAS</em>/<em>RAF</em> mutations, similar to previous reports. For example, Li HT et al. (2011) indicated that <em>KRAS</em> and <em>PIK3CA</em> somatic co-variations are more popular surrounded by patients abreast of stage IV CRC than the early stages. This may be due to the complementary impact of mutations leading to activating the PI3K-AKT signaling pathway, resulting in metastasis [<a href=\"#r-26\">26</a>]. Once <em>KRAS</em>/<em>PIK3CA</em> mutations are coexistence in the early stage, the patient has a poor prognosis such as developing distant metastasis and worse outcome [<a href=\"#r-27\">27</a>]. Patients carrying mutations that activate the PI3K signaling pathway are commonly less susceptible to targeted therapy using anti-EGFR monoclonal antibodies. Thus, in addition to <em>RAS</em>/<em>RAF</em> mutations, the mutation status of components involving the PI3K signaling pathway is considered a biomarker for negative prognosis when it comes to anti-EGFR monoclonal antibodies therapy to approach progressive colorectal cancer.<br />\r\nIn conclusion, our present study demonstrated the specific associations of alterations with <em>KRAS</em>, <em>NRAS</em>, <em>BRAF</em>, <em>PIK3CA</em> gene, and CRC patients’ clinicopathologic parameters, suggesting to help individualized patient-oriented treatment for cancer patients. Our results assist in better characterizing the Vietnamese CRC population to better announce to clinicians and researchers. Future molecular detailed studies should be carried out evaluating different outcomes by oncogenic abnormalities in CRC tumors.</p>"
},
{
"section_number": 5,
"section_title": "ACKNOWLEDGEMENTS",
"body": "<p>None.</p>"
},
{
"section_number": 6,
"section_title": "AUTHOR CONTRIBUTIONS",
"body": "<p>L.D.V. and Q.N.N.: Conception and Design of the experiments. H.H.C.: Methodology and Data analysis, L.D.V.: Data curation and Writing – original draft, Q.N.N: Writing – review and editing, Supervision. All authors reviewed the manuscript.</p>"
},
{
"section_number": 7,
"section_title": "CONFLICTS OF INTEREST",
"body": "<p>There is no conflict of interest among the authors.</p>"
}
],
"figures": [
{
"figure": "https://jabet.bsmiab.org/media/article_images/2023/29/06/178-1643767322-Figure1.jpg",
"caption": "Figure 1. Representative images of H&E staining for histological subtypes. (A) Adenocarcinoma. (B) Mucinous adenocarcinoma. (C) Squamous cell carcinoma. (D) Signet ring cell carcinoma. Photographs were taken at ×200 magnification. Scale bar, 100 μm.",
"featured": false
}
],
"authors": [
{
"id": 328,
"affiliation": [
{
"affiliation": "Pathology and Molecular Biology Center, National Cancer Hospital K, 30 Cau Buou Street, Thanh Tri, Hanoi, Vietnam"
}
],
"first_name": "Linh Dieu",
"family_name": "Vuong",
"email": null,
"author_order": 1,
"ORCID": null,
"corresponding": false,
"co_first_author": false,
"co_author": false,
"corresponding_author_info": "",
"article": 87
},
{
"id": 329,
"affiliation": [
{
"affiliation": "National Key Laboratory of Gene Technology, Institute of Biotechnology, Vietnam Academy of Science and Technology, 18 Hoang Quoc Viet\r\nStreet, Cau Giay, Hanoi, Vietnam"
}
],
"first_name": "Ha Hoang",
"family_name": "Chu",
"email": null,
"author_order": 2,
"ORCID": null,
"corresponding": false,
"co_first_author": false,
"co_author": false,
"corresponding_author_info": "",
"article": 87
},
{
"id": 330,
"affiliation": [
{
"affiliation": "Pathology and Molecular Biology Center, National Cancer Hospital K, 30 Cau Buou Street, Thanh Tri, Hanoi, Vietnam"
}
],
"first_name": "Quang Ngoc",
"family_name": "Nguyen",
"email": "quangk8s@gmail.com",
"author_order": 3,
"ORCID": null,
"corresponding": true,
"co_first_author": false,
"co_author": false,
"corresponding_author_info": "Quang Ngoc Nguyen, PhD; Pathology and Molecular Biology Center, National Cancer Hospital K, 30 Cau Buou Street, Thanh Tri, Hanoi, Vietnam. e-mail: quangk8s@gmail.com",
"article": 87
}
],
"views": 565,
"downloads": 116,
"references": [
{
"id": 2571,
"serial_number": 1,
"pmc": null,
"reference": "Rosato V, Bosetti C, Levi F, Polesel J, Zucchetto A, Negri E, et al. Risk factors for young-onset colorectal cancer. Cancer Causes Control 2013; 24:335–41. https://doi.org/10.1007/s10552-012-0119-3.",
"DOI": null,
"article": 87
},
{
"id": 2572,
"serial_number": 2,
"pmc": null,
"reference": "Deng Y. Rectal Cancer in Asian vs. Western Countries: Why the Variation in Incidence? Current treatment options in oncology 2017; 18: e64. https://doi.org/10.1007/s11864-017-0500-2.",
"DOI": null,
"article": 87
},
{
"id": 2573,
"serial_number": 3,
"pmc": null,
"reference": "Matsubara N. Epigenetic regulation and colorectal cancer. Dis Colon Rectum 2012; 55:96–104. https://doi.org/10.1097/DCR.0b013e318233a1ef.",
"DOI": null,
"article": 87
},
{
"id": 2574,
"serial_number": 4,
"pmc": null,
"reference": "Shaw RJ, Cantley LC. Ras, PI3K, and mTOR signaling control tumour cell growth. Nature 2006; 441:424–30. https://doi.org/10.1038/nature04869.",
"DOI": null,
"article": 87
},
{
"id": 2575,
"serial_number": 5,
"pmc": null,
"reference": "Ogino S, Lochhead P, Giovannucci E, Meyerhardt JA, Fuchs CS, Chan AT. Discovery of colorectal cancer PIK3CA mutation as potential predictive biomarker: power and promise of molecular pathological epidemiology. Oncogene 2014; 33:2949–55. https://doi.org/10.1038/onc.2013.244.",
"DOI": null,
"article": 87
},
{
"id": 2576,
"serial_number": 6,
"pmc": null,
"reference": "Rosty C, Young JP, Walsh MD, Clendenning M, Sanderson K, Walters RJ, et al. PIK3CA activating mutation in colorectal carcinoma: associations with molecular features and survival. PLoS One 2013; 8: e65479. https://doi.org/10.1371/journal.pone.0065479.",
"DOI": null,
"article": 87
},
{
"id": 2577,
"serial_number": 7,
"pmc": null,
"reference": "Zhao B, Wang L, Qiu H, Zhang M, Sun L, Peng P, et al. Mechanisms of resistance to anti-EGFR therapy in colorectal cancer. Oncotarget 2017; 8:3980–4000. https://doi.org/10.18632/oncotarget.14012.",
"DOI": null,
"article": 87
},
{
"id": 2578,
"serial_number": 8,
"pmc": null,
"reference": "Stintzing S, Lenz H-J. A small cog in a big wheel: PIK3CA mutations in colorectal cancer. J Natl Cancer Inst 2013; 105:1775–6. https://doi.org/10.1093/jnci/djt330.",
"DOI": null,
"article": 87
},
{
"id": 2579,
"serial_number": 9,
"pmc": null,
"reference": "Ganesan P, Janku F, Naing A, Hong DS, Tsimberidou AM, Falchook GS, et al. Target-based therapeutic matching in early-phase clinical trials in patients with advanced colorectal cancer and PIK3CA mutations. Mol Cancer Ther 2013; 12:2857–63. https://doi.org/10.1158/1535-7163.MCT-13-0319-T.",
"DOI": null,
"article": 87
},
{
"id": 2580,
"serial_number": 10,
"pmc": null,
"reference": "Harari PM, Allen GW, Bonner JA. Biology of interactions: antiepidermal growth factor receptor agents. J Clin Oncol 2007; 25:4057–65. https://doi.org/10.1200/JCO.2007.11.8984.",
"DOI": null,
"article": 87
},
{
"id": 2581,
"serial_number": 11,
"pmc": null,
"reference": "Linardou H, Dahabreh IJ, Kanaloupiti D, Siannis F, Bafaloukos D, Kosmidis P, et al. Assessment of somatic k-RAS mutations as a mechanism associated with resistance to EGFR-targeted agents: a systematic review and meta-analysis of studies in advanced non-small-cell lung cancer and metastatic colorectal cancer. Lancet Oncol 2008; 9:962–72. https://doi.org/10.1016/S1470-2045(08)70206-7.",
"DOI": null,
"article": 87
},
{
"id": 2582,
"serial_number": 12,
"pmc": null,
"reference": "De Roock W, Claes B, Bernasconi D, De Schutter J, Biesmans B, Fountzilas G, et al. Effects of KRAS, BRAF, NRAS, and PIK3CA mutations on the efficacy of cetuximab plus chemotherapy in chemotherapy-refractory metastatic colorectal cancer: a retrospective consortium analysis. Lancet Oncol 2010; 11:753–62. https://doi.org/10.1016/S1470-2045(10)70130-3.",
"DOI": null,
"article": 87
},
{
"id": 2583,
"serial_number": 13,
"pmc": null,
"reference": "Mao C, Zhou J, Yang Z, Huang Y, Wu X, Shen H, et al. KRAS, BRAF and PIK3CA mutations and the loss of PTEN expression in Chinese patients with colorectal cancer. PLoS One 2012; 7: e36653. https://doi.org/10.1371/journal.pone.0036653.",
"DOI": null,
"article": 87
},
{
"id": 2584,
"serial_number": 14,
"pmc": null,
"reference": "Bando H, Yoshino T, Shinozaki E, Nishina T, Yamazaki K, Yamaguchi K, et al. Simultaneous identification of 36 mutations in KRAS codons 61 and 146, BRAF, NRAS, and PIK3CA in a single reaction by multiplex assay kit. BMC Cancer 2013; 13:405. https://doi.org/10.1186/1471-2407-13-405.",
"DOI": null,
"article": 87
},
{
"id": 2585,
"serial_number": 15,
"pmc": null,
"reference": "Bisht S, Ahmad F, Sawaimoon S, Bhatia S, Das BR. Molecular spectrum of KRAS, BRAF, and PIK3CA gene mutation: determination of frequency, distribution pattern in Indian colorectal carcinoma. Med Oncol 2014; 31:124. https://doi.org/10.1007/s12032-014-0124-3.",
"DOI": null,
"article": 87
},
{
"id": 2586,
"serial_number": 16,
"pmc": null,
"reference": "Therkildsen C, Bergmann TK, Henrichsen-Schnack T, Ladelund S, Nilbert M. The predictive value of KRAS, NRAS, BRAF, PIK3CA and PTEN for anti-EGFR treatment in metastatic colorectal cancer: A systematic review and meta-analysis. Acta Oncol 2014; 53:852–64.",
"DOI": null,
"article": 87
},
{
"id": 2587,
"serial_number": 17,
"pmc": null,
"reference": "Gao J, Aksoy BA, Dogrusoz U, Dresdner G, Gross B, Sumer SO, et al. Integrative analysis of complex cancer genomics and clinical profiles using the cBioPortal. Sci Signal 2013;6:pl1. https://doi.org/10.1126/scisignal.2004088.",
"DOI": null,
"article": 87
},
{
"id": 2588,
"serial_number": 18,
"pmc": null,
"reference": "Downward J. Targeting RAS signalling pathways in cancer therapy. Nat Rev Cancer 2003; 3:11–22. https://doi.org/10.1038/nrc969.",
"DOI": null,
"article": 87
},
{
"id": 2589,
"serial_number": 19,
"pmc": null,
"reference": "Negru S, Papadopoulou E, Apessos A, Stanculeanu DL, Ciuleanu E, Volovat C, et al. KRAS, NRAS and BRAF mutations in Greek and Romanian patients with colorectal cancer: a cohort study. BMJ Open 2014; 4: e004652. https://doi.org/10.1136/bmjopen-2013-004652.",
"DOI": null,
"article": 87
},
{
"id": 2590,
"serial_number": 20,
"pmc": null,
"reference": "Wan PTC, Garnett MJ, Roe SM, Lee S, Niculescu-Duvaz D, Good VM, et al. Mechanism of activation of the RAF-ERK signaling pathway by oncogenic mutations of B-RAF. Cell 2004; 116:855–67. https://doi.org/10.1016/s0092-8674(04)00215-6.",
"DOI": null,
"article": 87
},
{
"id": 2591,
"serial_number": 21,
"pmc": null,
"reference": "Tie J, Desai J. Targeting BRAF mutant metastatic colorectal cancer: clinical implications and emerging therapeutic strategies. Target Oncol 2015; 10:179–88. https://doi.org/10.1007/s11523-014-0330-0.",
"DOI": null,
"article": 87
},
{
"id": 2592,
"serial_number": 22,
"pmc": null,
"reference": "Ziv E, Bergen M, Yarmohammadi H, Boas FE, Petre EN, Sofocleous CT, et al. PI3K pathway mutations are associated with longer time to local progression after radioembolization of colorectal liver metastases. Oncotarget 2017; 8:23529–38. https://doi.org/10.18632/oncotarget.15278.",
"DOI": null,
"article": 87
},
{
"id": 2593,
"serial_number": 23,
"pmc": null,
"reference": "Sewing A, Wiseman B, Lloyd AC, Land H. High-intensity Raf signal causes cell cycle arrest mediated by p21Cip1. Mol Cell Biol 1997; 17:5588–97. https://doi.org/10.1128/MCB.17.9.5588.",
"DOI": null,
"article": 87
},
{
"id": 2594,
"serial_number": 24,
"pmc": null,
"reference": "Janssen K-P, Alberici P, Fsihi H, Gaspar C, Breukel C, Franken P, et al. APC and oncogenic KRAS are synergistic in enhancing Wnt signaling in intestinal tumor formation and progression. Gastroenterology 2006; 131:1096–109. https://doi.org/10.1053/j.gastro.2006.08.011.",
"DOI": null,
"article": 87
},
{
"id": 2595,
"serial_number": 25,
"pmc": null,
"reference": "Rosenberg DW, Yang S, Pleau DC, Greenspan EJ, Stevens RG, Rajan TV, et al. Mutations in BRAF and KRAS Differentially Distinguish Serrated versus Non-Serrated Hyperplastic Aberrant Crypt Foci in Humans. Cancer Res 2007; 67:3551-4. https://doi.org/10.1158/0008-5472.CAN-07-0343.",
"DOI": null,
"article": 87
},
{
"id": 2596,
"serial_number": 26,
"pmc": null,
"reference": "Li H-T, Lu Y-Y, An Y-X, Wang X, Zhao Q-C. KRAS, BRAF and PIK3CA mutations in human colorectal cancer: relationship with metastatic colorectal cancer. Oncol Rep 2011; 25:1691–7. https://doi.org/10.3892/or.2011.1217.",
"DOI": null,
"article": 87
},
{
"id": 2597,
"serial_number": 27,
"pmc": null,
"reference": "Velho S, Moutinho C, Cirnes L, Albuquerque C, Hamelin R, Schmitt F, et al. BRAF, KRAS and PIK3CA mutations in colorectal serrated polyps and cancer: primary or secondary genetic events in colorectal carcinogenesis? BMC Cancer 2008; 8:255. https://doi.org/10.1186/1471-2407-8-255.",
"DOI": null,
"article": 87
}
]
},
{
"id": 85,
"slug": "178-1648570864-effects-of-dexamethasone-induced-stress-on-the-intestinal-morphology-and-morphometry-in-broiler-chicken",
"featured": false,
"slider": false,
"issue": "Vol5 Issue2",
"type": "original_article",
"manuscript_id": "178-1648570864",
"recieved": "2022-03-30",
"revised": null,
"accepted": "2022-04-20",
"published": "2022-04-24",
"pdf_file": "https://jabet.bsmiab.org/media/pdf_file/2023/29/178-1648570864.pdf",
"title": "Effects of dexamethasone induced stress on the intestinal morphology and morphometry in broiler chicken",
"abstract": "<p>The intestine of poultry plays a significant role in the health and production through enzymatic and microbial digestion of feed as well as absorption of nutrients. The current study was designed to explore the gross and histological alterations in the broiler duodenum and cecum triggered by dietary dexamethasone (DEX). The study was conducted on four homogenous groups of one-day-old chicks (20 chicks/group) i.e. one control (Non-DEX) and three treatment groups (DEX-1, DEX-2, and DEX-3). The broilers were fed commercial broiler feed containing DEX at the rate of 0, 3, 5, and 7mg/kg feed in the Non-DEX, DEX-1, DEX-2, and DEX-3 groups, respectively. The gross morphologic and morphometric data were recorded immediately after the collection of samples on days 7, 14, 21, and 28. Then, the tissue samples were processed for histological investigation. In the gross morphometric study, the weight, length, and width of the intestine were found significantly less in the DEX groups. Histopathological study results showed degeneration of intestinal glands (duodenum), mucosa, and lymphatic nodules with loss of lymphatic nodules (cecum). The percentage of the degenerated nodule was also increased. The length, width, and surface area of the duodenal villi, thickness of the mucosal layer of the cecum, and diameter of the cecal lymphatic nodules were substantially decreased in all the DEX groups. The magnitude of the alterations was associated with both the dose and duration of DEX treatment. However, the current study results indicate that DEX treatment significantly alters the morphologic and morphometric characteristics of the broiler intestine.</p>",
"journal_reference": "J Adv Biotechnol Exp Ther. 2022; 5(2): 394-407.",
"academic_editor": "Md Jamal Uddin, PhD; ABEx Bio-Research Center, Dhaka, Bangladesh",
"cite_info": "Islam R, Sultana N, et al. Effects of dexamethasone induced stress on the intestinal morphology and morphometry in broiler chicken. J Adv Biotechnol Exp Ther. 2022; 5(2): 394-407.",
"keywords": [
"Morphology",
"Dexamethasone",
"Cecum",
"Broiler",
"Duodenum",
"Morphometry"
],
"DOI": "10.5455/jabet.2022.d123",
"sections": [
{
"section_number": 1,
"section_title": "INTRODUCTION",
"body": "<p>Poultry meat is a popular source of protein in the human diet which has made the poultry sector economically valuable over the last few decades. It was predicted that global food consumption will be doubled by 2050, and per capita meat consumption would rise with the increasing purchasing capacity of the consumers in developing countries [<a href=\"#r-1\">1</a>]. In comparison to the traditional husbandry techniques, modern poultry strains are genetically modified for rapid growth in a shorter period [<a href=\"#r-2\">2</a>]. In this regard, nutrient digestibility and absorbability of the gut play a crucial role in actualizing its genetic potentiality [<a href=\"#r-3\">3, 4</a>].<br />\r\nIn the field of veterinary research, broiler ‘gut health’ is a widely discussed topic due to its role in health and growth performance [<a href=\"#r-4\">4, 5</a>]. Duodenum and cecum are the major gastrointestinal parts for the digestion and absorption of nutrients from the diet. The duodenum receives the digestive enzymes and bicarbonates produced by the pancreas as well as the bile produced by the liver, which plays a major role in the digestion of protein and fat. The cecum plays a significant role in its growth as it harbors a diversified bacterial community and can ferment a wide variety of feed ingredients like starch, cellulose, hemicellulose, polysaccharides, fructooligosaccharides, and lignin to different final products [<a href=\"#r-6\">6</a>]. The undigested compounds which are not absorbed in the small intestine, finally end up in the cecum, where they are digested by an anaerobic fermentation process [<a href=\"#r-7\">7</a>]. As the proximal region of the cecum is continuously exposed to extra cecal bacterial or other antigenic invasions, the lymphatic nodules of the cecum play a critical function against these foreign invaders [<a href=\"#r-8\">8</a>]. Thus, the cecum impedes the colonization of pathogenic microorganisms and detoxifies harmful elements to maintain its optimum digestive and absorptive functions [<a href=\"#r-3\">3</a>]. So, the importance of the duodenum and cecum in broiler growth and development is indisputable. In this context, understanding the role of the gastrointestinal tract is crucial, as it has an enormous impact on the growth performance and health of broiler. However, stress, both biological and nutritional, is one of the major concerns in broiler production [<a href=\"#r-9\">9, 10, 11</a>].<br />\r\nExposure to different stressors leads to the secretion of corticosteroids (CORTs) by the hypothalamic-pituitary-adrenocortical (HPA) axis, hence it is known as stress hormone [<a href=\"#r-12\">12, 13</a>]. Synthetic CORT dexamethasone (DEX) administration mimics the negative impacts of increased CORT [<a href=\"#r-12\">12</a>]. Besides inducing stress, corticosteroids can also influence digestive function by markedly decreasing the digestibility of protein and carbohydrates [<a href=\"#r-10\">10</a>]. A great deal of research was performed earlier focusing on the immunosuppressive effect of CORT [<a href=\"#r-7\">7, 9</a>, <a href=\"#r-14\">14, 15, 16</a>]. According to the previous study report, supplementation of steroid growth promoters like DEX with diet does not improve the growth rate of broiler [<a href=\"#r-12\">12</a>, <a href=\"#r-17\">17</a>]. DEX reportedly damages the kidney by vacuolation of kidney tissue, shrinking the tubules, and decreasing the number of nephrons [<a href=\"#r-18\">18, 19</a>]. A high dose of DEX alters the morphology of breast and thigh meat, and also results in the developmental arrest of immune organs in the broiler [<a href=\"#r-15\">15, 17</a>]. DEX also reportedly alters the liver morphology [<a href=\"#r-20\">20</a>]. The effects of prednisolone related to gastrointestinal motility, intestinal histology, and mucosal mast cells were studied in rats [<a href=\"#r-21\">21</a>].<br />\r\nThe enteric system is a major body system that is responsible for the digestion and absorption of dietary nutrients. So, any alteration in its morphology affects the functions of other organs or body systems. Nonetheless, the adverse effects of stress induced by different doses of dietary DEX on morphology and morphometry of the enteric systems of broiler are not yet well-documented. Therefore, the administration of analogs of CORT like DEX can be an effective tool in investigating the adaptation in intestinal morphology in broiler in response to DEX induced stress.</p>"
},
{
"section_number": 2,
"section_title": "MATERIALS AND METHODS",
"body": "<p><strong>Experimental animals</strong><br />\r\nThis experiment was ethically approved by the “Animal Welfare and Experimentation Ethics Committee” of Bangladesh Agricultural University, Bangladesh [Approval No.- AWEEC/BAU/2021(3)]. A total of 80 one-day-old healthy broiler chicks of Cobb-500 strain were used in this study.</p>\r\n\r\n<p> </p>\r\n\r\n<p><strong>Housing and feeding management</strong><br />\r\nThe broiler chicks were then randomly assigned to four groups i.e. one control (Non-DEX) and three experimental or treated groups as DEX-1, DEX-2, and DEX-3. The broilers were fed commercial broiler feed (Nourish Poultry and Hatchery Limited, Bangladesh) containing CORT (DEX, BP 0.5 mg, Opsonin Limited) at the rate of 3mg/kg, 5mg/kg, 7mg/kg in group DEX-1, DEX-2 and DEX-3 respectively. The broilers were fed starter feed for the first 14 days, and then shifted to grower feed for the rest of the experiment. A constant supply of an adequate amount of feed and fresh drinking water was ensured. Standard rearing conditions were maintained throughout the experiment [<a href=\"#r-19\">19</a>].</p>\r\n\r\n<p> </p>\r\n\r\n<p><strong>Gross morphology and morphometry</strong><br />\r\nFive broilers from each group were sacrificed manually on each sampling day (7, 14, 21, and 28 days of the experiment) by the cervical subluxation method. Duodenum and right cecum were collected from each broiler immediately after dissection. Color, weight, length, and width of the cecum were considered for the gross morphologic and morphometric study. The color of the duodenum and cecum was compared between the Non-DEX and DEX groups by visual inspection. Weight (gm) was measured using a high precision balance (FGH Series, AND Company Limited, Korea). The length and width were measured by a graded scale (cm). The width of the cecum was measured from the mid-region of the blind sac.</p>\r\n\r\n<p> </p>\r\n\r\n<p><strong>Histopathology</strong><br />\r\nAbout one cm of the duodenal and cecal segments (from blind sac) were collected from each broiler and fixed in 10% buffered formalin and then routinely processed into slides with Hematoxylin and Eosin (H&E) stain according to the protocol described in the earlier study [<a href=\"#r-15\">15</a>]. For this, the formalin-fixed tissues were dehydrated in the ascending grades (70%, 80%, 90%, 100% – I, II, and III) of alcohol followed by clearing in three changes in xylene. Then, the tissues were infiltrated with three different grades of melted paraffin (49 °C, 55 °C, and 58 °C) for 30 minutes each. The tissues were then embedded in paraffin (58 °C). Finally, 5 µm thin sections were cut using a sliding microtome (MIC 509, Euromex, Japan). The cut sections were floated in a warm (37°C) water bath for stretching followed by mounting on the adhesive (50% egg albumin and 50% glycerol) painted glass slides. Then the tissue sections were dried on a slide warmer (37°C).<br />\r\nAll the stained tissue sections were examined and analyzed blindly to avoid any biases. The histomorphological attributes of the duodenal and cecal tissues were studied under a light microscope (Leica DMR; Leica Microsystems, Wetzlar, Germany) at 100X and 400X magnifications. Length (measurements were taken from the tips of the villi to the villi-crypt junctions) and width (measured from the mid-region of the villi) of duodenal villi, mucosal thickness, and diameter of lymphatic nodules of cecum were measured in micrometer (µm) using a calibrated stage micrometer. The surface area of the villi was calculated using the following formula- ; where π = 3:1416 [<a href=\"#r-22\">22</a>]. The number of intact and degenerated lymphatic nodules in the cecum was counted and the percentage was calculated. Measurement of all the variables was done from 10 randomly selected focuses at 100X magnification.<br />\r\nNecessary photographs were captured from ten randomly selected focuses at 100X and 400X magnifications for better illustration of the obtained results. All the images were captured by photomicroscope (Model: CX41U-LH50HG, Olympus Corporation, Tokyo, Japan).</p>\r\n\r\n<p> </p>\r\n\r\n<p><strong>Statistical analyses</strong><br />\r\nAll the data obtained in this study were analyzed using IBM SPSS Statistics 22. Differences among the groups of birds were compared using one-way ANOVA with posthoc Duncan’s multiple range test where P < 0.05 was considered significant. In all trials, data were expressed as mean ± standard error of the mean (SEM).</p>"
},
{
"section_number": 3,
"section_title": "RESULTS",
"body": "<p><strong>Gross morphologic and morphometric profile of duodenum</strong><br />\r\nThe gross attributes and alterations of the duodenum are shown in <a href=\"#figure1\">Figure 1</a>. The duodenum of the Non-DEX group appeared light greyish color whereas the DEX treated groups revealed slightly darker color with a reddish tinge.<br />\r\nThe gross morphometric parameters of the duodenum are shown in <a href=\"#figure2\">Figure 2</a>. The weight of the duodenum was significantly (P < 0.05) less in the DEX treated groups compared to the Non-DEX group. Among the DEX treated groups, the highest weight was found in the DEX-1 group and the lowest weight was found in the DEX-3 group on all days of the experiment. Similarly, the length and width were also significantly (P < 0.05) less in the DEX treated groups. On day 7, the length was found significantly (P < 0.05) less in the DEX-2 and DEX-3 groups compared to the Non-DEX group. The highest length was found in the DEX-1 group and the lowest length was seen in the DEX-3 group. On day 28, there was no significant (P > 0.05) difference in length between the DEX groups. There was a substantial (P < 0.05) difference in width on day 7 among the DEX treated groups. However, a significant (P < 0.05) difference in width was found from days 14 to 28 among the DEX treated groups.</p>\r\n\r\n<div id=\"figure1\">\r\n<figure class=\"image\"><img alt=\"\" height=\"189\" src=\"/media/article_images/2023/50/06/178-1648570864-Figure1.jpg\" width=\"500\" />\r\n<figcaption><strong>Figure 1. </strong>Representative images of gross view of broiler duodenum after collection of the sample on day 28.</figcaption>\r\n</figure>\r\n</div>\r\n\r\n<div id=\"figure2\">\r\n<figure class=\"image\"><img alt=\"\" height=\"769\" src=\"/media/article_images/2023/50/06/178-1648570864-Figure2.jpg\" width=\"500\" />\r\n<figcaption><strong>Figure 2. </strong>Effects of dietary DEX on the weight (gm), length (cm), and width (cm) of the duodenum in DEX treated broiler. Data were expressed as mean SEM. Columns on different days with different alphabetic superscripts are significantly (p < 0.05) different from each other.Caption</figcaption>\r\n</figure>\r\n</div>\r\n\r\n<p> </p>\r\n\r\n<p><strong>Histopathological profile of duodenum</strong><br />\r\nThe histo-architecture of the duodenum of Non-DEX and DEX treated groups is shown in <a href=\"#figure3\">Figure 3</a>. The Non-DEX group revealed general histological architecture. However, the DEX treated groups showed marked microscopic alterations, especially in the duodenal glands (crypt of Lieberkuhn) and villi. In the DEX-1 group, the intestinal glands showed no alterations though they started to degenerate in the DEX-2 group. In the DEX-3 group, almost all the intestinal glands were degenerated, resulting in the reduction of the intestinal gland population.<br />\r\nThe histomorphometric data of the duodenum are shown in <a href=\"#Table-1\">Table 1</a>. The histomorphometric study revealed that both the length and width of duodenal villi were significantly (P < 0.05) less in the DEX groups as compared to the Non-DEX group. However, among the DEX treated groups, the highest length and width of duodenal villi was found in the DEX-1 group and the lowest value was found in the DEX-3 group. The surface area of the villi was also substantially (P < 0.05) decreased in the DEX treated groups which were also dose dependent.</p>\r\n\r\n<div id=\"figure3\">\r\n<figure class=\"image\"><img alt=\"\" height=\"335\" src=\"/media/article_images/2023/50/06/178-1648570864-Figure3.jpg\" width=\"500\" />\r\n<figcaption><strong>Figure 3. </strong>Representative photomicrographs of transverse section (H & E stained) of the duodenum from 28-day old broilers. VL- Villi length, VW- Villi width, C- Crypts, dC- Degeneration of crypts.</figcaption>\r\n</figure>\r\n</div>\r\n\r\n<div id=\"Table-1\">\r\n<p><a href=\"https://jabet.bsmiab.org/table/178-1648570864-table1/\">Table-1</a><strong>Table 1.</strong> Histomorphometric data on duodenal villi length, width, and surface area, in Non-DEX and DEX groups.</p>\r\n\r\n<p> </p>\r\n</div>\r\n\r\n<p><strong>Gross morphologic and morphometric profile of cecum</strong><br />\r\nThe gross attributes and alterations of the cecum are shown in <a href=\"#figure4\">Figure 4</a>. The cecum was a paired organ with a lower diameter at the origin but gradually increased in size until it formed a blind end terminally. The gross morphometry distinguished three distinct regions in the cecum. The cecum of the Non-DEX group was greenish-grey in color whereas the cecum of the DEX treated groups was greyish color with a slight reddish tinge.<br />\r\nThe weight of the left cecum in an individual group of broilers on different days of the experiment is shown in <a href=\"#figure5\">Figure 5</a>. The weight was significantly (P < 0.05) less in the DEX treated groups as compared to the Non-DEX group. Significant (P < 0.05) differences among the DEX treated groups were seen only on day 28 where the DEX-2 group was significantly (P < 0.05) different from the DEX-1 and DEX-3 groups. The length and width of the left cecum in the individual group of broilers on different days of the experiment are shown in Figure 5. Both the length and width were significantly (P < 0.05) less in the DEX treated groups as compared to the Non-DEX group. There were also significant (P< 0.05) differences among the DEX treated groups.</p>\r\n\r\n<div id=\"figure4\">\r\n<figure class=\"image\"><img alt=\"\" height=\"185\" src=\"/media/article_images/2023/50/06/178-1648570864-Figure4.jpg\" width=\"500\" />\r\n<figcaption><strong>Figure 4. </strong>Representative images of gross view of broiler right cecum after collection of the sample on day 28.</figcaption>\r\n</figure>\r\n</div>\r\n\r\n<div id=\"figure5\">\r\n<figure class=\"image\"><img alt=\"\" height=\"735\" src=\"/media/article_images/2023/50/06/178-1648570864-Figure5.jpg\" width=\"500\" />\r\n<figcaption><strong>Figure 5. </strong>Effects of dietary DEX on the weight (gm), length (cm), and width (cm) of the right cecum in DEX treated broiler. Data were expressed as mean SEM. Columns on different days with different alphabetic superscripts are significantly (p < 0.05) different from each other.</figcaption>\r\n</figure>\r\n\r\n<p> </p>\r\n</div>\r\n\r\n<p><strong>Histopathological profile of cecum</strong><br />\r\nThe histo-architecture of the cecum of Non-DEX and DEX treated groups is shown in <a href=\"#figure6\">Figure 6</a>. The Non-DEX group revealed general histological architecture. On the other hand, marked disruption of mucosal epithelial cells was seen in all the DEX treated groups. Mucosal degeneration was also noticed which was more extensive in the high dose groups. Degeneration of mucosa started from the tip of the mucosal layer to the base. The lymphatic nodules showed degenerative changes in the treatment groups from day 7 which increased afterward. Degenerative changes were increased significantly in the high-dose groups. On day 28, the histological architecture was almost completely lost in the DEX-3 group. The thickness of the muscular layer also decreased in the DEX treated broilers. Some extent of degeneration in the muscular layer was also seen.<br />\r\nThe histomorphometric data of mucosal height, the greater and lesser diameter of lymphatic nodules are shown in <a href=\"#Table-2\">Table 2</a>. Mucosal height was significantly (P < 0.05) less in the DEX treated groups as compared to the Non-DEX group. Both the greater and lesser diameter of the lymphatic nodules was also significantly (P < 0.05) less in the DEX treated broilers. There were also significant (P < 0.05) differences among the DEX treated groups as the values were decreased gradually with the increased dose of DEX.<br />\r\nThe percentage of degenerated lymphatic nodules is shown in <a href=\"#figure7\">Figure 7</a>. The percentage was increased with the progression of both age and DEX dose. The maximum percentage (92.31%) of degenerated lymphatic nodules was seen on day 28 in the DEX-3 group.</p>\r\n\r\n<div id=\"figure6\">\r\n<figure class=\"image\"><img alt=\"\" height=\"370\" src=\"/media/article_images/2023/50/06/178-1648570864-Figure6.jpg\" width=\"500\" />\r\n<figcaption><strong>Figure 6. </strong>Representative photomicrographs of transverse section (H & E stained) of cecum from 28-day old broiler at 400X magnification. ME- Muscularis Externa, LN- Lymphatic Nodule, Green arrow- Degeneration of mucosa, blue arrow- degeneration of lymphatic nodule.</figcaption>\r\n</figure>\r\n</div>\r\n\r\n<div id=\"figure7\">\r\n<figure class=\"image\"><img alt=\"\" height=\"329\" src=\"/media/article_images/2023/50/06/178-1648570864-Figure7.jpg\" width=\"500\" />\r\n<figcaption><strong>Figure 7. </strong>Percentage of degenerated lymphatic nodules in cecum in the DEX treated groups on different days of the experiment.</figcaption>\r\n</figure>\r\n</div>\r\n\r\n<div id=\"Table-2\">\r\n<p><a href=\"https://jabet.bsmiab.org/table/178-1648570864-table2/\">Table-2</a><strong>Table 2. </strong>Histomorphometric data on mucosal height and diameter of lymphatic nodule in control and DEX groups.</p>\r\n</div>"
},
{
"section_number": 4,
"section_title": "DISCUSSION",
"body": "<p>Any sort of stress activates different biological mechanisms in the body in order to maintain homeostasis and physiological activities. As the broilers are reared for massive meat production purposes, they are constantly exposed to different stresses, i.e. climate change, heat, high stock density, nutritional constraints, etc. during their very short lifetime [<a href=\"#r-9\">9, 10</a>, <a href=\"#r-23\">23</a>]. Exposure to these stressors activates the physiological stress response through activation of the HPA axis which leads to a rise in the level of the corticosteroid, a stress hormone [<a href=\"#r-12\">12, 13, 14</a>]. DEX administration induces oxidative stress in poultry and thus can mimic the adverse effects of increased levels of natural corticosteroids [<a href=\"#r-12\">12</a>, <a href=\"#r-24\">24</a>]. DEX had been used to induce stress in broilers in the previous studies which demonstrated that it could exert effects homologous to the natural corticosteroids secreted while exposed to different stresses [<a href=\"#r-12\">12, 13, 14</a>, <a href=\"#r-24\">24, 25</a>]. The morphology and morphometric attributes of the intestine possess a significant role in maintaining gut health, nutrient digestibility, and ultimately in the growth performance of the broiler. Height and width of villi, the thickness of the mucosa, crypt depth, etc. are commonly measured to assess gut digestibility and nutrient absorption [<a href=\"#r-4\">4</a>,<a href=\"#r-27\"> 27</a>]. In the current study, we induced stress in broiler chickens with dietary DEX at three different doses to investigate the adaptations in the intestinal morphology and morphometry in the DEX exposed broilers.<br />\r\nIn the current study, we found that the color of the DEX-1 and DEX-3 groups are quite different from the Non-DEX group where the color of the DEX-1 group was found quite darker. The findings of gross morphometric measurements of the Non-DEX group on different days of the experiment are also almost similar to the earlier report [<a href=\"#r-2\">2</a>]. However, in the DEX groups, all the gross morphometric parameters were decreased significantly in the DEX treated groups compared to the Non-DEX group. Intestinal sizes are closely related to body sizes [<a href=\"#r-28\">28</a>]. Dietary DEX reduces the growth performance and weight gain in the broiler [<a href=\"#r-12\">12</a>]. The previous study reports also suggest that corticosteroids like DEX negatively affect organ weight gain and reduce organ size [<a href=\"#r-15\">15</a>, <a href=\"#r-20\">20</a>, <a href=\"#r-29\">29</a>]. However, the effects of DEX on intestinal volume and weight gain had not been documented previously. Feed efficiency and the growth of broilers greatly depend on the enzymatic activities in the duodenum and the diversified microbial community that inhabits the caeca. Dietary lipid particles are mostly digested and emulsified in the duodenum by pancreatic enzymes and hepatic bile acids [<a href=\"#r-30\">30</a>]. Nutrients, such as undigested starch, protein, and fiber enter the caeca bypassing the small intestine [<a href=\"#r-6\">6</a>]. The blind end of the cecum helps to retain the digesta for longer periods and thus enhances nutrient absorption [<a href=\"#r-30\">30, 31, 32</a>]. So, the reduced intestinal size may adversely affect the overall growth rate of the broiler.<br />\r\nIn the histomorphological study<strong>, </strong>the duodenum and cecum of the Non-DEX groups on different days of the experiment revealed general histological characteristics as described in the previous studies [<a href=\"#r-2\">2</a>, <a href=\"#r-8\">8</a>]. On the other hand, significant alterations were seen in the DEX treated groups. The length of the villi was found significantly less in the DEX treated groups which matches the findings of the previous study report [<a href=\"#r-7\">7</a>]. The length of the villi is one of the prominent indices of the intestine’s capacity to absorb dietary nutrition [<a href=\"#r-26\">26</a>]. The reduction of the surface area of the villi might also explain the lower weights of the duodenum and cecum due to reduced nutrient absorption. The crypts of Liberkuhn lie between the intestinal villi and assist in the protein digestion as well as protection of the host from enteric pathogens [<a href=\"#r-32\">32</a>]. According to earlier studies, CORT decreases the digestion of protein and carbohydrates [10, 28]. Crypt depth is considered an indicator of intestinal epithelium maturation [<a href=\"#r-26\">26</a>]. CORT treatment reportedly slows down intestinal epithelial cell proliferation and thus decreases intestinal villi length and crypt depth which impairs nutrient absorption in the intestine of broilers [<a href=\"#r-26\">26</a>]. In the current study, the crypts have almost degenerated in the higher dose group which may affect the overall gut health and performance.<br />\r\nMarked disruption of the mucosal surface epithelial cells along with mucosal degeneration was seen in the cecum of DEX treated broilers. Continuity of the intestinal lining epithelium is crucial for maintaining intestinal permeability which is mainly regulated by tight junction distribution and integrity. The epithelial cells overlying the mucosa are derived from progenitors like stem cells residing within the crypt [<a href=\"#r-33\">33</a>]. The undifferentiated epithelial cells exit the base of the crypt and migrate through the lumen and mature into highly specialized absorptive enterocytes [<a href=\"#r-34\">34</a>]. If the mucosal epithelial cells get damaged or destroyed due to adverse conditions in the intestine, the stem cells located in the crypt repair the epithelial layer by reproducing new undifferentiated epithelial cells [<a href=\"#r-35\">35</a>]. So, in case of degeneration or loss of crypt, the damaged villous epithelial layer can’t regenerate which may greatly alter the intestinal functionality. The extent of intestinal nutrient uptake is modulated not only by the digestive secretions but also by the absorptive surface area of the intestine [<a href=\"#r-4\">4</a>]. So, the integrity of the mucosal layer is crucial for proper intestinal function and thus the mucosal morphological features correspond with increased feed efficiency and growth rate in broiler [<a href=\"#r-36\">36</a>]. Histomorphometric investigation showed that the mucosal height declined significantly in the treated broilers. This finding is similar to the results reported by the earlier studies [<a href=\"#r-13\">13</a>, <a href=\"#r-21\">21</a>]. The major role of the caeca is to separate the intestinal contents into a nutrient-rich fluid fraction that enters the caeca for digestion and absorption [<a href=\"#r-6\">6</a>]. The villi of the mucosa extend into the lumen of the intestine and thus increase the absorptive surface area [<a href=\"#r-35\">35</a>]. So, the decrease of the mucosal surface area will lead to the reduction of absorptive surface area in the cecum which may negatively affect the feed efficiency and ultimately the growth rate and health of the broiler.<br />\r\nBesides these, the degeneration and loss of lymphatic nodules were also seen in the current study. Lymphatic nodules are among the gut-associated lymphoid tissues in poultry, which is one of the main components of the lateral immune system. These gut-associated lymphoid tissues react with the gut microflora and play a pivotal role in controlling the incidence of poultry enteric disorders through its immunological functions [<a href=\"#r-37\">37</a>]. Hence, the structural integrity of lymphatic nodules is crucial for proper functioning and achieving optimal production performance through digestion, absorption of nutrients, and immunity.<br />\r\nThe thickness of the muscularis layer was also seen to be decreased in the treated broilers with scattered degenerative changes. DEX decreases protein synthesis, as well as increases protein catabolism and proteolytic activities in the muscularis layer leading to muscular atrophy [<a href=\"#r-38\">38</a>]. However, the exact mechanism of the muscle degeneration and reduction of the thickness of the muscularis layer of the broiler cecum is ambiguous.</p>"
},
{
"section_number": 5,
"section_title": "CONCLUSIONS",
"body": "<p>Looking at an overview of the obtained results from the current study, it is evident that DEX treatment induces stress in broilers which significantly affects the morphology and morphometry of the broiler intestine. The adverse effects of DEX induced stress on the intestinal mucosa, glands, and lymphatic nodules may lead to impaired digestion of food particles, reduced absorption of nutrients, and diminished gut immunity which may affect the health and production of broiler. However, further study is recommended to investigate the enzymatic activity in the duodenum as well as the microbial population in the cecum of stressed broilers induced by dietary DEX.</p>"
},
{
"section_number": 6,
"section_title": "ACKNOWLEDGMENTS",
"body": "<p>We appreciate the research assistance from the Department of Parasitology, Faculty of veterinary science, Bangladesh Agricultural University, Bangladesh. We also acknowledge the technical support from the Department of Anatomy and Histology, Faculty of Veterinary Science, Bangladesh Agricultural University, Bangladesh.</p>"
},
{
"section_number": 7,
"section_title": "AUTHOR CONTRIBUTIONS",
"body": "<p>NS conceptualized and supervised the experiment. RI performed the experiment. RRD assisted in the sample collection and gross data recording. A provided research assistance for histomorphometric data collection. SB and RI analyzed the data and interpreted the results. NS and RI drafted the manuscript. MRI and ZH critically revised and edited the manuscript. All authors gave final approval and agreed to be accountable for all aspects of work in ensuring that questions relating to the accuracy or integrity of any part of the work.</p>"
},
{
"section_number": 8,
"section_title": "CONFLICTS OF INTEREST",
"body": "<p>There is no conflict of interest among the authors.</p>"
}
],
"figures": [
{
"figure": "https://jabet.bsmiab.org/media/article_images/2023/50/06/178-1648570864-Figure1.jpg",
"caption": "Figure 1. Representative images of gross view of broiler duodenum after collection of the sample on day 28.",
"featured": false
},
{
"figure": "https://jabet.bsmiab.org/media/article_images/2023/50/06/178-1648570864-Figure2.jpg",
"caption": "Figure 2. Effects of dietary DEX on the weight (gm), length (cm), and width (cm) of the duodenum in DEX treated broiler. Data were expressed as mean SEM. Columns on different days with different alphabetic superscripts are significantly (p < 0.05) different from each other.",
"featured": false
},
{
"figure": "https://jabet.bsmiab.org/media/article_images/2023/50/06/178-1648570864-Figure3.jpg",
"caption": "Figure 3. Representative photomicrographs of transverse section (H & E stained) of the duodenum from 28-day old broilers. VL- Villi length, VW- Villi width, C- Crypts, dC- Degeneration of crypts.",
"featured": false
},
{
"figure": "https://jabet.bsmiab.org/media/article_images/2023/50/06/178-1648570864-Figure4.jpg",
"caption": "Figure 4. Representative images of gross view of broiler right cecum after collection of the sample on day 28.",
"featured": false
},
{
"figure": "https://jabet.bsmiab.org/media/article_images/2023/50/06/178-1648570864-Figure5.jpg",
"caption": "Figure 5. Effects of dietary DEX on the weight (gm), length (cm), and width (cm) of the right cecum in DEX treated broiler. Data were expressed as mean SEM. Columns on different days with different alphabetic superscripts are significantly (p < 0.05) different from each other.",
"featured": false
},
{
"figure": "https://jabet.bsmiab.org/media/article_images/2023/50/06/178-1648570864-Figure6.jpg",
"caption": "Figure 5. Effects of dietary DEX on the weight (gm), length (cm), and width (cm) of the right cecum in DEX treated broiler. Data were expressed as mean SEM. Columns on different days with different alphabetic superscripts are significantly (p < 0.05) different from each other.",
"featured": false
},
{
"figure": "https://jabet.bsmiab.org/media/article_images/2023/50/06/178-1648570864-Figure7.jpg",
"caption": "Figure 7. Percentage of degenerated lymphatic nodules in cecum in the DEX treated groups on different days of the experiment.",
"featured": false
}
],
"authors": [
{
"id": 320,
"affiliation": [
{
"affiliation": "Department of Anatomy and Histology, Faculty of Veterinary Science, Bangladesh Agricultural University, Mymensingh, Bangladesh."
}
],
"first_name": "Rafiqul",
"family_name": "Islam",
"email": null,
"author_order": 1,
"ORCID": "http://orcid.org/0000-0001-6765-2693",
"corresponding": false,
"co_first_author": false,
"co_author": false,
"corresponding_author_info": "",
"article": 85
},
{
"id": 321,
"affiliation": [
{
"affiliation": "Department of Anatomy and Histology, Faculty of Veterinary Science, Bangladesh Agricultural University, Mymensingh, Bangladesh."
}
],
"first_name": "Nasrin",
"family_name": "Sultana",
"email": "nasrin.sultana@bau.edu.bd",
"author_order": 2,
"ORCID": "http://orcid.org/0000-0001-5498-1017",
"corresponding": true,
"co_first_author": false,
"co_author": false,
"corresponding_author_info": "Nasrin Sultana, PhD; Associate Professor Department of Anatomy and\r\nHistology, Bangladesh Agricultural University, Mymensingh-2202,\r\nBangladesh, e-mail: nasrin.sultana@bau.edu.bd",
"article": 85
},
{
"id": 322,
"affiliation": [
{
"affiliation": "Department of Anatomy and Histology, Faculty of Veterinary Science, Bangladesh Agricultural University, Mymensingh, Bangladesh."
}
],
"first_name": "Rekha Rani",
"family_name": "Das",
"email": null,
"author_order": 3,
"ORCID": null,
"corresponding": false,
"co_first_author": false,
"co_author": false,
"corresponding_author_info": "",
"article": 85
},
{
"id": 323,
"affiliation": [
{
"affiliation": "Department of Anatomy and Histology, Faculty of Veterinary Science, Bangladesh Agricultural University, Mymensingh, Bangladesh."
}
],
"first_name": "Sonali",
"family_name": "Bhakta",
"email": null,
"author_order": 4,
"ORCID": "http://orcid.org/0000-0002-1177-068X",
"corresponding": false,
"co_first_author": false,
"co_author": false,
"corresponding_author_info": "",
"article": 85
},
{
"id": 324,
"affiliation": [
{
"affiliation": "Department of Parasitology, Faculty of Veterinary Science, Bangladesh Agricultural University, Mymensingh, Bangladesh."
}
],
"first_name": "Dr.",
"family_name": "Anisuzzaman",
"email": null,
"author_order": 5,
"ORCID": "http://orcid.org/0000-0002-7350-3093",
"corresponding": false,
"co_first_author": false,
"co_author": false,
"corresponding_author_info": "",
"article": 85
},
{
"id": 325,
"affiliation": [
{
"affiliation": "Department of Anatomy and Histology, Faculty of Veterinary Science, Bangladesh Agricultural University, Mymensingh, Bangladesh."
}
],
"first_name": "Ziaul",
"family_name": "Haque",
"email": null,
"author_order": 6,
"ORCID": "http://orcid.org/0000-0002-8000-4575",
"corresponding": false,
"co_first_author": false,
"co_author": false,
"corresponding_author_info": "",
"article": 85
},
{
"id": 326,
"affiliation": [
{
"affiliation": "Department of Anatomy and Histology, Faculty of Veterinary Science, Bangladesh Agricultural University, Mymensingh, Bangladesh."
}
],
"first_name": "Mohammad Rafiqul",
"family_name": "Islam",
"email": null,
"author_order": 7,
"ORCID": null,
"corresponding": false,
"co_first_author": false,
"co_author": false,
"corresponding_author_info": "",
"article": 85
}
],
"views": 1619,
"downloads": 164,
"references": [
{
"id": 2502,
"serial_number": 1,
"pmc": null,
"reference": "Godfray HC, Crute IR, Haddad L, Lawrence D, Muir JF, Nisbett N, et al. The future of the global food system. Philos. Trans R Soc B Biol Sci. 2010; 365: 2769-2777.",
"DOI": null,
"article": 85
},
{
"id": 2503,
"serial_number": 2,
"pmc": null,
"reference": "Tan Z, Luo L, Wang X, Wen Q, Zhou L, Wu K. Characterization of the cecal microbiome composition of Wenchang chickens before and after fattening. PloS One. 2019; 14: e0225692.",
"DOI": null,
"article": 85
},
{
"id": 2504,
"serial_number": 3,
"pmc": null,
"reference": "Nain S, Renema RA, Zuidhof MJ, Korver DR. Effect of metabolic efficiency and intestinal morphology on variability in n-3 polyunsaturated fatty acid enrichment of eggs. Poult Sci. 2012; 91: 888–898.",
"DOI": null,
"article": 85
},
{
"id": 2505,
"serial_number": 4,
"pmc": null,
"reference": "Diaz Carrasco JM, Casanova NA, Fernández Miyakawa ME. Microbiota, gut health and chicken productivity: what is the connection? Microorganisms. 2019; (10): 374.",
"DOI": null,
"article": 85
},
{
"id": 2537,
"serial_number": 5,
"pmc": null,
"reference": "Svihus B, Choct M, Classen HL. Function and nutritional roles of the avian caeca: a review. World’s Poult Sci J. 2013; 69: 249-264.",
"DOI": null,
"article": 85
},
{
"id": 2538,
"serial_number": 6,
"pmc": null,
"reference": "Carvalho D, Herpich JI, Chitolina GZ, Gava MS, Moraes LB, Furian TQ, et al. Characterization of immune and enteric systems of broilers after immunosuppression with dexamethasone. Acta Sci Vet. 2018; 46: 1606.",
"DOI": null,
"article": 85
},
{
"id": 2539,
"serial_number": 7,
"pmc": null,
"reference": "Majeed MF, Al-Asadi FS, Nassir AA, Rahi EH. The morphological and histological study of the cecum in broiler chicken. Bas J Vet Res. 2009; 8: 19-25.",
"DOI": null,
"article": 85
},
{
"id": 2540,
"serial_number": 8,
"pmc": null,
"reference": "Calefi AS, Quinteiro-Filho WM, Ferreira AJ, Palermo-Neto J. Neuroimmunomodulation and heat stress in poultry. World’s Poult Sci J. 2017; 73: 493-504.",
"DOI": null,
"article": 85
},
{
"id": 2541,
"serial_number": 9,
"pmc": null,
"reference": "Puvadolpirod S, Thaxton JP. Model of physiological stress in chickens 4. Digestion and metabolism. Poult Sci. 2000; 79: 383-390.",
"DOI": null,
"article": 85
},
{
"id": 2542,
"serial_number": 10,
"pmc": null,
"reference": "Scanes CG. Biology of stress in poultry with emphasis on glucocorticoids and the heterophil to lymphocyte ratio. Poult Sci. 2016; 95: 2208-2215.",
"DOI": null,
"article": 85
},
{
"id": 2543,
"serial_number": 11,
"pmc": null,
"reference": "Ademu LA, Erakpatobor-Iyeghe GT, Barje PP, Daudu OM, Wafar RJ. Response of broiler chickens under dexamethasone induced stress conditions. Asian J Res Anim Vet Sci. 2018; 1: 1-9.",
"DOI": null,
"article": 85
},
{
"id": 2544,
"serial_number": 12,
"pmc": null,
"reference": "Berenjian A, Sharifi SD, Mohammadi-Sangcheshmeh A, Bakhtiarizadeh MR. Omega-3 fatty acids reduce the negative effects of dexamethasone-induced physiological stress in laying hens by acting through the nutrient digestibility and gut morphometry. Poult Sci. 2021; 100: 100889.",
"DOI": null,
"article": 85
},
{
"id": 2545,
"serial_number": 13,
"pmc": null,
"reference": "Mehaisen GM, Eshak MG, Elkaiaty AM, Atta AR, Mashaly MM, Abass AO. Comprehensive growth performance, immune function, plasma biochemistry, gene expressions and cell death morphology responses to a daily corticosterone injection course in broiler chickens. PLoS One. 2017; 12: e0172684.",
"DOI": null,
"article": 85
},
{
"id": 2546,
"serial_number": 14,
"pmc": null,
"reference": "Sultana N, Amin T, Afrose M, Rony SA, Rafiq K. Effects of Dexamethasone on the Morphometry and Biometry of Immune Organs of Broiler Chicken. Int J Morphol. 2020a; 38: 1032-1038.",
"DOI": null,
"article": 85
},
{
"id": 2547,
"serial_number": 15,
"pmc": null,
"reference": "Yang J, Liu L, Sheikhahmadi A, Wang Y, Li C, Jiao H, et al. Effects of corticosterone and dietary energy on immune function of broiler chickens. PLoS One. 2015 10: e0119750.",
"DOI": null,
"article": 85
},
{
"id": 2548,
"serial_number": 16,
"pmc": null,
"reference": "Akter F, Sultana N, Afrose M, Kabir A, Islam R, Sikder MH. Adaptations of muscular biology in response to potential glucocorticoid treatment in broiler chicken. J Adv Biotechnol Exp Ther. 2021; 4: 1-8.",
"DOI": null,
"article": 85
},
{
"id": 2549,
"serial_number": 17,
"pmc": null,
"reference": "Moisiadis VG, Matthews SG. Glucocorticoids and fetal programming part 2: mechanisms. Nat Rev Endocrinol. 2014; 10: 403-411.",
"DOI": null,
"article": 85
},
{
"id": 2550,
"serial_number": 18,
"pmc": null,
"reference": "Sultana N, Islam R, Akter A, Ayman U, Bhakta S, Rony SA, et al. Biochemical and morphological attributes of broiler kidney in response to dietary glucocorticoid, dexamethasone. Saudi J Biol Sci. 2021; 28: 6721-6729.",
"DOI": null,
"article": 85
},
{
"id": 2551,
"serial_number": 19,
"pmc": null,
"reference": "Sultana N, Afrose M, Rafiq K. Effects of steroid growth promoter on morphological and biochemical adaptations in liver of broiler. Vet World. 2020b; 13: 2330-2337.",
"DOI": null,
"article": 85
},
{
"id": 2552,
"serial_number": 20,
"pmc": null,
"reference": "Lima MBD, Gama LA, Hauschildt AT, Dall’Agnol DJR, Corá LA, Americo MF. Gastrointestinal motility, mucosal mast cell, and intestinal histology in rats: effect of prednisone. Biomed Res Int. 2017; 2017: 1-8.",
"DOI": null,
"article": 85
},
{
"id": 2553,
"serial_number": 21,
"pmc": null,
"reference": "Moghaddam HN, Alizadeh-Ghamsari AH. Improved performance and small intestinal development of broiler chickens by dietary L-glutamine supplementation. Journal of Appl Anim Res. 2013; 41: 1-7.",
"DOI": null,
"article": 85
},
{
"id": 2554,
"serial_number": 22,
"pmc": null,
"reference": "Yin LY, Wang ZY, Yang HM, Xu L, Zhang J, Xing H. Effects of stocking density on growth performance, feather growth, intestinal development, and serum parameters of geese. Poult Sci. 2017; 96: 3163-3168.",
"DOI": null,
"article": 85
},
{
"id": 2555,
"serial_number": 23,
"pmc": null,
"reference": "Vahdatpour T, Nazer Adl K, Ebrahim Nezhad Y, Mahery Sis N, Riyazi SR, Vahdatpour S. Effects of corticosterone intake as stress-alternative hormone on broiler chickens: performance and blood parameters. Asian J Anim Vet Adv. 2009; 4: 16-21.",
"DOI": null,
"article": 85
},
{
"id": 2556,
"serial_number": 24,
"pmc": null,
"reference": "Hu X, Guo Y. Corticosterone Administration Alters Small Intestinal Morphology and Function of Broiler Chickens. Asian-Australasian J Anim Sci. 2008; 21: 1773–1778.",
"DOI": null,
"article": 85
},
{
"id": 2557,
"serial_number": 25,
"pmc": null,
"reference": "Li Y, Cai HY, Liu GH, Dong XL, Chang WH, Zhang S, et al. Effects of stress simulated by dexamethasone on jejunal glucose transport in broilers. Poult Sci. 2009; 88: 330-337.",
"DOI": null,
"article": 85
},
{
"id": 2558,
"serial_number": 26,
"pmc": null,
"reference": "Berrocoso JD, Kida R, Singh AK, Kim YS, Jha R. Effect of in ovo injection of raffinose on growth performance and gut health parameters of broiler chicken. Poult Sci. 2017; 96: 1573-1580.",
"DOI": null,
"article": 85
},
{
"id": 2559,
"serial_number": 27,
"pmc": null,
"reference": "Nasrin M, Siddiqi MNH, Masum MA, Wares MA. Gross and histological studies of digestive tract of broilers during postnatal growth and development. JBAU. 2012; 10: 69-77.",
"DOI": null,
"article": 85
},
{
"id": 2560,
"serial_number": 28,
"pmc": null,
"reference": "Metzler-Zebeli BU, Magowan E, Hollmann M, Ball ME, Molnár A, et al. Differences in intestinal size, structure, and function contributing to feed efficiency in broiler chickens reared at geographically distant locations. Poult Sci. 2018; 97(2): 578-591.",
"DOI": null,
"article": 85
},
{
"id": 2561,
"serial_number": 29,
"pmc": null,
"reference": "Tschanz SA, Makanya AN, Haenni B, Burri PH. Effects of neonatal high-dose short-term glucocorticoid treatment on the lung: a morphologic and morphometric study in the rat. Pediatr Res. 2003; 53: 72-80.",
"DOI": null,
"article": 85
},
{
"id": 2562,
"serial_number": 30,
"pmc": null,
"reference": "Bauer E, Jakob S, Mosenthin R. Principles of physiology of lipid digestion. Asian-Australas J Anim Sci. 2005; 18: 282-295.",
"DOI": null,
"article": 85
},
{
"id": 2563,
"serial_number": 31,
"pmc": null,
"reference": "Hunt A, Al-Nakkash L, Lee AH, Smith HF. Phylogeny and herbivory are related to avian cecal size. Sci Rep. 2019; 9: 1-9.",
"DOI": null,
"article": 85
},
{
"id": 2564,
"serial_number": 32,
"pmc": null,
"reference": "Clevers HC, Bevins CL. Paneth cells: maestros of the small intestinal crypts. Annu Rev Physiol. 2013; 75: 289-311.",
"DOI": null,
"article": 85
},
{
"id": 2565,
"serial_number": 33,
"pmc": null,
"reference": "Barker N, Van Es JH, Kuipers J, Kujala P, Van Den Born M, Cozijnsen M, et al. Identification of stem cells in small intestine and colon by marker gene Lgr5. Nature. 2007; 449; 1003-1007.",
"DOI": null,
"article": 85
},
{
"id": 2566,
"serial_number": 34,
"pmc": null,
"reference": "Edelblum KL, Turner JR. Epithelial Cells: Structure, Transport, and Barrier Function. Mucosal Immunol. 2015; 1: 187-210.",
"DOI": null,
"article": 85
},
{
"id": 2567,
"serial_number": 35,
"pmc": null,
"reference": "Shen L. Functional morphology of the gastrointestinal tract. Curr Top Microbiol Immunol. 2009; 337: 1-35.",
"DOI": null,
"article": 85
},
{
"id": 2568,
"serial_number": 36,
"pmc": null,
"reference": "Yamauchi KE. Review on chicken intestinal villus histological alterations related with intestinal function. J Poult Sci. 2002; 39: 229-242.",
"DOI": null,
"article": 85
},
{
"id": 2569,
"serial_number": 37,
"pmc": null,
"reference": "Callaway TR, Edrington TS, Anderson RC, Harvey RB, Genovese KJ, Kennedy CN, et al. Probiotics, prebiotics, and competitive exclusion for prophylaxis against bacterial disease. Anim Health Res Rev. 2008; 9: 217-225.",
"DOI": null,
"article": 85
},
{
"id": 2570,
"serial_number": 38,
"pmc": null,
"reference": "Schakman O, Kalista S, Barbé C, Loumaye A, Thissen JP. Glucocorticoid-induced skeletal muscle atrophy. Int J Biochem Cell Biol. 2013; 45: 2163-2172.",
"DOI": null,
"article": 85
}
]
},
{
"id": 84,
"slug": "178-1647620861-evaluation-of-antibacterial-antibiofilm-activity-of-biosynthesis-mgonps-and-cellular-immunity-in-rabbit",
"featured": false,
"slider": false,
"issue": "Vol5 Issue2",
"type": "original_article",
"manuscript_id": "178-1647620861",
"recieved": "2022-03-19",
"revised": null,
"accepted": "2022-04-18",
"published": "2022-04-22",
"pdf_file": "https://jabet.bsmiab.org/media/pdf_file/2023/02/178-1647620861.pdf",
"title": "Evaluation of antibacterial, antibiofilm activity of biosynthesis MgONPs and cellular immunity in rabbit",
"abstract": "<p>Magnesium oxide (MgO) is one of the most promising nanoparticles due to its mono-metallic oxide group, High melting point, no toxicity issues, high hardness, and high purity. For those reasons, these materials were used in many fields including medicine, agriculture, electronics, energy, and environmental protection. <em>Leuconostoc</em> spp. was used as a facility to biosynthesize MgO nanoparticles, then optimized pH and Mg (NO3)2.6H2O concentration for its antibacterial activity and cellular immunity reactions including skin sensitivity through studying Interleukin 1-Beta (IL-1β), Interleukin 17 (IL-17) and Interleukin 2 (IL-2) responding. The study shows that the optimum pH for Magnesium Oxide (MgO) biosynthesis was 12, optimum Mg (NO3)2.6H2O concentration was 0.1 M, while antibacterial activity shows a high effect on Gram-negative bacteria with 125 µg/ml as minimum inhibiting concentration (MIC) and 500 µg/ml as minimum bactericidal concentration (MBC), the immunity study appeared that the MgO nanoparticles (MgONPs) altered the immunity response in skin test duration and diameter of MgONPs as 1.31±0.55, 9.33±1.15, 11.33±1.75 and 8.33±0.75 mm after 4,24,84 and 72 hours, respectively. IL-1β, IL-17 and IL-2 show significant differences compared to the control group at P-value ≤ 0.05 as 82.305±13.38, 101.444±16.943 and 49.781±5.264, respectively. MgONPs can be used as an alternative treatment for multidrug resistance MDR bacteria due to their high effectiveness against bacterial growth, MgONPs induced the cellular immunity response in rabbit tissues as delivery of immunogen.</p>",
"journal_reference": "J Adv Biotechnol Exp Ther. 2022; 5(2): 381-393.",
"academic_editor": "Md Jamal Uddin, PhD; ABEx Bio-Research Center, Dhaka, Bangladesh.",
"cite_info": "Hassan D, Abd F, et al. Evaluation of antibacterial, antibiofilm activity of biosynthesis MgONPs and cellular immunity in rabbit. J Adv Biotechnol Exp Ther. 2022; 5(2): 381-393.",
"keywords": [
"Immunity response",
"Cytokines",
"Immunogen delivers",
"MgONPs",
"Leuconostoc spp."
],
"DOI": "10.5455/jabet.2022.d122",
"sections": [
{
"section_number": 1,
"section_title": "INTRODUCTION",
"body": "<p>Magnesium oxide nanoparticles (MgONPs) have been widely used in a variety of applications: medical, electronical, energy and environmental studies [<a href=\"#r-1\">1</a>]. Many studies in the last decades prepared metal oxides nanoparticles with large reactive surface areas possessing unique magnetic, electronical, optical, thermal, chemical and mechanical properties due to their special chemical and physical properties [<a href=\"#r-2\">2–4</a>]. MgONPs showed excellent antibacterial effects against a wide range of pathogenic microorganisms for both Gram-positive and negative groups, so that may effectively help in medical fields as an alternative treatment, especially those multidrug resistance bacteria MDR [<a href=\"#r-5\">5</a>]. Studies reported that the MgONPs activity against bacteria through the production of reactive oxygen species ROS which induce peroxidation of lipid in bacteria [<a href=\"#r-6\">6</a>].<br />\r\nMgONPs have been evaluated for their effect on the immune system via an effect on humoral immune responses from the upward neutralizing antibodies, but due to commercial additives like Alum, which may lead to bad immune response consequences, but in general, there was no toxicity became discovered from using MgONPs as an adjuvant could be taken into consideration as a promising treatment [<a href=\"#r-7\">7</a>].<br />\r\nNanoparticles generally interact with many immune system components, which improves or drawbacks their interaction in the body [<a href=\"#r-8\">8</a>]. Nanoparticles can dramatically activate the immune system like vaccination, Cytokines are cell to cell messengers just like hormones, which means nanoparticles can be used to maximize Cytokines activity by promoting a delivery carrier. Cytokines’ physiological role is widely recognized in tissue homeostasis, cell differentiation, delivery and immune tool response to trauma, inflammation, and infection [<a href=\"#r-9\">9,10</a>].<br />\r\nCytokines, as an anti-inflammatory was frequently measured to predict immune-modulation as a result of using nanomaterials in-vivo study as a response to measure the toxicity of nanomaterials, additionally alternate therapeutic effects of pharmaceutical substances delivered by nanoparticles [<a href=\"#r-11\">11</a>]. NLR family pyrin containing 3 (NLRP3) expressed by macrophage, activation of NLRP3 triggered the immune response and act as an anti-inflammatory, nanoparticles can mediate NLRP3 activity to affect the secretion of IL-1β, which in turn double-walled carbon nanotube have reinforced the anti-inflammatory role of cytokine IL-1β released by monocyte through NLRP3 pathway [<a href=\"#r-12\">12,13</a>].<br />\r\nPrevious studies used E. coli as a pathogen model by collecting outer membrane vehicles OMV and coating them onto magnesium nanoparticles MgONPs to create what are called bacterial membrane magnesium nanoparticles BM-MgONPs which in turn activate rapidly the immune response of lymphocytes, results of this study show immune response higher than OMV only, so they used nanomaterials as vaccination. BM-MgONPs induce the production of interferon-gamma INFγ and interleukin 17 (IL-17) indicating the capability to generate strong Th1 and Th17 biased cell responses against bacterial infection [<a href=\"#r-14\">14</a>].</p>"
},
{
"section_number": 2,
"section_title": "MATERIALS AND METHODS",
"body": "<p><strong>Ethical statements</strong><br />\r\nEvery volunteer has given written informed permission. This research received ethical approval (DSM/HO-1632) for scientific research from the Ministry of Health MOH and Ministry of Higher Education and Scientific Research MOHESR ethics committees in Iraq.</p>\r\n\r\n<p> </p>\r\n\r\n<p><strong>MgONPs synthesis from</strong><em> <strong>leuconostic </strong></em><strong>spp.</strong><br />\r\nMgONPs with 43.85 nm were prepared and characterized in a previous study [15]. MgONPs suspension at 4µg/ml concentration, where 4mg of the nanoparticles powder were dissolved in one ml of deionized distilled water and they were mixed well with vortex, then placed in a sonicator Ultra Sonic Bath and then filtered with a microfilter [<a href=\"#r-16\">16</a>].</p>\r\n\r\n<p> </p>\r\n\r\n<p><strong>Optimization of MgONPs synthesis</strong><br />\r\nThe effect of various physicochemical parameters such as pH and Magnesium nitrate hexahydrate concentration were studied to determine the optimum growth condition of MgONPs synthesis [<a href=\"#r-17\">17,18</a>]. The effects of pH were studied by incubating the broth of bacteria with Mg (NO₃)₂.6H₂O, pH (6, 8, 10, 12,14) was adjusted in a series of 5 tubes. The culture was harvested incubator at 40°C for 20min. Media then were incubated at room temperature for 10hr., then centrifuged to sediment the MgONPs and washed twice with DW and examined in UV-spectrophotometer. An experiment was designed for the detection of the optimum concentration of the substrate for biosynthesis of MgONPs. Two concentrations (1 and 0.1) M from Mg (NO₃)₂.6H₂O were examined for the optimum concentration for MgONPs biosynthesis. The optimum pH was used, and all the tubes were incubated in a shaking incubator at 40°C for 20min. Media then were incubated at room temperature for 10hr, then centrifuged to sediment the MgONPs and washed twice with DW and examined in a UV -spectrophotometer.</p>\r\n\r\n<p> </p>\r\n\r\n<p><strong>Antibacterial activity test of MgONPs by agar well diffusion method</strong><br />\r\nThe activity MgONPs as an antimicrobial against MDR human pathogen was tested against Gram-negative bacteria Salmonella Typhi, the test was carried out according to clinical and laboratory standards institute instruction [<a href=\"#r-19\">19,20</a>]. In this study, we used the agar well diffusion method to assess bacterial responses to inhibition or resistance to MgONPs, so a serial dilution of MgONPs was prepared as (500, 250, 125, 62.5, 31.25, 15.6 µg/ml) in triplicates, the bacterial isolates were firstly incubated at 4°C for 15 minutes before transmitted to 37°C, measuring of inhibition zone was taken directly after the appearance of inhibition then recording time and inhibition zone diameter with a digital vernier calliper.</p>\r\n\r\n<p> </p>\r\n\r\n<p><strong>Minimal inhibitory and minimal bactericidal concentration (MIC and MBC) test of MgONPs</strong><br />\r\nMcFarland tube 0.5 was prepared as a standard for an estimate the bacterial growth, candidate bacterial isolates were incubated at 37°C overnight in a 10 ml nutrient broth medium, then inoculation each sample with 1ml of the microbial suspension (108 colony/ml), MgONPs were prepared as six dilutions (diluted in deionized water) as follow: 500, 250, 125, 62.5, 34.25 and 15.6 µg/ml, and same dilutions without MgONPs as a negative control, the MIC measured by spectrophotometer at 600 nm after incubation, well showed no turbidity in nutrient agar plates, bacterial colonies show no growth presented as MBC [<a href=\"#r-21\">21</a>].</p>\r\n\r\n<p> </p>\r\n\r\n<p><strong>Preparation of MgONPs vs antibiotics combination</strong><br />\r\nA mixture of our candidate MgO nanoparticles and other antibiotics were prepared by choosing a minimal active dose of MgONPs and antibiotic as 125 µg/ml MgONPs + 5mg/ml CIP, and 125 µg/ml MgONPs + 10mg/ml GN and inserted in every well of at room temperature for 1 hour then incubated for 24 hours at 37°C. Bacterial isolates standardized at 1.5*108 in 0.1 ml, agar medium drilled by cork borers [<a href=\"#r-19\">19,20</a>].</p>\r\n\r\n<p> </p>\r\n\r\n<p><strong>Immunization of lab animals</strong><br />\r\nLaboratory animals in this study included six New Zealand adult male rabbits Oryctolagus cuniculus in the animal house of the College of Sciences/the University of Babylon, fed with healthy no additives during the experiment, each rabbit was about 1-1.5 kg of weight at 3-5 months age. The animals were immunized intramuscularly with MgONPs synthesized by <em>Leuconostoc </em>spp. at 1 ml per 1 kg according to [<a href=\"#r-22\">22</a>]. The layout of the experiment was carried out by immunization of three rabbits with MgONPs with 4 µg/ml of concentration at 1 ml per each 1 kg of animal weight, and the control group was injected with normal saline, the experiment was prolonged for three weeks and animals one dose per week [<a href=\"#r-23\">23</a>].<br />\r\nBlood samples were collected by heart puncture with a sterile disposal syringe (about 8-10 ml) from six immunized rabbits with MgONPs and non-immunized animals (control group). Half of the blood volume about 2-4 ml of collected blood was left at room temperature till clotted, then centrifuged at 3000 rpm per 5 minutes. Serum was collected and divided into 0.5 ml in an Eppendorf tube and froze till the testing time, serum was divided into small groups to prevent any errors that may occur due to repeated freezing and thawing. The remaining half of the collected blood was placed in an EDTA tube to prevent coagulation [<a href=\"#r-24\">24</a>].</p>\r\n\r\n<p> </p>\r\n\r\n<p><strong>Skin test</strong><br />\r\nA skin test was carried out in the fourth week of the experiment when started by examining the intradermal skin layer for both groups (MgONPs injected and control groups) and recording the observed changes after 4, 24, 48 and 72 hours. This test was to find out the effect of MgO nanoparticles on the sensitivity of animals and the effect to stimulate the immune response of animals. Interleukin (IL-1β, IL-2 and IL-17) levels were measured according to manufacturer instruction of (Elabscience-China) by ELISA technique.</p>\r\n\r\n<p> </p>\r\n\r\n<p><strong>Statistical analysis</strong><br />\r\nData were analyzed and processed by SPSS 19 software performing a One-Way Analysis of Variance (ANOVA) test, Mean, Standard Deviation (SD), and P-value which was below 0.05 considered for statistical significance [<a href=\"#r-25\">25</a>].</p>"
},
{
"section_number": 3,
"section_title": "RESULTS",
"body": "<p><strong>MgONPs biosynthesis optimization</strong><br />\r\npH optimization, optimizing of pH important factor in nanoparticles biosynthesis due to its effect on the stability of nanoparticles structure which may affect the aggregation of the particle also the physical properties of nanoparticles, in this study we assess the optimum pH of MgONPs synthesized by a bacterial isolate by preparing pH as 6, 8, 10, 12 and 14 (buffering accomplished by NaOH 1% and HCl 1% to reach accurate pH value), the results depending on wavelength 350-700 nm which show that the pH=12 was the best pH value show optimum absorption by spectrophotometer as shown in <a href=\"#figure1\">figure 1</a>.<br />\r\nNanoparticles salt magnesium-nitrate hexahydrates Mg (NO₃)₂.6H₂O concentration used as additives to the medium broth in this study as 0.05, 0.1 and 0.2 M as well as 0.05, 0.1 and 0.2 M for NaOH which prepared according to [9], the salt concentration shows best yield production was at 0.1 M when measured at 100-1000 nm of wavelength as shown in <a href=\"#figure2\">figure 2</a>.<br />\r\nThe experiment was carried out depending on the Taguchi method, by preparing different concentrations of Mg (NO3)2.6H2O were added to NaOH solution and stirred for 30, 60, and 90 minutes then separated by centrifugation, washing solution to remove any impurities then dried by the oven, Magnesium hydroxide powder was crystalized at 450°C in a furnace resulting white powder made from magnesium oxide nanoparticles [<a href=\"#r-5\">5</a>,<a href=\"#r-15\">15,17</a>].</p>\r\n\r\n<div id=\"figure1\">\r\n<figure class=\"image\"><img alt=\"\" height=\"296\" src=\"/media/article_images/2023/04/07/178-1647620861-Figure1.jpg\" width=\"500\" />\r\n<figcaption><strong>Figure 1. </strong>Different pH values to detect the best pH for Leuconostoc spp. for MgONPs synthesis.</figcaption>\r\n</figure>\r\n</div>\r\n\r\n<div id=\"figure2\">\r\n<figure class=\"image\"><img alt=\"\" height=\"318\" src=\"/media/article_images/2023/04/07/178-1647620861-Figure2.jpg\" width=\"500\" />\r\n<figcaption><strong>Figure 2. </strong>The production of MgONPs that synthesis by isolating Leuconostoc spp. in different concentrations of salt.</figcaption>\r\n</figure>\r\n\r\n<p> </p>\r\n</div>\r\n\r\n<p><strong>Antibacterial activity of MgONPs against MDR bacteria and determination (MIC) and (MBC) test</strong><br />\r\nThe antimicrobial activity of candidate MgONPs was evaluated with four types of Salmonella Typhi isolates which were diagnosed biochemically by the Vitek-2 system. MIC and MBC were established with serial dilution by broth microdilution technique then the growth was measured with a spectrophotometer at 600 nm of wavelength as shown in <a href=\"#Table-1\">table 1</a>.<br />\r\nMIC of MgONPs result was 125 µg/ml and the MBC was 500 µg/ml these results show the effectiveness of magnesium oxide nanoparticles as an antimicrobial agent [<a href=\"#r-26\">26</a>], MgONPs alone or in combination with other antimicrobial agents came with the same results which are reduction in the number of Gram-negative bacteria according to this study and a previous study [<a href=\"#r-27\">27,28</a>]. As shown in <a href=\"#Table-2\">table 2</a>.</p>\r\n\r\n<div id=\"Table-1\">\r\n<p><a href=\"https://jabet.bsmiab.org/table/178-1647620861-table1/\">Table-1</a><strong>Table 1.</strong> MIC and MBC of MgONPs for <em>Salmonella Typhi</em>.</p>\r\n</div>\r\n\r\n<div id=\"Table-2\">\r\n<p><a href=\"https://jabet.bsmiab.org/table/178-1647620861-table2/\">Table-2</a><strong>Table 2.</strong> Antibiotic susceptibility of <em>Salmonella Typhi</em> by agar well diffusion test.</p>\r\n\r\n<p> </p>\r\n</div>\r\n\r\n<p><a href=\"#Table-2\">Table 2</a> shows the increase of antibiotics concentration led to making bacteria more susceptible to antibiotics, diameter inhibition zone of MgONPs in <em>Salmonella Typhi</em> colonized Petri dish was about 22, 25, 30 and 31 mm from the centre of the inhibition zone (125 µg/ml) as shown in <a href=\"#Table-3\">table 3</a>, while the inhibition zone of CIP with different concentrations (diluted with distilled water) 5mg/ml was 31, 30, 26 and 28 mm in diameter of four isolates of <em>Salmonella Typhi</em>, for the GN 10mg/ml the diameter of inhibition zone was 30, 22, 25 and 25 mm for same isolates.<br />\r\n<a href=\"#Table-3\">Table 3</a> revealed MgONP’s effectiveness in inhibition of <em>Salmonella Typhi</em> growth as many other previous studies [<a href=\"#r-29\">29</a>] which discovered that the MgONPs show the best antimicrobial activity against Bacillus subtilis, <em>Salmonella Typhi</em> (Gram-negative bacteria) and <em>E. coli </em>(Gram-positive bacteria), table 4 show the activity of MgONPs as an antimicrobial agent in combination with GN and CIP antibiotics against <em>Salmonella Typhi.</em><br />\r\nAs shown in <a href=\"#Table-4\">table 4</a> the combination of MgONPs 125 µg/ml + CIP 5mg/ml show inhibition zone as 33, 25, 30 and 25 mm for the 4 <em>Salmonella Typhi</em> isolates, while the combination of MgONPs 125 µg/ml + GN 10 mg/ml show inhibition zone diameter as 25,33, 30 and 31 mm.<br />\r\nThe effect of antimicrobial activity of MgONPs against <em>Salmonella Typhi</em> clearly appears in <a href=\"#figure3\">figure 3</a>, The results reveal that when antibiotics are combined with MgONPs, bacteria become more susceptible. These findings are consistent with those [<a href=\"#r-30\">30</a>] who investigated the same hypothesis. MgONPs showed antibacterial activity against both gram-positive and gram-negative bacteria (<em>Staphylococcus aureus</em> and <em>Escherichia coli</em>, respectively) at a minimal inhibitory concentration. When antibiotics were combined with MgONPs, there was a substantial increase in bacterial sensitivity P ≤ 0.05. Many studies have indicated that the antibacterial mechanism of MgONPs is due to the formation of ROS such as superoxide anion (O2 −) [<a href=\"#r-31\">31</a>]. Some studies reported that the increasement of MgONPs surface area led to increasing of O2 in solution which in its led to increasing damage to the bacterial cell walls [<a href=\"#r-3\">3</a>,<a href=\"#r-32\">32</a>].</p>\r\n\r\n<div id=\"figure3\">\r\n<figure class=\"image\"><img alt=\"\" height=\"445\" src=\"/media/article_images/2023/04/07/178-1647620861-Figure3.jpg\" width=\"500\" />\r\n<figcaption><strong>Figure 3. </strong>Effect of MgONPs with Antibiotics by agar well diffusion test against <em>Salmonella typhi.</em> A: Antibiotics CIP and MgONPs with Antibiotics CIP B: Antibiotics GN and MgONPs with Antibiotics GN, C: MgONPs only.</figcaption>\r\n</figure>\r\n</div>\r\n\r\n<div id=\"Table-3\">\r\n<p><a href=\"https://jabet.bsmiab.org/table/178-1647620861-table3/\">Table-3</a><strong>Table 3. </strong>Antibacterial activity of MgONPs against <em>Salmonella Typhi</em> by agar well diffusion test.</p>\r\n</div>\r\n\r\n<div id=\"Table-4\">\r\n<p><a href=\"https://jabet.bsmiab.org/table/178-1647620861-table4/\">Table-4</a><strong>Table 4.</strong> Combined effect of MgONPs with antibiotic of <em>Salmonella Typhi</em> by agar well diffusion test.</p>\r\n\r\n<p> </p>\r\n</div>\r\n\r\n<p><strong>Effect of MgONPs on cytokines</strong><br />\r\nThe skin test was measured in all the animals that were immunized, and the results were measured and compared to the control group. As shown in <a href=\"#figure4\">figure 4</a>, the induration of skin was higher after 48 hrs. compared with other times. The skin appeared with erythema and induration and necrosis.<br />\r\nA skin test was performed to study the effect of MgONPs on cellular immunity, which erythematic, pus cell, induration and necrosis. The induration diameter of animal groups immunized with MgONPs that synthesis by isolate <em>leuconostic spp</em>. as shown in<a href=\"#Table-5\"> table 5</a> was 1.31 mm after 4 hrs. of immunization, after 24 hrs. of injection, the skin of rabbits immunized with MgONPs showed pus cell and induration diameter was 9.33 mm and showed a significant increase (P≤0.05) when compared to the mean of induration diameter after 4 hrs. Also, results showed after 48 hrs. of injection increases with MgONPs was shown pus cell and necrosis and the mean induration diameter was 11.33 mm and had significant differences when compared to the induration diameter after 24 hr., but after 72 hrs. of injection with MgONPs was shown erythema, pus cell and necrosis and had significantly decreased (P≤0.05) in the mean of induration diameter which reached 8 mm and 8.33 mm compared the mean of induration diameter after 48 hrs.</p>\r\n\r\n<div id=\"figure4\">\r\n<figure class=\"image\"><img alt=\"\" height=\"188\" src=\"/media/article_images/2023/04/07/178-1647620861-Figure4.jpg\" width=\"500\" />\r\n<figcaption><strong>Figure 4. </strong>Skin test of the immunized rabbits (A) as control after 72 hrs, and (B) represented as immunized rabbits with MgONPs after 24 hrs.</figcaption>\r\n</figure>\r\n</div>\r\n\r\n<div id=\"Table-5\">\r\n<p><a href=\"https://jabet.bsmiab.org/table/178-1647620861-table5/\">Table-5</a><strong>Table 5. </strong>Skin sensitivity of the immunized rabbits.</p>\r\n</div>\r\n\r\n<p> </p>\r\n\r\n<p>The results of the production of cytokines were estimated using the equation from the standard curve carried out with the same test. Statistical analysis of IL-1 β, IL-17 and IL-2 showed a mean value (17.700 ± 2.545, 50.310 ± 5.498 and 23.434±2.501) respectively, of the control group when compared to the immunized group with MgONPs the mean value was (82.305±13.38, 101.444±16.943 and 49.781±5.264) respectively, as shown in <a href=\"#Table-6\">table 6</a>.<br />\r\nImmune system drives the specialized immune cells T cells to the skin where they release chemical messengers called lymphokines, which have been sensitized by prior infection. These lymphokines produce induration at and around the injection site (a hard, elevated region with distinct borders) by promoting local vasodilation (increases in blood vessel diameter), producing oedema, fibrin deposition and other types of inflammatory cells [<a href=\"#r-33\">33</a>].</p>\r\n\r\n<div id=\"Table-6\">\r\n<p><a href=\"https://jabet.bsmiab.org/table/178-1647620861-table6/\">Table-6</a><strong>Table 6.</strong> The concentration of IL-1β, IL-17 and IL-2 (pg/ml) in immunized and controlled rabbits. </p>\r\n</div>"
},
{
"section_number": 4,
"section_title": "DISCUSSION",
"body": "<p>The results show that pH 12 was the best pH value gave the maximum MgONPs yield production when measured by spectrophotometer at wavelength 350-450 nm, studies show that the pH value, when drooped to less than 10 show very low concentration of nanoparticles produced by microorganisms and that, occur due to unfavourable condition for bacterial growth which in turn lead to decrease metabolism levels of microorganisms [<a href=\"#r-24\">24</a>]. Hydroxyl group in the surface of nanoparticles in pH 12 (alkaline) permit high absorption by UV light, pH value and many other factors that directly effect on biosynthesis process such as; stability of nanoparticles, chemical structure, application target, etc., these factors play important roles as a reducing agent as enzymes, carbohydrates, proteins and other molecules presents in biomass filtrate which can affect directly on the biosynthesis process [<a href=\"#r-26\">26</a>].<br />\r\nThe results of antimicrobial activity revealed that when antibiotics are combined with MgONPs, bacteria become more susceptible. These findings are consistent with those [<a href=\"#r-30\">30</a>] who investigated the same hypothesis. MgONPs showed antibacterial activity against both gram-positive and gram-negative bacteria (Staphylococcus aureus and Escherichia coli, respectively) at a minimal inhibitory concentration. When antibiotics were combined with MgONPs, there was a substantial increase in bacterial sensitivity P≤0.05. Many studies have indicated that the antibacterial mechanism of MgONPs is due to the formation of ROS such as superoxide anion (O2 −) [<a href=\"#r-31\">31</a>]. Some studies reported that the increasement of MgONPs surface area led to increasing of O2 in solution which in its led to increasing damage to bacterial cell walls [<a href=\"#r-3\">3</a>,<a href=\"#r-32\">32</a>].<br />\r\nThe results of the skin test revealed that the DTH for the skin used as the indicator of cellular immunity in rabbits immunized by the different kinds of Salmonella antigens revealed a substantial increase in inoculated animals. Testing of the final result. Parallel with [<a href=\"#r-34\">34</a>], who found that after 24 hours the skin response was higher [<a href=\"#r-35\">35,36</a>]. The DTH response is characterized as a remembrance or T-cell reaction because it needs a certain antigen to be prematurely immunological responsive [<a href=\"#r-31\">31,35</a>]. It can detect some antigens which have been already known to respond to immunity, providing an indicator for T-cells’ activity to recall antibodies. The major responses for DTH are human neutrophils, followed by fusion of mononuclear cells made up of macrophages and T cells, whereas the mouse reacts highly to DTH antigens in mice [<a href=\"#r-36\">36,37</a>].<br />\r\nResults found by this study agree with the previous study Delay-type Hypersensitivity DTH was induced by induction of pro-inflammatory cytokines through Th1 responses by AgNPs in rabbits [<a href=\"#r-37\">37</a>]. Lubberts (2015) referred that the diameter of the inflamed area of injected rabbits with the antigens after 4, 24, 48 and 72 hours show a significant increase in contrast to the control group (at P-value ≤ 0.05), these results refer that the 3 antigens types inducing the Delay-Type Hypersensitivity DTH which belong to IV type of hypersensitivities which act as a result from T-cells inflammation activity where antibodies not involved [38]. The inflammation response results from T-cell reacting and responding to antigens, soluble molecules play important role in clinical immunology as a group, then microphage digest or separate those soluble molecules to their precursors and detect the components to stimulate immune chemical signals to communicate with other cells, chemokines considered cytokines that induce leukocyte hemotoxins, there are several other stimulating activities initiated along with cytokines. The other function of interleukin’s IL-1β, IL-2 and IL-17 is the enhancement of immunological response, inducing T and B cells that were susceptible to IL-1β, while IL-2 was largely involved with lymphocytes [<a href=\"#r-38\">38,39</a>], IL-17 is a pleiotropic cytokine that plays a crucial role in establishing autoimmune disease, IL-17 also enhance the fatality immune interaction via recruitment of inflammatory cells like neutrophils, T-cells and dendritic cells, on the other hand, this excessive elimination of immune cells activity to their target in the chronic inflammatory reaction is a harmful and may lead to autoimmune disease, therefore the high regulation roles is mandatory for immunological homeostasis maintenance [<a href=\"#r-40\">40</a>].<br />\r\nCarol and his colleagues (2008) demonstrated that a significant inflammatory response has been observed in the release of IL-1β after 24 hours of exposure to 15 nm of nanoparticles, and IL-1β was the most intermediates of fever and other symptoms appearance which raise as a response to illness since that the macrophages stimulated by lipopolysaccharides to release [<a href=\"#r-41\">41,42</a>]. Metal nanoparticles influence immunological activities as same as protein antigens but with different immune response pathways [<a href=\"#r-42\">42</a>]. Virus-like nanoparticles (VLN) are molecules that resembled viruses but are non-infectious due to a lack of viral genetic materials, VLN can naturally synthesize by individual expression of viral capsid proteins, or from different or combinations of different capsid proteins viruses to create recombinant VLN [43,44]. VLN co-expressed IL-2 with many different anchors of membrane receptors, C-terminus of IL-2 fuse with glycosylphosphatidylinositol anchors receptors with 2 immunological-like domain structures of CD16 which lead to stimulation of T-cells and inducing the CD8 and T-cells effect in vivo [<a href=\"#r-45\">45</a>]. The majority of antigen-specific T-cells react with IL-2 to liposomes after each dose injected, the repeating process increase T-cells toxicity by increasing activation and proliferation of T-cells [<a href=\"#r-46\">46,47</a>].</p>"
},
{
"section_number": 5,
"section_title": "CONCLUSIONS",
"body": "<p>From the results obtained, the use of <em>Leuconostoc</em> spp. for the biosynthesis of MgONPs is an effective and low-cost method. In addition, it can be used this nanoparticle as an anti-bacterial and anti-biofilm produced by bacteria, indicating the possibility of using them in both medical and non-medical applications, especially when in combination between these nanoparticles and antibiotics. When studying the skin test after injection with nanoparticles to laboratory animals, the skin response was high, and this indicates the activity of T cells stimulating antibodies. Also, measuring the level of cytokines after the injection led to an increase in DTH, which in turn leads to a harmful inflammatory reaction that leads to autoimmune diseases.</p>"
},
{
"section_number": 6,
"section_title": "ACKNOWLEDGEMENT",
"body": "<p>The authors would like to thank Dr Yasir Al-Mawlah (DNA Research Center / University of Babylon) Pune for their kind support during this work and for providing us the lab facilities to make this work accomplished.</p>"
},
{
"section_number": 7,
"section_title": "AUTHOR CONTRIBUTIONS",
"body": "<p>Conception and design of study: FrialAbd and Lubna Albayati. Drafting the manuscript: Duaa Hassan and FrialAbd. Analysis and/or interpretation of data: Duaa Hassan and Lubna Albayati.</p>"
},
{
"section_number": 8,
"section_title": "CONFLICTS OF INTEREST",
"body": "<p>There is no conflict of interest among the authors.</p>"
}
],
"figures": [
{
"figure": "https://jabet.bsmiab.org/media/article_images/2023/04/07/178-1647620861-Figure1.jpg",
"caption": "Figure 1. Different pH values to detect the best pH for Leuconostoc spp. for MgONPs synthesis.",
"featured": false
},
{
"figure": "https://jabet.bsmiab.org/media/article_images/2023/04/07/178-1647620861-Figure2.jpg",
"caption": "Figure 2. The production of MgONPs that synthesis by isolating Leuconostoc spp. in different concentrations of salt.",
"featured": false
},
{
"figure": "https://jabet.bsmiab.org/media/article_images/2023/04/07/178-1647620861-Figure3.jpg",
"caption": "Figure 3. Effect of MgONPs with Antibiotics by agar well diffusion test against Salmonella typhi. A: Antibiotics CIP and MgONPs with Antibiotics CIP B: Antibiotics GN and MgONPs with Antibiotics GN, C: MgONPs only.",
"featured": false
},
{
"figure": "https://jabet.bsmiab.org/media/article_images/2023/04/07/178-1647620861-Figure4.jpg",
"caption": "Figure 4. Skin test of the immunized rabbits (A) as control after 72 hrs, and (B) represented as immunized rabbits with MgONPs after 24 hrs.",
"featured": false
}
],
"authors": [
{
"id": 317,
"affiliation": [
{
"affiliation": "Al-Furat Al-Awsat Technical University, Babylon Institute, Medicine Laboratory, Hillah, Iraq"
}
],
"first_name": "Duaa",
"family_name": "Hassan",
"email": null,
"author_order": 1,
"ORCID": "http://orcid.org/0000-0002-1240-9829",
"corresponding": false,
"co_first_author": false,
"co_author": false,
"corresponding_author_info": "",
"article": 84
},
{
"id": 318,
"affiliation": [
{
"affiliation": "Biology Department, College of Sciences, University of Babylon, Babylon, Hillah, Iraq"
}
],
"first_name": "Frial",
"family_name": "Abd",
"email": null,
"author_order": 2,
"ORCID": "http://orcid.org/0000-0002-5188-0656",
"corresponding": false,
"co_first_author": false,
"co_author": false,
"corresponding_author_info": "",
"article": 84
},
{
"id": 319,
"affiliation": [
{
"affiliation": "DNA Research Center, University of Babylon, Babylon, Hillah, Iraq"
}
],
"first_name": "Lubna",
"family_name": "Albayati",
"email": "albayatilubna@yahoo.com",
"author_order": 3,
"ORCID": null,
"corresponding": true,
"co_first_author": false,
"co_author": false,
"corresponding_author_info": "Lubna Albayati, PhD; DNA Research Center, University of Babylon, Babylon, Hillah, Iraq, e-mail: albayatilubna@yahoo.com",
"article": 84
}
],
"views": 632,
"downloads": 94,
"references": [
{
"id": 2412,
"serial_number": 1,
"pmc": null,
"reference": "Rajagopalan S, Koper O, Decker S, Klabunde KJ. Nanocrystalline metal oxides as destructive adsorbents for organophosphorus compounds at ambient temperatures. Chemistry – A European Journal. 2002; 8(11):2602-2607.",
"DOI": null,
"article": 84
},
{
"id": 2413,
"serial_number": 2,
"pmc": null,
"reference": "Obeid MM, Jappor HR, Al-Marzoki K, Al-Hydary IA, Edrees SJ, Shukur MM. Unraveling the effect of Gd doping on the structural, optical, and magnetic properties of ZnO based diluted magnetic semiconductor nanorods. RSC Advances. 2019; 9: 33207-33221.",
"DOI": null,
"article": 84
},
{
"id": 2414,
"serial_number": 3,
"pmc": null,
"reference": "Huang L, Li DQ, Lin YJ, Wei M, Evans DG, Duan X. Controllable preparation of Nano-MgO and investigation of its bactericidal properties. Journal of Inorganic Biochemistry. 2005;99(5): 986-993.",
"DOI": null,
"article": 84
},
{
"id": 2415,
"serial_number": 4,
"pmc": null,
"reference": "Zhang Y, Ma M, Zhang X, Wang B, Liu R. Synthesis, characterization, and catalytic property of nanosized MgO flakes with different shapes. Journal of Alloys and Compounds. 2014;590.",
"DOI": null,
"article": 84
},
{
"id": 2416,
"serial_number": 5,
"pmc": null,
"reference": "Khan A, Shabir D, Ahmad P, Khandaker MU, Faruque MRI, Din IU. Biosynthesis and antibacterial activity of MgO-NPs produced from Camellia-sinensis leaves extract. Materials Research Express. 2021; 8 (2021) 015402.",
"DOI": null,
"article": 84
},
{
"id": 2417,
"serial_number": 6,
"pmc": null,
"reference": "Tang ZX, Lv BF. MgO nanoparticles as antibacterial agent: Preparation and activity. Brazilian Journal of Chemical Engineering. 2014;31(3).",
"DOI": null,
"article": 84
},
{
"id": 2418,
"serial_number": 7,
"pmc": null,
"reference": "Xu Y, Tang H, Liu JH, Wang H, Liu Y. Evaluation of the adjuvant effect of silver nanoparticles both in vitro and in vivo. Toxicology Letters. 2013;219(1).",
"DOI": null,
"article": 84
},
{
"id": 2419,
"serial_number": 8,
"pmc": null,
"reference": "Hussain S, Vanoirbeek JAJ, Hoet PHM. Interactions of nanomaterials with the immune system. Wiley Interdiscip Rev Nanomed Nanobiotechnol. 2012;4(2):169-83.",
"DOI": null,
"article": 84
},
{
"id": 2420,
"serial_number": 9,
"pmc": null,
"reference": "Duque GA, Descoteaux A. Macrophage cytokines: Involvement in immunity and infectious diseases. Vol. 5, Frontiers in Immunology. 2014.",
"DOI": null,
"article": 84
},
{
"id": 2421,
"serial_number": 10,
"pmc": null,
"reference": "Simpson S, Kaislasuo J, Guller S, Pal L. Thermal stability of cytokines: A review. Vol. 125, Cytokine. 2020.",
"DOI": null,
"article": 84
},
{
"id": 2422,
"serial_number": 11,
"pmc": null,
"reference": "Dwivedi PD, Tripathi A, Ansari KM, Shanker R, Das M. Impact of nanoparticles on the immune system. Journal of Biomedical Nanotechnology. 2011;7(1).",
"DOI": null,
"article": 84
},
{
"id": 2423,
"serial_number": 12,
"pmc": null,
"reference": "Sester DP, Thygesen SJ, Sagulenko V, Vajjhala PR, Cridland JA, Vitak N, Chen KW, Osborne GW, Schroder K, Stacey KJ. A novel flow cytometric method to assess inflammasome formation. The Journal of Immunology. 2015;194(1).",
"DOI": null,
"article": 84
},
{
"id": 2424,
"serial_number": 13,
"pmc": null,
"reference": "Meunier E, Coste A, Olagnier D, Authier H, Lefèvre L, Dardenne C, Bernad J, Béraud M, Flahaut E, Pipy B. Double-walled carbon nanotubes trigger IL-1β release in human monocytes through Nlrp3 inflammasome activation. Nanomedicine: Nanotechnology, Biology and Medicine. 2012 Aug 1;8(6):987–95.",
"DOI": null,
"article": 84
},
{
"id": 2425,
"serial_number": 14,
"pmc": null,
"reference": "Camacho AI, de Souza J, Sánchez-Gómez S, Pardo-Ros M, Irache JM, Gamazo C. Mucosal immunization with Shigella flexneri outer membrane vesicles induced protection in mice. Vaccine. 2011;29(46).",
"DOI": null,
"article": 84
},
{
"id": 2426,
"serial_number": 15,
"pmc": null,
"reference": "Hasan D, Gameel F, Abdulazeez L. Biosynthesis Method and Characterization of MgO Nanoparticles by Using Local Leuconostoc spp. Isolate. [Internet]. Annals of the Romanian Society for Cell Biology. 2021 [cited 2022 Mar 4]. p. 9072–7.",
"DOI": null,
"article": 84
},
{
"id": 2427,
"serial_number": 16,
"pmc": null,
"reference": "Naghsh N, Kazemi S. Effect of nano-magnesium oxide on glucose concentration and lipid profile in diabetic laboratory mice. Iranian Journal of Pharmaceutical Sciences. 2014;10(3).",
"DOI": null,
"article": 84
},
{
"id": 2428,
"serial_number": 17,
"pmc": null,
"reference": "Mohanasrinivasan V, Subathra Devi C, Mehra A, Prakash S, Agarwal A, Selvarajan E, Jemimah Naine S. Biosynthesis of MgO Nanoparticles Using Lactobacillus Sp. and its Activity Against Human Leukemia Cell Lines HL-60. Bionanoscience. 2018;8(1).",
"DOI": null,
"article": 84
},
{
"id": 2429,
"serial_number": 18,
"pmc": null,
"reference": "John Sushma N, Prathyusha D, Swathi G, Madhavi T, Deva Prasad Raju B, Mallikarjuna K, Kim HS. Facile approach to synthesize magnesium oxide nanoparticles by using Clitoria ternatea—characterization and in vitro antioxidant studies. Applied Nanoscience (Switzerland). 2016;6(3).",
"DOI": null,
"article": 84
},
{
"id": 2430,
"serial_number": 19,
"pmc": null,
"reference": "Abdulazeem L, Alasadi YF, Al-Mawlah YH, M. Hadi A. A Mini review: Silver Nanoparticles (AgNPs) as Antimicrobial in Magical Socks. Journal of Pharmaceutical Research International. 2021 Nov 20;33(51):23–32.",
"DOI": null,
"article": 84
},
{
"id": 2431,
"serial_number": 20,
"pmc": null,
"reference": "Lubna Abdulazeem, Nashwan M. AL-Gburi, Mohammad Dyia, Yasir H. Al-Mawlah, Ahamed H. Rasheed. Antimicrobial resistance profiles of bacteria isolated from poultry droppings and treated by AgNPs green synthesis from Thymus kotschyanus. Plant Archives. 2020 Oct 10;20(2):5973–9.",
"DOI": null,
"article": 84
},
{
"id": 2432,
"serial_number": 21,
"pmc": null,
"reference": "Schneider E, Völcker C, Haude W. Age and sex dependence of phospholipid concentrations in human erythrocytes. Z Med Lab Diagn. 1990; 31(2):85-89",
"DOI": null,
"article": 84
},
{
"id": 2433,
"serial_number": 22,
"pmc": null,
"reference": "Ramesh Krishnan, Vijay Arumugam, Suresh Kumar Vasaviah. The MIC and MBC of Silver Nanoparticles against Enterococcus faecalis – A Facultative Anaerobe. Journal of Nanomedicine & Nanotechnology. 2015, 06(03).",
"DOI": null,
"article": 84
},
{
"id": 2434,
"serial_number": 23,
"pmc": null,
"reference": "Okoli AS, Iroegbu CU. Evaluation of extracts of Anthocleista djalonensis, Nauclea latifolia and Uvaria afzalii for activity against bacterial isolates from cases of non-gonococcal urethritis. Journal of Ethnopharmacology. 2004;92(1).",
"DOI": null,
"article": 84
},
{
"id": 2435,
"serial_number": 24,
"pmc": null,
"reference": "James S. Lewis II. Performance Standards for Antimicrobial Susceptibility Testing Performance Standards for Antimicrobial Susceptibility Testing Suggested Citation. CLSI document M02-A11. 2018;",
"DOI": null,
"article": 84
},
{
"id": 2436,
"serial_number": 25,
"pmc": null,
"reference": "George D, Mallery P. SPSS for Windows Step by Step: Answers to Selected Exercises. A Simple Guide and Reference. 2003.",
"DOI": null,
"article": 84
},
{
"id": 2437,
"serial_number": 26,
"pmc": null,
"reference": "Patra JK, Baek KH. Green Nanobiotechnology: Factors Affecting Synthesis and Characterization Techniques. Vol. 2014, Journal of Nanomaterials. 2014.",
"DOI": null,
"article": 84
},
{
"id": 2438,
"serial_number": 27,
"pmc": null,
"reference": "Haghshenas L, Amini A, Bashir Bahati A, Rahimi G. In vitro Antibacterial Biofilm effect of Magnesium Oxide Nanoparticles on Streptococcus mutans. Micro & Nano Biomedicine. 2016;1(1).",
"DOI": null,
"article": 84
},
{
"id": 2439,
"serial_number": 28,
"pmc": null,
"reference": "Strindelius L, Wikingsson LD, Sjöholm I. Extracellular antigens from Salmonella enteritidis induce effective immune response in mice after oral vaccination. Infection and Immunity. 2002;70(3).",
"DOI": null,
"article": 84
},
{
"id": 2440,
"serial_number": 29,
"pmc": null,
"reference": "Fouda A, Hassan SED, Abdel-Rahman MA, Farag MMS, Shehal-deen A, Mohamed AA, Alsharif SM, Saied E, Moghanim SA, Azab MS. Catalytic degradation of wastewater from the textile and tannery industries by green synthesized hematite (α-Fe2O3) and magnesium oxide (MgO) nanoparticles. Current Research in Biotechnology. 2021;3.",
"DOI": null,
"article": 84
},
{
"id": 2441,
"serial_number": 30,
"pmc": null,
"reference": "Imani MM, Safaei M. Optimized Synthesis of Magnesium Oxide Nanoparticles as Bactericidal Agents. Journal of Nanotechnology. 2019;2019.",
"DOI": null,
"article": 84
},
{
"id": 2442,
"serial_number": 31,
"pmc": null,
"reference": "Hayat S, Muzammil S, Rasool MH, Nisar Z, Hussain SZ, Sabri AN, Jamil S. In vitro antibiofilm and anti-adhesion effects of magnesium oxide nanoparticles against antibiotic resistant bacteria. Microbiology and Immunology. 2018;62(4).",
"DOI": null,
"article": 84
},
{
"id": 2443,
"serial_number": 32,
"pmc": null,
"reference": "Verma A, Mehata MS. Controllable synthesis of silver nanoparticles using Neem leaves and their antimicrobial activity. Journal of Radiation Research and Applied Sciences. 2016;9(1).",
"DOI": null,
"article": 84
},
{
"id": 2444,
"serial_number": 33,
"pmc": null,
"reference": "Creusot RJ, Mitchison NA. How DCs control cross-regulation between lymphocytes. Trends in Immunology. 2004;25(3).",
"DOI": null,
"article": 84
},
{
"id": 2445,
"serial_number": 34,
"pmc": null,
"reference": "Flemming HC, Wingender J. The biofilm matrix. Vol. 8, Nature Reviews Microbiology. 2010.",
"DOI": null,
"article": 84
},
{
"id": 2446,
"serial_number": 35,
"pmc": null,
"reference": "Shkodenko L, Kassirov I, Koshel E. Metal oxide nanoparticles against bacterial biofilms: Perspectives and limitations. Vol. 8, Microorganisms. 2020.",
"DOI": null,
"article": 84
},
{
"id": 2447,
"serial_number": 36,
"pmc": null,
"reference": "Jin T, He Y. Antibacterial activities of magnesium oxide (MgO) nanoparticles against foodborne pathogens. Journal of Nanoparticle Research. 2011;13(12).",
"DOI": null,
"article": 84
},
{
"id": 2448,
"serial_number": 37,
"pmc": null,
"reference": "Raheem H, Althahab A, Jameel F. Immunological Study of Silver Nanoparticles Produced from Proteus mirabilis in Rabbit. Al-Kufa University Journal for Biology. 2016, 8(2): 177–187.",
"DOI": null,
"article": 84
},
{
"id": 2449,
"serial_number": 38,
"pmc": null,
"reference": "Lubberts E. The IL-23-IL-17 axis in inflammatory arthritis. Nat Rev Rheumatol [Internet]. 2015 Jul 30 [cited 2022 Mar 4];11(7):415–29. Available from: https://pubmed.ncbi.nlm.nih.gov/25907700/",
"DOI": null,
"article": 84
},
{
"id": 2450,
"serial_number": 39,
"pmc": null,
"reference": "Zwicky P, Unger S, Becher B. Targeting interleukin-17 in chronic inflammatory disease: A clinical perspective. Journal of Experimental Medicine. 2020;217(1).",
"DOI": null,
"article": 84
},
{
"id": 2451,
"serial_number": 40,
"pmc": null,
"reference": "Carlson C, Hussein SM, Schrand AM, Braydich-Stolle LK, Hess KL, Jones RL, Schlager JJ. Unique cellular interaction of silver nanoparticles: Size-dependent generation of reactive oxygen species. Journal of Physical Chemistry B. 2008;112(43): 13608–13619",
"DOI": null,
"article": 84
},
{
"id": 2452,
"serial_number": 41,
"pmc": null,
"reference": "Kozak W, Kluger MJ, Tesfaigzi J, Kozak A, Mayfield KP, Wachulec M, Dokladny K. Molecular mechanisms of fever and endogenous antipyresis. Annals of the New York Academy of Sciences. 2000;917: 121-134.",
"DOI": null,
"article": 84
},
{
"id": 2453,
"serial_number": 42,
"pmc": null,
"reference": "Zampronio AR, Melo MCC, Hopkins SJ, Souza GEP. Involvement of CRH in fever induced by a distinct pre-formed pyrogenic factor (PFPF). Inflamm Res. 2000; 49(9):473–479.",
"DOI": null,
"article": 84
},
{
"id": 2454,
"serial_number": 43,
"pmc": null,
"reference": "Wojta-Stremayr D, Neunkirchner A, Srinivasan B, Trapin D, Schmetterer KG, Pickl WF. CD8+T cell fate and function influenced by antigen-specific virus-like nanoparticles co-expressing membrane tethered IL-2. PLoS ONE. 2015;10(5).",
"DOI": null,
"article": 84
},
{
"id": 2455,
"serial_number": 44,
"pmc": null,
"reference": "Zeltins A. Construction and characterization of virus-like particles: A review. Vol. 53, Molecular Biotechnology. Molecular Biotechnology 2013; 53: 92–107.",
"DOI": null,
"article": 84
},
{
"id": 2456,
"serial_number": 45,
"pmc": null,
"reference": "Zheng Y, Stephan MT, Gai SA, Abraham W, Shearer A, Irvine DJ. In vivo targeting of adoptively transferred T-cells with antibody- and cytokine-conjugated liposomes. Journal of Controlled Release. 2013;172(2).",
"DOI": null,
"article": 84
},
{
"id": 2457,
"serial_number": 46,
"pmc": null,
"reference": "Frick SU, Domogalla MP, Baier G, Wurm FR, Mailänder V, Landfester K, Steinbrink K. Interleukin-2 functionalized nanocapsules for T cell-based immunotherapy. ACS Nano. 2016;10(10).",
"DOI": null,
"article": 84
},
{
"id": 2458,
"serial_number": 46,
"pmc": null,
"reference": "Raheem HQ, Almawla YH. Silver nanoparticles as antibacterial action against pseudomonas fluorescens isolated from burn infection. Annals of the Romanian Society for Cell Biology, 12578–12583.",
"DOI": null,
"article": 84
}
]
},
{
"id": 81,
"slug": "178-1646022244-htra1-and-htra2-expression-differentially-modulate-the-clinical-prognosis-of-cancer-a-multi-omics-analysis-using-bioinformatics-approaches",
"featured": false,
"slider": false,
"issue": "Vol5 Issue2",
"type": "original_article",
"manuscript_id": "178-1646022244",
"recieved": "2022-03-01",
"revised": null,
"accepted": "2022-04-14",
"published": "2022-04-17",
"pdf_file": "https://jabet.bsmiab.org/media/pdf_file/2023/15/178-1646022244.pdf",
"title": "HTRA1 and HTRA2 expression differentially modulate the clinical prognosis of cancer: a multi-omics analysis using bioinformatics approaches",
"abstract": "<p>Globally the most common cause of human death is cancer. But still, all information is unavailable to detect cancer in the early stage, and the relation of groups of the gene with cancer has to explore. <em>HTRA</em> serine proteases facilitate cellular homeostasis. Oncogenesis and response to treatment have been connected to their dysfunction in several typical human tissues. The present study aimed to assess the expression pattern of <em>HTRA1</em> and <em>HTRA2</em> in different cancers and evaluate the prognostic outcome in cancer. Various bioinformatics databases and methodologies are used in this study, including Oncomine, Kaplan-Meier plotter, OncoLnc, R2 platform, PrognoScan databases, GEPIA, cBioPortal, STRING, KEGG, and Reactome pathways analyses. The expression of <em>HTRA1</em> and <em>HTRA2</em> was analyzed, and different web-based bioinformatics platforms were used to determine their functional protein partners and correlated genes. Moreover, the cross-cancer interaction between <em>HTRA1</em> and <em>HTRA2</em> with mutations and CNAs was explored. GO and pathway analysis was used to assess the impact of these associated characteristics on certain cancers. In prognosis analysis, a positive correlation was found between <em>HTRA1</em> overexpression and poor prognosis in pancreatic, kidney, colon, and rectum cancer. A significant positive relationship between <em>HTRA2</em> overexpression and poor survival was found in pancreatic, skin, and colon cancer patients. We found that <em>HTRA1</em> in individuals with pancreatic, kidney, and colon cancers might be targeted for cancer therapy, and <em>HTRA2</em> could be used as a prognostic biomarker for skin, pancreatic, and colon cancers. Meantime, both genes might be possible targets for colon and pancreatic cancer.</p>",
"journal_reference": "J Adv Biotechnol Exp Ther. 2022; 5(2): 358-380.",
"academic_editor": "Md Jamal Uddin, PhD; Ewha Womans University, Seoul, South Korea",
"cite_info": "Reza A, Tarik MTE, et al. HTRA1 and HTRA2 expression differentially modulate the clinical prognosis of cancer: a multi-omics analysis using bioinformatics approaches. J Adv Biotechnol Exp Ther. 2022; 5(2): 358-380.",
"keywords": [
"Mutation",
"Bioinformatics",
"mRNA",
"Multiomics",
"HTRA",
"Cancer Therapy",
"Cancer",
"Survival",
"Prognostic Biomarkers"
],
"DOI": "10.5455/jabet.2022.d121",
"sections": [
{
"section_number": 1,
"section_title": "INTRODUCTION",
"body": "<p>Cancer is a disorder characterized by irregular cell growth that leads to abnormal cells spreading to other body areas [<a href=\"#r-1\">1</a>]. Chemical and physical carcinogens present in our environment and found in various occupations cause DNA damage, leading to unregulated cell division and finally developing into cancer. Cancer has become the most common cause of human death worldwide [<a href=\"#r-2\">2,3</a>]. According to an estimate, cancer accounts for about one of every six deaths, making it the second most prevalent cause of human death worldwide.<br />\r\nHowever, cancer is still causing many deaths; the number of survivors increases because of advances in early detection and treatment [<a href=\"#r-4\">4</a>]. But there is no specific treatment to cure all types of cancer. It could be an effective solution to lowering the health risk of cancer if we found a curative agent [<a href=\"#r-5\">5,6</a>]. There are several characteristics of cancer cells. One of the main characteristics is that cancer cells’ metabolism has changed compared to normal cells [<a href=\"#r-7\">7,8</a>]. These metabolic changes are referred to as cancer metabolism, and they help cancer cells acquire and retain their malignant properties [<a href=\"#r-9\">9,10</a>]. Alteration in enzyme expression is a natural phenomenon among these different metabolic changes, and sometimes the genes related to metabolic pathways also change in the tumor cell. Several factors affect the alteration in enzyme expression, namely gene amplification, insertion, or deletion, and environmental factors such as epigenetic changes in the gene. Apart from the underlying mechanisms, changes in basal enzymatic activity led to potential susceptibilities targeted for cancer treatment [<a href=\"#r-11\">11–13</a>].<br />\r\nThe high-temperature requirement A (<em>HTRA</em>) protein family consists of serine proteases involved in various physiological activities, namely mitochondrial homeostasis, cell death, and cell signaling [<a href=\"#r-14\">14</a>]. Several studies have shown the involvement of <em>HTRA</em> in the development of cancer and neurodegenerative disorders [<a href=\"#r-15\">15,16</a>]. As a result, the <em>HTRA</em> family is becoming potential targets for cancer treatment. In humans, the <em>HTRA</em> serine protease family consists of four members: <em>HTRA1</em>, <em>HTRA2</em>, <em>HTRA3</em>, and <em>HTRA4</em> [<a href=\"http://#r-17\">17</a>].</p>\r\n\r\n<p><em>HTRA1</em> is located on the long (q) arm of human chromosome 10 in a region known as 10q26.2 [<a href=\"#r-18\">18</a>]. In the amino-terminus end of <em>HTRA1</em> serine protease, a Kazal motif, a localization sequence, and an IGFBP domain are present. In contrast, at the carboxy-terminus, a PDZ (an acronym made out of the first letters of the first three proteins identified to have the same domain such as postsynaptic density protein, Drosophila disc large tumor suppressor, and zonula occludens-1 protein) domain, and a serine protease domain is present [<a href=\"#r-19\">19</a>]. According to many findings, the <em>HTRA1</em> gene has a role in suppressing tumors, and it activates apoptosis. Under expression of <em>HTRA1</em> helps cancer cell survival, facilitating tumor proliferation, malignancy, and metastasis [<a href=\"#r-20\">20</a>]. The <em>HTRA1</em> gene is significantly downregulated in metastatic melanoma, brain, breast, ovarian, and liver cancer [<a href=\"#r-21\">21,22</a>].<br />\r\nOn the contrary, <em>HTRA2</em> is located on the short (p) arm of chromosome 2 in a locus known as 2p13.1 [<a href=\"http://#r-23\">23</a>]. In the amino-terminus end of <em>HTRA2</em>, a mitochondrial targeting signal, the alpha-helix domain of a transmembrane protein, an IBM (IAP/inhibitor of apoptosis protein-binding motif), and a serine protease domain is present, while at the carboxy-terminus, a PDZ domain present [<a href=\"http://#r-15\">15</a><a href=\"#r-15\">,19</a>]. There are many examples of the role of <em>HTRA2</em> in oncogenesis. <em>HTRA2</em> is commonly expressed in several cell lines of cancer [<a href=\"http://#r-22\">22</a>]. Previous studies have shown that <em>HTRA2</em> has an involvement with cancer development [19,24]. <em>HTRA2</em> is significantly downregulated in endometrial cancer tissues while upregulated in prostate cancer tissue compared to normal tissues [<a href=\"#r-25\">25- 26</a>]. <em>HTRA2</em> was also upregulated in gastric cancer relative to normal gastric mucosal cells [<a href=\"#r-27\">27</a>].<br />\r\nPrevious studies have discussed the two genes separately, albeit to a lesser extent. In this study, we would like to analyze two genes involved in many possible cancers. This research aimed to determine the expression pattern of <em>HTRA1</em> and <em>HTRA2</em> to assess their prognostic value in different types of human cancer. Using many online bioinformatics tools and resources, we investigate the expression of <em>HTRA1</em> and <em>HTRA2</em> and their prognostic effects in various cancers. We systematically analyzed the expression of <em>HTRA1</em> and <em>HTRA2</em> and their prognostic importance, methylation of promoters, mutation status, and co-expressed genes. We also studied the gene ontology and signal transduction pathways of genes associated with <em>HTRA1</em> and <em>HTRA2</em>. Analysis of copy number alterations was also conducted systemically. Hence, these comprehensive studies finally determined whether the expression pattern of <em>HTRA1</em> and <em>HTRA2</em> can be employed as a prognostic biomarker of cancer.</p>"
},
{
"section_number": 2,
"section_title": "METHODS AND MATERIALS",
"body": "<p><strong>Analysis of mRNA expression through Oncomine</strong><br />\r\nWe obtained the expression of <em>HTRA1</em> and <em>HTRA2</em> for various forms of cancer utilizing Oncomine online databases (<a href=\"https://www.oncomine.org/\">https://www.oncomine.org/</a>) [<a href=\"#r-28\">28,29</a>]. This platform has a broad range of separate data sets and thoughtfully organized data. Using the default settings for different filter classes, the query was performed with the threshold parameters of 10%, 2, and 0.01 for gene ranking, fold-change, and p-value,</p>\r\n\r\n<p>respectively.</p>\r\n\r\n<p><strong>Analysis of mRNA transcript through GEPIA</strong><br />\r\nGene Expression Profiling Interactive Analysis (GEPIA) is an online (<a href=\"http://gepia.cancer-pku.cn/\">http://gepia.cancer-pku.cn/</a>) interactive and well-organized tool for analyzing mRNA expression through RNA sequencing data [<a href=\"#r-30\">30,31</a>]. It promises access to a wide array of data from the Cancer Genome Atlas (TCGA) and the Genotype-Tissue Expression (GTEx) project. This database offers boxplots for studying transcript expression analysis of <em>HTRA1</em> and <em>HTRA2</em> in various cancer types. These expression patterns were used primarily to cross-check the findings obtained from the Oncomine network</p>\r\n\r\n<p> </p>\r\n\r\n<p><strong>Promoter methylation analysis using UALCAN</strong><br />\r\nUALCAN (<a href=\"http://ualcan.path.uab.edu/analysis.html\">http://ualcan.path.uab.edu/analysis.html</a>) is an extensive, freely accessible, and responsive online-based platform exploring cancer data [<a href=\"#r-32\">32</a>]. This platform generates graphs and plots showing the expression pattern, patient survival, and promoter methylation of target genes. We used the UALCAN data to investigate the promoter methylation of <em>HTRA1</em> and <em>HTRA2</em> genes.</p>\r\n\r\n<p> </p>\r\n\r\n<p><strong>Analysis of protein-protein interaction (PPI) network using STRING</strong><br />\r\nSearch Tool for the Retrieval of Interacting Genes/Proteins (STRING) (<a href=\"https://string-db.org/\">https://string-db.org/</a>) is an online platform that supplies information about predictable gene function and protein-protein interaction [<a href=\"http://#r-33\">33,34</a>]. It analyzes gene entries and rates them based on functional assessments. It includes a broad collection of data on functional correlation, including exchanges of proteins and genes, pathways, and data on co-expression. This database comes up with 24,584,628 proteins of 5,090 species. The PPI network was constructed utilizing both proven and predicted correlations, with no network clustering through STRING.</p>\r\n\r\n<p> </p>\r\n\r\n<p><strong>Gene expression, mutation, and copy number alterations (CNAs) through cBioPortal</strong><br />\r\nThe cBioPortal (<a href=\"https://www.cbioportal.org/\">https://www.cbioportal.org</a>/) is an interactive online database designed for visualizing and analyzing TCGA and Pan-Cancer datasets [<a href=\"#r-35\">35,36</a>]. In this analysis, cBioPortal was implemented with proper parameter settings to evaluate the mutation status and copy number alterations of <em>HTRA1</em> and <em>HTRA2</em>. Besides, we also investigated the copy number alterations for both genes and genes that correlated with them, using the OncoPrint feature.</p>\r\n\r\n<p> </p>\r\n\r\n<p><strong>Analysis of survival through Kaplan-Meier plotter</strong><br />\r\nAn online platform, Kaplan-Meier plotter (<a href=\"http://kmplot.com/analysis/\">http://kmplot.com/analysis/</a>), allows us to analyze the patient survival of different cancer types [<a href=\"#r-37\">37</a>]. It helps to investigate the survival effect of over 54,000 genes in 21 types of cancer, including breast, ovarian, lung, and gastric cancer. We used this tool to examine the relationships between gene expression and survival patterns with cancers of interest in this analysis.</p>\r\n\r\n<p> </p>\r\n\r\n<p><strong>Analysis of cancer prognosis using PrognoScan</strong><br />\r\nPrognoScan (<a href=\"http://www.prognoscan.org/\">http://www.prognoscan.org/</a>) is a newly developed meta-analyzing database to evaluate the patient prognosis of various genes [<a href=\"http://#r-38\">http://#r-38</a>38]. This online platform investigates the link between transcript expression and prognostic value through many tumor microarrays. The survival and prognostic importance of the <em>HTRA1</em> and <em>HTRA2</em> genes are determined through PrognoScan. The Cox p-value <0.05 was considered significant for this analysis.</p>\r\n\r\n<p> </p>\r\n\r\n<p><strong>Analysis of survival using OncoLnc</strong><br />\r\nThe OncoLnc (<a href=\"http://www.oncolnc.org/\">http://www.oncolnc.org/</a>), an online platform, allows examining the associations between survival and gene expression [<a href=\"#r-39\">39</a>]. This tool uses TCGA data of up to 21 cancers as its data source. This platform was used to collect cox regression analysis results for <em>HTRA1</em> and <em>HTRA2</em> in different types of cancers. Then we used this result to produce Kaplan-Meier survival plots.</p>\r\n\r\n<p> </p>\r\n\r\n<p><strong>Prognosis and correlation study through R2 genomics</strong><br />\r\nThe R2 Genomics (<a href=\"https://r2.amc.nl/\">https://r2.amc.nl/</a>) is an online platform that can analyze a vast set of publicly available genomic data [<a href=\"#r-40\">40,41</a>]. In this study, we used the Kaplan-Meier scanner feature of R2 to assess the survival of some cancer patients. We also retrieved a list of genes associated with <em>HTRA1</em> and <em>HTRA2</em> via R2 genomics. Venny 2.1 (<a href=\"https://bioinfogp.cnb.csic.es/tools/venny/\">https://bioinfogp.cnb.csic.es/tools/venny/</a>) was then utilized to draw the Venn diagram and determine the associated genes of certain cancers using the gene list. Then, to conduct analyses of gene ontologies (such as biological process 2018, molecular function 2018, and cellular component 2018) and pathways (such as Kyoto Encyclopedia of Genes and Genomes or KEGG human 2019, Reactome pathway 2016, and Panther pathway 2016) of widely associated genes using Enrichr (<a href=\"https://maayanlab.cloud/Enrichr/\">https://maayanlab.cloud/Enrichr/</a>) [<a href=\"#r-42\">42</a>].</p>\r\n\r\n<p> </p>\r\n\r\n<p><strong>Statistical analysis</strong><br />\r\nWe used the Oncomine, cBioPortal, UALCAN, and GEPIA databases to gather gene expression. The p-values < 0.01 were considered significant. The methylation box plots were obtained from the UALCAN database. All results are displayed with p-values obtained from a log-rank test. The levels of significance (p-values) of all servers were determined by the programs used for the analyses. Several online bioinformatics resources, including R2: Kaplan Meier Scanner, PrognoScan, OncoLnc, and Kaplan-Meier Plotter, were used to create the survival plots. The p-values < 0.05 were considered significant (*p < 0.05, **p < 0.01, ***p < 0.001, and ****p < 0.0001).</p>"
},
{
"section_number": 3,
"section_title": "RESULTS",
"body": "<p><strong>Transcription levels of <em>HTRA1</em> and <em>HTRA2</em> in different types of cancer</strong><br />\r\nWe started the study by analyzing the transcription level of <em>HTRA1</em> and <em>HTRA2</em> in different cancers relative to the normal tissues. To evaluate the impact of <em>HTRA1</em> and <em>HTRA2</em> serine proteases in the progression of different types of human cancers, we used the Oncomine and The GEPIA database. We used 0.01, 2, and 10% for p-value, fold change, and gene ranking, respectively, as our criteria for analysis in the Oncomine database. We inquired about the Oncomine and GEPIA database with all these criteria and observed an overview of <em>HTRA1</em> and <em>HTRA2</em> expressions. <em>HTRA1</em> serine protease was extensively overexpressed in some cancers, such as breast cancer, leukemia, lymphoma, pancreatic cancer, etc., and moderately upregulated in others, compared to their expression patterns in normal tissues. Unlike <em>HTRA1</em>, there was a moderate upregulation such as in head and neck cancer and downregulation of <em>HTRA2</em> serine protease in specific cancer such as breast and colorectal cancer. Based on these findings, we observed that the <em>HTRA</em> serine proteases play a role as either oncogene or tumor suppressor gene (TSG), but <em>HTRA1</em> is more oncogenic than the <em>HTRA2</em> (<a href=\"#figure1\">Figure 1a</a>).<br />\r\nNext, via the cBioPortal web, we accessed the TCGA data and queried the transcript expression for both serine proteases in 32 different cancer types. These findings indicate that <em>HTRA1</em> and <em>HTRA2</em> are expressed differently in different kinds of cancer (<a href=\"#figure1\">Figure 1b</a>).</p>\r\n\r\n<div id=\"figure1\">\r\n<figure class=\"image\"><img alt=\"\" height=\"307\" src=\"/media/article_images/2023/11/07/178-1646022244-Figure1.jpg\" width=\"500\" />\r\n<figcaption><strong>Figure 1. </strong>Transcription rates of <em>HTRA1</em> and <em>HTRA2</em> in various cancer types. (a) The above figure was obtained from the Oncomine database, showing statistically significant data of <em>HTRA1</em> and <em>HTRA2</em> mRNA with upregulation (indicated by red) and downregulation (indicated by blue) (cancer tissue vs. normal tissue). We used 0.01, 2, and 10% for p-value, fold change, and gene ranking, respectively, as our criteria for analysis. The number of studies that met these criteria is represented by the numbers in the boxes. (b) Study of mRNA levels for <em>HTRA1</em> and <em>HTRA2</em> in 32 forms of cancer utilizing cBioPortal online tool. Each point reflects an individual analysis.</figcaption>\r\n</figure>\r\n\r\n<p> </p>\r\n</div>\r\n\r\n<p><strong>Transcript expression analysis of <em>HTRA1</em> and <em>HTRA2</em></strong><br />\r\nTo investigate the degree of differential expressions of <em>HTRA</em> serine protease, we performed a systemic analysis through the Oncomine platform in different types of human cancer. <em>HTRA1</em> and <em>HTRA2</em> transcript levels in various cancer cell lines compared to their normal tissues were examined in the Oncomine database. This study shows that <em>HTRA1</em> is overexpressed in the brain, B-cell lymphoma, pancreatic, and kidney cancers while underexpressed in ovarian, skin, colon, and rectum cancers in comparison with normal tissues [<a href=\"#r-43\">43,44</a>] (<a href=\"#figure2\">Figure 2a</a> [i-viii]).<br />\r\nTo validate these results of <em>HTRA1</em> expression, we performed another study of this gene using a different web-based tool, Gene Expression Profiling Interactive Analysis (GEPIA). The results from GEPIA validated <em>HTRA1</em> overexpression in the brain, B-cell lymphoma, pancreatic, kidney cancers, and underexpression in ovarian, skin, colon, and rectum cancers (<a href=\"#figure2\">Figure 2b</a> [i-viii]). <em>HTRA2</em> expression levels in various cancers vary considerably from <em>HTRA1</em> expression levels. This study showed that <em>HTRA2</em> is substantially upregulated in the brain, plasma cell, pancreatic, head, neck, kidney, skin, colon, and breast cancers. In contrast, it is under-expressed in ovarian cancer [<a href=\"#r-45\">45,46</a>] (<a href=\"#figure3\">Figure 3a</a> [i-viii]).<br />\r\nThe above expression pattern of <em>HTRA2</em> in the brain, plasma cell, pancreatic, kidney, skin, colon, breast, and ovarian cancer has also been found from TCGA data on the GEPIA-based online platform, which we used for cross-checking the result retrieved from the Oncomine database (<a href=\"#figure3\">Figure 3b</a> [i-viii]). Previous studies also support these results regarding <em>HTRA1</em> and <em>HTRA2</em> expression in different types of cancer. For instance, whereas the downregulation of <em>HTRA1</em> was noticed in ovarian, skin, and colorectal cancers [<a href=\"#r-20\">20,21</a>,<a href=\"#r-44\">44,47</a>], the upregulation was observed in brain cancer [<a href=\"#r-43\">43</a>]. While the upregulated pattern of <em>HTRA2</em> was noticed in colorectal cancer [<a href=\"#r-45\">45</a>], the downregulation was detected in ovarian cancer [<a href=\"#r-46\">46</a>]. Our study showed that <em>HTRA1</em> and <em>HTRA2</em> exhibit distinct expression patterns in different human cancers, which is also supported by previous studies.</p>\r\n\r\n<div id=\"figure2\">\r\n<figure class=\"image\"><img alt=\"\" height=\"589\" src=\"/media/article_images/2023/11/07/178-1646022244-Figure2.jpg\" width=\"500\" />\r\n<figcaption><strong>Figure 2. </strong>Analysis of <em>HTRA1</em> mRNA expression in different human cancers. (a) The <em>HTRA1</em> expression box plot was constructed from the Oncomine online tool. The left plot represents the normal tissue, while the cancer tissue is seen in the right plot. Analysis of MG (Malignant Glioma) compared with normal cerebellum (i), DLBC (Lymphoid Neoplasm Diffuse Large B-cell Lymphoma) compared with normal B-lymphocyte (ii), OV (Ovarian cancer) compared with normal ovarian surface epithelium (iii), PDAC (Pancreatic Ductal Adenocarcinoma) compared with the normal pancreas (iv), KIRC (Clear Cell Renal Cell Carcinoma compared with normal kidney cell (v), SKCM (Cutaneous Melanoma compared with normal skin (vi), COAD (Colon adenocarcinoma) compared with a normal colon (vii), READ (Rectum adenocarcinoma) compared with the normal rectum. (b) Analysis of <em>HTRA1</em> expression in The Cancer Genome Atlas (TCGA) and Genotype-Tissue Expression (GTex) database. The box plot was generated using GEPIA to show the expression patterns of <em>HTRA1</em> in tumor (T) tissues compared to its normal (N) tissue. The left red plot represents tumor tissue, while the right blue blot reflects normal tissue (i-viii). The criteria of this analysis were 0.01 and 2 for p-value and fold change, respectively. GBM (Glioblastoma multiforme), DLBC (Lymphoid Neoplasm Diffuse Large B-cell Lymphoma), OV (Ovarian carcinoma), PAAD (Pancreatic adenocarcinoma), KIRC (Kidney renal clear cell carcinoma), SKCM (Skin Cutaneous Melanoma), COAD (Colon adenocarcinoma), READ (Rectum adenocarcinoma).</figcaption>\r\n</figure>\r\n</div>\r\n\r\n<div id=\"figure3\">\r\n<figure class=\"image\"><img alt=\"\" height=\"575\" src=\"/media/article_images/2023/11/07/178-1646022244-Figure3.jpg\" width=\"500\" />\r\n<figcaption><strong>Figure 3. </strong>Analysis of <em>HTRA2</em> mRNA expression in different human cancers. (a) The <em>HTRA2</em> expression box plot was constructed from the Oncomine online tool. The left plot represents the normal tissue, while the cancer tissue is seen in the right plot. Analysis of GBM (Glioblastoma) compared with the cerebellum (i), DLBC (Lymphoid Neoplasm Diffuse Large B-cell Lymphoma) compared with B-lymphocyte (ii), OV (Ovarian cancer) compared with ovarian surface epithelium (iii), PDAC (Pancreatic Ductal Adenocarcinoma) compared with the pancreas (iv), ccRCC (Clear Cell Renal Cell Carcinoma) compared with kidney (v), SKCM (Skin Cutaneous Melanoma) compared with skin (vi), COAD (Colon adenocarcinoma) compared with a normal colon (vii), BRCA (Invasive breast carcinoma) compared with breast (viii). (b) Analysis of <em>HTRA2</em> expression in The Cancer Genome Atlas (TCGA) and Genotype-Tissue Expression (GTex) database. The box plot was generated using GEPIA to show the expression patterns of <em>HTRA2</em> in tumor (T) tissues compared to its normal (N) tissue. The left red plot represents tumor tissue, while the right blue blot reflects normal tissue (i-viii). The criteria of this analysis were 0.01 and 2 for p-value and fold change, respectively. GBM (Glioblastoma multiforme), DLBC (Lymphoid Neoplasm Diffuse Large B-cell Lymphoma), OV (Ovarian carcinoma), PAAD (Pancreatic adenocarcinoma), KIRC (Kidney renal clear cell carcinoma), SKCM (Skin Cutaneous Melanoma), COAD (Colon adenocarcinoma), BRCA (Invasive breast carcinoma).</figcaption>\r\n</figure>\r\n\r\n<p> </p>\r\n</div>\r\n\r\n<p><strong>Analysis of promoter methylation in different cancer types</strong><br />\r\nMethylation is a systematic alteration of biomolecules, and it is associated with gene expression and cancer development [<a href=\"#r-48\">48</a>]. Next, we analyzed promoter methylation of <em>HTRA1</em> and <em>HTRA2</em> in different types of cancer based on sample types using the UALCAN database. The degree of DNA methylation is indicated by the beta value, ranging from 0 (unmethylated) to 1 (completely methylated). Diverse beta value cut-offs have been used to suggest hypermethylation (0.7-0.5) or hypomethylation (0.3-0.25) [<a href=\"#lr-49\">49</a>]. We observed that the promoter of the <em>HTRA1</em> is hypomethylated in several cancers, such as KIRC (kidney renal clear cell carcinoma) and BLCA (urothelial bladder carcinoma) (<a href=\"#figure4\">Figure 4a</a> [iv, v, vii]). Still, it is hypermethylated in BRCA (invasive breast carcinoma), COAD (colon adenocarcinoma), ESCA (esophageal carcinoma), and LUAD (Lung adenocarcinoma), showed in <a href=\"#figure4\">figure 4a</a> [i-iii, vi]. In contrast to <em>HTRA1</em>, the <em>HTRA2</em> gene is hypomethylated in many cancers, including BRCA (invasive breast carcinoma), KIRC (kidney renal clear cell carcinoma), PRAD (Prostate adenocarcinoma), BLCA (urothelial bladder carcinoma), and LIHC (Liver hepatocellular carcinoma), shown in figure 4b [i, iv-vii]. Still, it is hypermethylated in COAD (colon adenocarcinoma), ESCA (esophageal carcinoma) (<a href=\"#figure4\">Figure 4b</a> [ii, iii]). Methylation in tumor suppressor genes’ promoter regions silences them, and methylation inside the gene itself can cause mutational events. These pathways may play a key role in the development of a wide range of human cancers [<a href=\"#r-50\">50</a>].</p>\r\n\r\n<div id=\"figure4\">\r\n<figure class=\"image\"><img alt=\"\" height=\"589\" src=\"/media/article_images/2023/11/07/178-1646022244-Figure4.jpg\" width=\"500\" />\r\n<figcaption><strong>Figure 4. </strong>Analysis of promoter methylation in both <em>HTRA1</em> and <em>HTRA2</em> genes. The box plots were obtained from UALCAN online database. (a) The figure shows the methylation status of the <em>HTRA1</em> promoter in several human cancers (i-vii). (b) The figure shows the methylation status of <em>HTRA2</em> promoter in several human cancers (i-vii). BLCA, urothelial bladder carcinoma; BRCA, breast invasive carcinoma; COAD, colon adenocarcinoma; ESCA, esophageal carcinoma; HNSC, head, and neck squamous cell carcinoma; KIRC, kidney renal clear cell carcinoma; LIHC, liver hepatocellular carcinoma; LUAD, lung adenocarcinoma; PRAD, prostate adenocarcinoma.</figcaption>\r\n</figure>\r\n\r\n<p> </p>\r\n</div>\r\n\r\n<p><strong>Predicting PPI networks of <em>HTRA1</em> and <em>HTRA2</em></strong><br />\r\n<em>HTRA1</em> is a member of the <em>HTRA</em> family of serine proteases [<a href=\"#r-21\">21-51</a>]. <em>HTRA1</em> was first extracted as a transformation-sensitive protein from fibroblasts because of its downregulation by SV40 [<a href=\"#r-52\">52</a>]. <em>HTRA2</em> is also known as <em>L56/HTRA</em>, a structurally related protein to <em>HTRA1</em> expressed differently in human osteoarthritic cartilage 4. The serine protease domain and the PDZ domain in the carboxy terminus end are present in <em>HTRA1</em> and <em>HTRA2</em>. But what makes a difference is that <em>HTRA1</em> has an insulin-like growth factor binding proteins (IGFBP) domain and a signal sequence for secretion, which are missing in HTRA2 [<a href=\"#r-53\">53-54</a>]. However, the molecular mechanism of <em>HTRA1</em> and <em>HTRA2</em> in cancer progression is still unclear [<a href=\"#r-55\">55</a>]. Our current study attempted to obtain comprehensive system-level information on <em>HTRA1</em> and <em>HTRA2</em> by constructing a PPI network with their closely correlated protein partners. We used the STRING database (<a href=\"https://xn--stringdb-cf7d.org/\">https://string−db.org</a>) to create the PPI network. STRING is an online database that provides the opportunity to analyze the functional and physical interaction of proteins [<a href=\"#r-56\">56</a>]. We selected Homo sapiens as our target organism. The database was reviewed separately for both <em>HTRA1</em> and <em>HTRA2</em>, where nodes indicated the proteins, and the edges presented the interactions between two proteins.<br />\r\nProteins operate their function in an assembled fashion, specifically through their interactions [<a href=\"http://#r-57\">57</a>]. For further study, we identified significant functional protein partners for <em>HTRA1</em> and <em>HTRA2</em> (<a href=\"#figure5\">Figure 5a</a> [i, ii]). The predicted protein partners of <em>HTRA1</em> are as follows: 60S ribosomal protein L34 (<em>RPL34</em>), aggrecan core protein (<em>ACAN</em>), ATP-dependent zinc metalloprotease YME1L1 (<em>YME1L1</em>), 60 kDa heat shock protein (<em>HSPD1</em>), ATP-dependent Clp protease proteolytic subunit (<em>CLPP</em>), puratrophin-1 (<em>PLEKHG4</em>), complement factor H (<em>CFH</em>), age-related maculopathy susceptibility 2 (<em>ARMS2</em>), ATP-dependent Clp protease ATP-binding subunit clpX-like (<em>CLPX</em>), chymotrypsin-C (<em>CTRC</em>) (<a href=\"#figure5\">Figure 5a</a> [i]). The predicted protein partners of <em>HTRA2</em> are as follows: Baculoviral IAP repeat-containing protein 2 (<em>BIRC2</em>), baculoviral IAP repeat-containing protein 3 (<em>BIRC3</em>), endonuclease G (<em>ENDOG</em>), PTEN-induced kinase 1(<em>PINK1</em>), E3 ubiquitin-protein ligase parkin (<em>PARK2</em>), nucleolysin TIA-1 isoform p40 (<em>TIA1</em>), mitogen-activated protein kinase 14 (<em>MAPK14</em>), TNF receptor-associated factor 2 (<em>TRAF2</em>), diablo IAP-binding mitochondrial protein (DIABLO), X-linked inhibitor of apoptosis (<em>XIAP</em>) (<a href=\"#figure5\">Figure 5a </a>[ii]). Combined with earlier research, the results reported above prove that <em>HTRA1</em> and <em>HTRA2</em> expression can play a role in cancer cell proliferation and survival through interactions with co-expressed genes.</p>\r\n\r\n<div id=\"figure5\">\r\n<figure class=\"image\"><img alt=\"\" height=\"536\" src=\"/media/article_images/2023/11/07/178-1646022244-Figure5.jpg\" width=\"500\" />\r\n<figcaption><strong>Figure 5. </strong>Recognition of protein-protein interactions necessary for <em>HTRA1</em> and <em>HTRA2</em> function. (a) The connecting nodes obtained using STRING are shown in circles. The predicted protein partners of <em>HTRA1</em> and <em>HTRA2</em> are shown in figures (i) and (ii), respectively. (b) This figure shows a total of 219 mutations, including 192 missense mutations, 19 truncating mutations, four in-frame mutations, and four fusion mutations. All the mutation sites are localized from 0 to 480 amino acids residue (i). A total of 170 mutations, including 131 missense mutations, 37 truncating mutations, and two in-frame mutations, are located between amino acids 0 and 458 (ii). The cancer types summary indicates that the <em>HTRA1</em> and <em>HTRA2</em> genes have predominantly altered in skin cancer (melanoma for <em>HTRA1</em> and metastatic melanoma for <em>HTRA2</em>).</figcaption>\r\n</figure>\r\n\r\n<p> </p>\r\n</div>\r\n\r\n<p><strong>Mutations and copy number alterations (CNAs) of <em>HTRA1</em> and <em>HTRA2</em></strong><br />\r\nWe studied the mutations and copy number alterations (CNAs) of <em>HTRA1</em> and <em>HTRA2</em> in different types of cancer through the cBioPortal web tool. First, we examined the mutations of <em>HTRA1</em> in 83,154 samples of 80,247 individual patients from 211 studies that cover the data from all the accessible cancers. Among the samples, we found 219 mutations site in <em>HTRA1</em> with a 0.2% frequency of somatic mutation, and all are located between 0 to 480 amino acid residues. Among these mutations, there were 192 missense mutations, 19 truncating mutations, four in-frame mutations, and four fusion mutations (<a href=\"#figure5\">Figure 5a</a> [i]). It is worth mentioning that there were also 17 repeat mutations in the 219 mutations. We have found that <em>HTRA1</em> mutations appeared predominantly in skin, breast, prostate, and colorectal cancer and spread across the PDZ domain (from 382 to 455 amino acid residues), with a hotspot in <em>V433I/A</em>, where six mutations were reported. The amino acid residue is changed due to frame-shift deletion (<a href=\"#figure5\">Figure 5a</a> [i]).<br />\r\nWe also queried the database for <em>HTRA2</em> using the same settings used as for <em>HTRA1</em>. In this case, we found 170 mutations with a 0.2% frequency of somatic mutation, the same as <em>HTRA1</em>, and all are located between 0 to 458 amino acid residues. However, mutations in <em>HTRA2</em> are significantly different from <em>HTRA1</em>. Among the total 170 mutations, 131 are missense mutations, 37 are truncating mutations, and 2 are inframe mutations. It should be noted that there were 11 repeat mutations. The mutations have appeared mainly in the prostate, endometrium, uterine and colorectal cancer, with a hotspot in <em>A116Qfs*93</em> located between amino acids 100 and 150, where seven mutations were mentioned, and the amino acid residue is changed due to frame-shift deletion (Figure 5b [ii]). In this analysis, we retrieved a cancer types summary, which shows alterations in different types of cancers, with a minimum of 110 samples with a mutation frequency of at least 1%. These indicate that the <em>HTRA1</em> and <em>HTRA2</em> genes have predominantly altered in skin cancer (melanoma for <em>HTRA1</em> and metastatic melanoma for <em>HTRA2</em>) (<a href=\"#figure5\">Figure 5b</a> [i, ii]).<br />\r\n<br />\r\nSecond, we examined the relationship of the mutation and copy number alterations with <em>HTRA1,</em> and its protein partners previously retrieved from the STRING database. We provided the gene list as <em>HTRA1, RPL34, ACAN, YME1L1, HSPD1, CLPP, PLEKHG4, CFH, ARMS2, CLPX, CTRC</em>, and investigated copy number alterations and mutations that cover all the cancer datasets available in the cBioPortal database (<a href=\"#figure6\">Figure 6a</a> [i]). The findings revealed that the alteration frequency varied from 20% of 30 cases to 74.36% of 39 cases, including a minimum of 20% alterations. The <em>HTRA1</em>-centered-gene-signature alterations most commonly occur in cutaneous squamous cell carcinoma (SCC) and less in metastatic prostate cancer. Likewise, we studied the mutations and copy number alteration for <em>HTRA2</em> and its protein partners (<em>HTRA2, BIRC2, BIRC3, ENDOG, PINK1, PARK2, TIA1, MAPK14, TRAF2, DIABLO, XIAP</em>), which showed the alteration frequency varied from 15.19% of 236 cases to 73.47% of 147 cases, which includes a minimum of 15% alterations (<a href=\"#figure6\">Figure 6a</a> [ii]). Unlike <em>HTRA1</em>, maximum alteration occurred in lung cancer for <em>HTRA2</em> and its protein partners, while less occurred in metastatic breast cancer. Whereas the alteration in SCC dominantly resulted from mutations (74.36% mutation) for <em>HTRA1</em> and its protein partners, and the alteration in gastric cancer from deep deletion (53.06% deep deletion, 0.68% mutation, 11.56% amplification, and 8.16% multiple alterations) for <em>HTRA2</em> and its protein partners.<br />\r\nFollowing that, we explored the OncoPrint feature to identify how genomic alterations are distributed through the <em>HTRA1</em> and its protein partners gene for the cutaneous squamous cell carcinoma (SCC) and through the <em>HTRA2</em> and its protein partners gene for lung cancer (<a href=\"#figure6\">Figure 6b</a> [i, ii]). The fluctuation rate of genetic changes is substantially higher in the <em>HTRA1</em> and its protein partner genes than the <em>HTRA2</em> and its protein partner genes. The alterations mainly take place in the <em>CFH</em> (alteration frequency of 62%) and <em>ACAN</em> (alteration frequency of 44%) genes for the <em>HTRA1</em> and its protein partners genes (<a href=\"#figure6\">Figure 6b</a> [i]). In comparison, the alteration dominantly occurred in the <em>XIAP</em> (alteration frequency of 47%) and <em>TAF2</em> (alteration frequency of 5%) for the <em>HTRA2</em> and its protein partners genes (<a href=\"#figure6\">Figure 6b</a> [ii]).</p>\r\n\r\n<div id=\"figure6\">\r\n<figure class=\"image\"><img alt=\"\" height=\"379\" src=\"/media/article_images/2023/11/07/178-1646022244-Figure6.jpg\" width=\"500\" />\r\n<figcaption><strong>Figure 6. </strong>(a) Frequency of genetic changes in <em>HTRA1</em>-centered-signature-gene (<em>HTRA1, RPL34, ACAN, YME1L1, HSPD1, CLPP, PLEKHG4, CFH, ARMS2, CLPX, CTRC</em>) was retrieved from cBioPortal database, which includes a minimum of 20% alterations. The color of the bar indicates the alteration types. Green color indicates mutation, purple indicates fusion, red indicates amplification, blue indicates deep deletion, and grey indicates multiple alterations in the alteration frequency (i). The alteration frequency of <em>HTRA2</em>-centered-signature-gene (<em>HTRA2, BIRC2, BIRC3, ENDOG, PINK1, PARK2, TIA1, MAPK14, TRAF2, DIABLO, XIAP</em>) was retrieved from cBioPortal database which includes a minimum of 15% alterations. The color of the bar indicates the alteration types. Green color indicates mutation, purple indicates fusion, red indicates amplification, blue indicates deep deletion, and grey indicates multiple alterations in the alteration frequency (ii). (b) The <em>HTRA1</em>-centered-gene-signature alterations most commonly occur in cutaneous squamous cell carcinoma (SCC). We explored the OncoPrint feature to identify how genomic alterations are distributed through the <em>HTRA1</em> and its protein partners gene within cutaneous squamous cell carcinoma. A missense mutation (green), splice fusion (yellow), truncating mutation (purple), and no alterations (grey) were included in the alteration frequency (i). The <em>HTRA2</em>-centered-gene-signature alterations most commonly occur in gastric cancer. We explored the OncoPrint feature in order to identify how genomic alterations are distributed through the <em>HTRA1</em> and its protein partners gene within gastric cancer. A missense mutation (green), splice mutation (yellow), deep deletion (blue), amplification (red), and no alterations (grey) were included in the alteration frequency (ii).</figcaption>\r\n</figure>\r\n\r\n<p> </p>\r\n</div>\r\n\r\n<p><strong>Assessment of survival and prognosis of <em>HTRA1</em> and <em>HTRA2</em></strong><br />\r\nWe have carried out the study with the use of various web-based tools, notably PrognoScan, R2, Kaplan-Meier Plotter, and OncoLnc, to examine the link between gene expression and prognostic value of <em>HTRA1</em> and <em>HTRA2</em>. We found a positive association between <em>HTRA1</em> and <em>HTRA2</em> upregulation with poor survival in pancreatic, kidney, colon, and rectum cancer (<a href=\"#figure7\">Figure 7a</a> [iv, v, vii, viii]). On the contrary, the downregulation was positively linked to its high overall survival (OS) in the ovarian and kidney, as well as high relapse-free survival (RFS) in colon and rectum cancer (<a href=\"#figure7\">Figure 7a</a> [iii, v, vii, viii]). In addition, there was a positive correlation between <em>HTRA1</em> downregulation with low overall survival in the brain and skin cancer, as well as relapse-free survival (RFS) in blood cancer (<a href=\"#figure7\">Figure 7a</a> [i, vi, ii]). It should be emphasized that, in comparison with skin cancer, poor survival was worse in brain and blood cancer (<a href=\"#figure7\">Figure 7a</a> [vi, i, ii]).<br />\r\nDepending on the samples and analyses, the Oncomine database revealed that the <em>HTRA1</em> is upregulated as well as downregulated in certain cancers, including the brain, breast, and kidney cancer (<a href=\"#figure1\">Figure 1a</a>). We observed that most cancers have extremely distinct correlations with the expression of <em>HTRA2</em> and its effect on a patient’s prognosis than with <em>HTRA1</em>. We found a substantial positive relationship between the <em>HTRA2</em> upregulation with poor survival in pancreatic, skin, and colon cancer (<a href=\"#figure7\">Figure 7b</a> [iii, iv, vi, vii]). On the other hand, the upregulation of <em>HTRA2</em> was strongly linked to a high survival rate in the brain, blood, kidney, and breast cancer (<a href=\"#figure7\">Figure 7b</a> [i, ii, v, viii]). In contrast to <em>HTRA1</em>, the Oncomine database could not supply particular patterns for <em>HTRA2</em> expression (<a href=\"#figure1\">Figure 1a</a>), even though the survival analysis showed both upregulation and downregulation in certain cancer types, namely the brain, blood, pancreatic, ovarian, and skin cancer.<br />\r\nTo understand more about clinical outcomes associated with both genes, we used the PrognoScan database to look at the prognostic characteristics of <em>HTRA1</em> and <em>HTRA2</em> expression patterns for various cancer tissues. This study discovered that <em>HTRA1</em> was linked to a poor prognosis in brain and blood cancer and that its underexpression was substantially correlated with poor survival. We cross-checked the <em>HTRA1</em> expression level in brain and blood cells; the upregulation of these genes according to the Oncomine platform was confirmed through the GEPIA database.<br />\r\nWe found the overexpression of <em>HTRA2</em> to be related to a very poor prognosis in skin cancer. The <em>HTRA2</em> underexpression was linked to high OS against this cancer. On the other hand, upregulation of <em>HTRA2</em> in breast cancer was linked to the high OS, while the downregulation of <em>HTRA2</em> was linked to the poor OS in this cancer. Regarding the expression and survival pattern of <em>HTRA1</em>, <em>HTRA2</em>, and their interacting protein partners, this result could assist us in understanding the fundamental biological targets for the prognosis of different types of cancer.</p>\r\n\r\n<div id=\"figure7\">\r\n<figure class=\"image\"><img alt=\"\" height=\"480\" src=\"/media/article_images/2023/11/07/178-1646022244-Figure7.jpg\" width=\"500\" />\r\n<figcaption><strong>Figure 7. </strong><em>HTRA1</em> and <em>HTRA2</em> gene expression with their clinical significance. (a) Survival plot generated from PrognoScan with <em>HTRA1</em> expression pattern (red, high expression; blue, low expression) for (i) brain cancer, (ii) blood cancer. Survival plot generated from Kaplan-Meier Plotter with <em>HTRA1</em> expression pattern (red, high expression; black, low expression) for (iii) ovarian cancer. Survival plot generated from R2: Kaplan Meier scanner with <em>HTRA1</em> expression pattern (red, high expression; blue, low expression) for (vi) Pancreatic cancer, (v) kidney cancer, (vii) skin cancer, (vii) colon cancer. Survival plot generated from OncoLnc with <em>HTRA1</em> expression pattern (red, high expression; blue, low expression) for (ix) rectum cancer. The analysis threshold was Cox p <0.05 for all databases. (b) Survival plot generated from R2: Kaplan Meier scanner with <em>HTRA2</em> expression pattern (red, high expression; blue, low expression) for (i) brain cancer, (ii) blood cancer, (iii) pancreatic cancer, (v) kidney cancer, (vii) colon cancer. Survival plot generated from Kaplan-Meier plotter with <em>HTRA2</em> expression pattern (red, high expression; black, low expression) for (iii) ovarian cancer. Survival plot generated from PrognoScan with <em>HTRA2</em> expression pattern (red, high expression; blue, low expression) for (vi) skin cancer, (viii) breast cancer. The analysis threshold was Cox p <0.05 for all databases.</figcaption>\r\n</figure>\r\n\r\n<p> </p>\r\n</div>\r\n\r\n<p><strong>Pathways and functional gene ontology</strong><br />\r\nGene expressed with other genes in a signal transduction pathway plays an important role in developing human cancer [<a href=\"#lr-58\">58,59</a>]. At this point, we found some genes that are correlated positively and negatively with <em>HTRA1</em> and <em>HTRA2</em>. To find correlated genes in selected cancers, we performed a systematic study utilizing the R2 platform. Based on the overexpression nature retrieved from the Oncomine database, we selected two sets of cancer, each set containing the top four cancer for both <em>HTRA1</em> and <em>HTRA2</em>. In the R2 database, we first selected the gene expression data for different types of cancer. Based on upregulation, the following four cancer forms for <em>HTRA1</em> were individually considered: leukemia, lymphoma, breast, and pancreatic cancer. In this study, the threshold was designed to a p-value < 0.01, and the correction was a false discovery rate (FDR) correction. We found that 819, 3573, 3239, and 965 genes were positively correlated with <em>HTRA1</em> in leukemia, lymphoma, breast, and pancreatic cancer, respectively. A gene cluster of our positively correlated genes (henceforth mentioned as “<em>HTRA1</em>-correlated gene cluster”) with <em>HTRA1</em> was common in four types of cancer (<a href=\"#figure8\">Figure 8a [i]</a>). No common genes have correlated negatively with <em>HTRA1</em> in these four Cancer types (<a href=\"#figure8\">Figure 8b [i]</a>).<br />\r\nNext, we conducted a similar study for <em>HTRA2</em>, considering lymphoma, kidney, skin, and pancreatic cancer on overexpression. We observed that 165, 2029, 3578, and 2882 genes were positively correlated with <em>HTRA2</em> in lymphoma, kidney, skin, and pancreatic cancer, respectively. Compared to <em>HTRA1</em>, there were 23 positively correlated genes (henceforth mentioned as “<em>HTRA2</em>-correlated gene cluster”) with <em>HTRA2</em> were common in four types of cancer (<a href=\"#figure8\">Figure 8b [i]</a>). Furthermore, in all cancers studied, a shortlist of three genes correlated negatively with <em>HTRA2</em> (<a href=\"#figure8\">Figure 8b [ii]</a>). The above correlation study showed that <em>HTRA1</em> and <em>HTRA2</em> exhibit distinct patterns of correlation with many other genes in selected cancers. The findings indicate that <em>HTRA1</em> and <em>HTRA2</em> are involved in different similar regulatory pathways in the genes.<br />\r\nAfter, we conducted gene ontology (GO) and pathway analysis for both <em>HTRA1</em>-correlated gene clusters and <em>HTRA2</em>-correlated genes that contribute to the progression of different cancers in humans using a web-based tool, Enrichr. We included results from three databases for pathway analysis (<a href=\"#figure9\">Figure 9a, 9b</a>).<br />\r\nWe observed various significant pathways for the <em>HTRA1</em>-correlated gene cluster, including N-glycan biosynthesis, breast cancer, protein processing in the endoplasmic reticulum, human papillomavirus infection, and cancer pathway, etc. in KEGG human 2019 database (<a href=\"#figure9\">Figure 9a [i]</a>). Likewise, Reactome pathways 2016 showed the pathways related to N-glycan trimming and elongation in the cis-Golgi, intra-Golgi traffic, signaling pathways occurred by NOTCH1, degradation of extracellular matrix, etc. (<a href=\"#figure9\">Figure 9a [ii]</a>). Analysis of Panther pathway 2016 also showed the notch signaling like Reactome 2016 (<a href=\"#figure9\">Figure 9a [iii]</a>). For the <em>HTRA2</em>-correlated gene cluster, the study of KEGG human 2019 showed several critical pathways, including spliceosome, necroptosis, RNA polymerase, proteasome, drug metabolism, etc. (<a href=\"#figure9\">Figure 9b [i]</a>). The Reactome pathways 2016 showed the pathways related to mRNA splicing, major and minor mRNA splicing, processing of capped intron-containing pre-mRNA, pathways associated with HIV infection, etc. (<a href=\"#figure9\">Figure 9b [ii]</a>). Analysis of Panther pathway 2016 showed the pathways including FAS signaling, ubiquitin-proteasome, and Wnt signaling pathway (<a href=\"#figure9\">Figure 9b [iii]</a>).<br />\r\nNext, we analyzed the GO (gene ontology) for both <em>HTRA1</em> and <em>HTRA2</em> gene clusters. For the <em>HTRA1</em>-correlated gene cluster, the GO biological process 2018 mainly includes epithelial to mesenchymal transition involved in endocardial cushion formation, atrioventricular valve development, pulmonary valve development, negative regulation of androgen receptor signaling pathway, etc. (<a href=\"#figure9\">Figure 9a [iv]</a>). Satellite DNA binding, mannosyl-oligosaccharide mannosidase activity, transcription factor activity, serine-type peptidase activity, etc., significant functions are suggested by GO molecular function 2018 (<a href=\"#figure9\">Figure 9a [v]</a>). The GO cellular component 2018 was most significantly associated with an integral part of the Golgi membrane, Golgi sub-compartment, etc. (<a href=\"#figure9\">Figure 9a [vi]</a>). Last, we analyzed the GO process of human cancer by using the list of co-expressed genes of <em>HTRA2</em>. In this instance, we observed that the <em>HTRA2</em>-correlated gene was most significantly associated with regulation of cell death, regulation of mitochondrial autophagy, ubiquitin-dependent ERAD pathway, RNA and mRNA splicing, mitotic nuclear division, etc. in the case of GO biological process 2018 (<a href=\"#figure9\">Figure 9b [iv]</a>). GO molecular function 2018 suggested ubiquitin-binding, RNA binding, coupled ATPase activity, interleukin-1 binding, annealing helicase activity, etc. (<a href=\"#figure9\">Figure 9b [v]</a>). The GO cellular component 2018 was most significantly associated with mitochondrial inter-membrane space, mitochondrial envelop, DNA-directed RNA polymerase II, nuclear proteasome complex, death-inducing signaling complex, cytosolic proteasome complex, and CD40 receptor complex, etc. (<a href=\"#figure9\">Figure 9b [vi]</a>).</p>\r\n\r\n<div id=\"figure8\">\r\n<figure class=\"image\"><img alt=\"\" height=\"454\" src=\"/media/article_images/2023/11/07/178-1646022244-Figure8.jpg\" width=\"500\" />\r\n<figcaption><strong>Figure 8. </strong>Study of the correlated gene in selected four types of cancer. These correlated genes were obtained from the R2 database. Venny 2.1 was used to create the Venn diagram for identifying the common genes. (a) The Venn diagram shows the genes positively correlated with <em>HTRA1</em> in leukemia, lymphoma, breast, and pancreatic cancer (i). The Venn diagram shows the genes positively associated with <em>HTRA2</em> in lymphoma, skin, kidney, and pancreatic cancer (ii). (b) Venn diagram of the negatively correlated gene with <em>HTRA1</em> (i) and <em>HTRA2</em> (ii) in selected four cancers.</figcaption>\r\n</figure>\r\n</div>\r\n\r\n<div id=\"figure9\">\r\n<figure class=\"image\"><img alt=\"\" height=\"610\" src=\"/media/article_images/2023/11/07/178-1646022244-Figure9.jpg\" width=\"500\" />\r\n<figcaption><strong>Figure 9. </strong>Pathways and gene ontologies related to <em>HTRA1</em>, <em>HTRA2</em>, and correlated genes. Pathways are obtained from Enrichr online database. The color gradient and the bar length reflect the significance level of the study (brighter color represents more significance). (a) GO and pathways of <em>HTRA1</em>. (i) KEGG human 2019, (ii) Reactome 2016, (iii) Panther 2016, (iv) GO biological process 2018, (v) GO molecular function 2018, and (vi) GO cellular component 2018. (b) GO and pathways of <em>HTRA2</em>. (i) KEGG human 2019, (ii) Reactome 2016, (iii) Panther 2016, (iv) GO biological process 2018, (v) GO molecular function 2018, and (vi) GO cellular component 2018.</figcaption>\r\n</figure>\r\n</div>"
},
{
"section_number": 4,
"section_title": "DISCUSSION",
"body": "<p>Numerous investigations demonstrated that <em>HTRA</em> serine proteases contribute significantly to the development of different types of human cancer [<a href=\"#r-43\">43,44</a>,<a href=\"#r-60\">60,61</a>]. <em>HTRA1</em> can be used as a promising tissue marker in various cancer [<a href=\"#r-62\">62</a>]. Mitochondrial homeostasis is regulated by <em>HTRA2</em> and plays a critical role in apoptosis induction [<a href=\"#r-55\">55</a>]. Also, multiple studies have contended that targeted therapies controlled by <em>HTRA1</em> and <em>HTRA2</em> are promising molecular medicines that prevent the growth of human cancer [<a href=\"#r-17\">17,19</a>,<a href=\"#r-63\">63</a>]. However, <em>HTRA1</em> and <em>HTRA2</em> are yet unrecognized in their function in the progression and prognosis of human cancer. To understand the role of <em>HTRA1</em> and <em>HTRA2</em> in the progression and prognosis of human cancer, we conducted a systemic data mining study on several gene expression datasets of publicly available databases. In cancer and their respective normal tissues, <em>HTRA1</em> and <em>HTRA2</em> have been found to be differentially expressed. According to Oncomine and GEPIA-based mRNA transcript analysis, we found that the degree of their expression of these genes was also different depending on the tissue. Based on Oncomine data, we discovered that <em>HTRA1</em> was overexpressed in various cancer, including the brain, B-cell, breast, pancreatic, and kidney cancers, but was underexpressed in ovarian, skin, colon, and rectum cancers compared to that in normal tissue.<br />\r\nOn the contrary, <em>HTRA2</em> was overexpressed in the brain, plasma cells, pancreatic, head and neck, kidney, skin, colon, and breast cancers. Still, it was underexpressed in ovarian cancer relative to respective normal tissues. In addition, we found the same result of expression for both genes in these cancers when we validated the Oncomine data through the GEPIA database.<br />\r\nNext, we examined the mutation and copy number alterations (CNAs) of both the <em>HTRA1</em> and <em>HTRA2</em> genes to evaluate the impact of CNAs on the development of cancer. Many human cancers are related to CNAs, and it plays an essential role in cancer development [<a href=\"#r-64\">64,65</a>]. Thus, this structural aberration can be employed to develop molecular cancer therapeutics. Earlier studies have demonstrated that clinical outcomes in several cancers, including breast, pancreatic, colorectal cancer, etc., were linked to the structural changes in genes like <em>PIK3CA</em>, <em>PTEN</em>, <em>KRAS</em>, <em>NRAS</em>, <em>TP53</em>, etc. [<a href=\"#r-66\">66–69</a>]. Instead of these studies, the essential roles of copy number alterations and mutation for a gene in the prognosis of human cancer remain unclear. Therefore, to assess CNAs and mutations related to human cancer for both <em>HTRA1</em> and <em>HTRA2</em> genes, we used the cBioPortal web. There were 219 mutations found in <em>HTRA1</em>, including missense, truncation, fusion, and inframe mutations. Most of the mutations spanned over the PDZ domain and appeared mainly in skin, breast, prostate, and colorectal cancer. We also found a mutation hotspot in V433I/A. Unlike <em>HTRA1</em>, the mutation in <em>HTRA2</em> includes missense, truncating, and in-frame mutation. These mutations primarily appeared in the prostate, endometrium, uterine and colorectal cancer.<br />\r\nThe mutation hotspot <em>A116Qfs*93</em> is localized from 100 to 150 amino acid residues. The degree of mutation in HTRA2 was significantly different than in <em>HTRA1</em> [<a href=\"#r-70\">70,71</a>]. Such mutations may contribute to the regulation of cancer growth and prognosis, although this remains to be confirmed. Most of the activities in the biological system, cell-cell signal transduction, and disease progression are controlled by protein-protein interactions (PPIs) [<a href=\"#r-72\">72</a>]. Firstly, we identified the eleven gene signature significantly correlated with <em>HTRA1</em> and <em>HTRA2</em> using STRING. In subsequent analysis through cBioPortal, we found that the genetic alterations in the HTRA1-centered gene mainly occurred in cutaneous squamous cell carcinoma (SCC) with an alteration frequency of 20%-74.36%. The alterations in SCC primarily occurred due to mutation [<a href=\"#r-73\">73,74</a>]. On the contrary, the genetic alterations in the <em>HTRA2</em>-centered gene predominantly occurred in gastric cancer with an alteration frequency of 15.19%-73.47%. Unlike <em>HTRA1</em>, the alterations in gastric cancer mainly occurred due to mutation, amplification, multiple alterations, and deep deletion [<a href=\"#r-75\">75</a>].<br />\r\nSignaling pathways of the human body play an essential role in the biological process, including cell proliferation, cell development, cancer development, etc. [<a href=\"#r-58\">58</a>]. Previous studies demonstrated that signaling pathways like the Wnt pathway, Notch pathway, TGF-beta pathway, etc., were associated with cancer [<a href=\"#r-76\">76–78</a>]. Therefore, we used the R2 platform to identify the significantly correlated gene with <em>HTRA1</em> and <em>HTRA2</em> for pathway and GO analysis in certain selected cancers. These <em>HTRA</em> serine proteases are overexpressed highly. For <em>HTRA1</em>, we found a significant number of genes with a positive correlation in four types of cancer, namely leukemia, lymphoma, breast, and pancreatic cancer. Among these genes, four were common in all kinds of cancer. For <em>HTRA2</em>, positively correlated genes were found in leukemia, kidney, skin, and pancreatic cancers; among these, 23 genes are common in all cancers. The common genes were identified using Venny 2.1. We used an online platform, Enrichr, for these common genes for functional enrichment, pathway, and GO analysis. We found that the pathways related to <em>HTRA1</em> and <em>HTRA2</em> were significantly different. For <em>HTRA1</em>, we observed several pathways, including N-glycan biosynthesis, breast cancer, signaling pathways that occurred by NOTCH1, etc., and the common genes were most notable linked with epithelial to mesenchymal transition in biological process, satellite DNA binding in molecular function, and integral component of Golgi membrane in cellular components [<a href=\"#r-79\">79</a>]. For <em>HTRA2</em>, we found many important pathways, including spliceosome, mRNA splicing, FAS signaling, ubiquitin-proteasome, etc., which were significantly dissimilar from <em>HTRA2</em> related pathways [<a href=\"#r-80\">80</a>].<br />\r\nThen, we examined the prognostic value of both genes based on expression levels of <em>HTRA1</em> and <em>HTRA2</em> in various selected cancers using publicly available online tools such as Kaplan-Meier plotter, R2, PrognoScan, and OncoLnc. We observed that a high expression level of <em>HTRA1</em> was linked to poor survival in pancreatic, kidney, and colon cancers. The overexpression of <em>HTRA1</em> resulted in high survival in brain, blood, and skin cancer. On the contrary, the high expression of <em>HTRA2</em> was linked to a poor prognosis in pancreatic, skin, and colon cancer. But high <em>HTRA1</em> expression was linked to high survival in brain, blood, kidney, and breast cancer. Some of the findings of our investigation are also supported by previous studies [<a href=\"#r-81\">81–83</a>]. Thus. We concluded that <em>HTRA1</em> shows the oncogenic feature in pancreatic, kidney, and colon cancers. Likewise, <em>HTRA2</em> plays an oncogenic role in different types of cancer, including pancreatic, skin, and colon cancers.<br />\r\nOn the other hand, <em>HTRA1</em> plays an anti-oncogenic role in the brain, blood, and skin cancer. <em>HTRA2</em> exhibits an anti-oncogenic feature in the brain, blood, kidney, and breast cancer. It is worth mentioning that both <em>HTRA1</em> and <em>HTRA2</em> show oncogenic effects in pancreatic and colon cancer and exhibit anti-oncogenic features in brain and blood cancer. Previous studies also supported these results [<a href=\"#r-84\">84</a>].<br />\r\nIn summary, we investigated and assessed the expression, mutation status, and copy number alteration patterns of <em>HTRA1</em> and <em>HTRA2</em> genes using a comprehensive statistical analysis, including freely available expression and medical evidence. For different types of cancer, this study was only capable of predicting the expression level of both genes. The findings of this study suggest that these serine proteases can be transformed into medical practices and may impact the clinical outcomes of certain cancers.</p>"
},
{
"section_number": 5,
"section_title": "CONCLUSION",
"body": "<p>According to the study, we utilized various web-based bioinformatics tools and software to investigate the expression pattern, promoter methylation of genes, protein-protein interaction (PPI) partners, linked genes, and patient prognosis related to the expression of other <em>HTRA1</em> and <em>HTRA2</em> genes in different types of human cancers. This study showed that the expression of <em>HTRA1</em> and <em>HTRA2</em> affect the patient’s survival and clinical outcomes in different ways. Our multi-omics analysis uncovered that <em>HTRA1</em> and <em>HTRA2</em> play a role in cancer improvement and differentially modulate cancer’s clinical outcomes. Whereas <em>HTRA1</em> in individuals with pancreatic, kidney, and colon cancers might be targeted for cancer therapy, <em>HTRA2</em> could be used as a prognostic biomarker for skin, pancreatic, and colon cancers. These two genes were previously explored separately in only a few human cancers. We have tried to look at the effect of these genes in the highest number of cancers from publicly available data using different bioinformatics tools. We also tried to determine if both genes would act as biomarkers in the same type of cancer. We found that these two genes can serve as prognostic biomarkers for various cancers separately. Meantime, both <em>HTRA1</em> and <em>HTRA2</em> are possible targets for colon and pancreatic cancer.<br />\r\nIn conclusion, our multi-omics findings could help us better understand the link between <em>HTRA1</em> and <em>HTRA2</em> expression and clinical prognosis. They also give fresh insights into cancer’s molecular pathways, assisting in translating genetic information into treatment. The findings of this study offer some insight into the molecular and clinical features of various cancers and hence might be utilized to aid in the translation of genetic information into cancer therapy. More practical, exploratory, and clinical tests may be required in the future to approve these results since overfit and underfit outcomes may appear in bioinformatics research.</p>"
},
{
"section_number": 6,
"section_title": "ACKNOWLEDGEMENTS",
"body": "<p>The research project is supported by the Ministry of Science and Technology, Bangladesh. (Special Allocation: MS-563 – 1310, 2021-22) and Islamic University research fund of 2019-20 (Ref.-141/Edu./IU-2021/17 Date: 25-8-2021). The authors of this work are grateful to Abdus Samad, Shovon Shaha, and Md. Chayan Ali for their cordial support. Special thanks to the contributors of all databases and software used for this research work.</p>"
},
{
"section_number": 7,
"section_title": "AUTHOR CONTRIBUTIONS",
"body": "<p>AR and MAHMJ designed the research project. AR analyzed the data and drafted the paper. RAH wrote the PPI result of the article. The manuscript was evaluated and modified by MAHMJ, SA, MSR, and MTET. MAHMJ supervised the research study. The text was edited and approved for final submission by all authors.</p>"
},
{
"section_number": 8,
"section_title": "CONFLICTS OF INTEREST",
"body": "<p>There is no conflict of interest among the authors.</p>"
}
],
"figures": [
{
"figure": "https://jabet.bsmiab.org/media/article_images/2023/11/07/178-1646022244-Figure1.jpg",
"caption": "Figure 1. Transcription rates of HTRA1 and HTRA2 in various cancer types. (a) The above figure was obtained from the Oncomine database, showing statistically significant data of HTRA1 and HTRA2 mRNA with upregulation (indicated by red) and downregulation (indicated by blue) (cancer tissue vs. normal tissue). We used 0.01, 2, and 10% for p-value, fold change, and gene ranking, respectively, as our criteria for analysis. The number of studies that met these criteria is represented by the numbers in the boxes. (b) Study of mRNA levels for HTRA1 and HTRA2 in 32 forms of cancer utilizing cBioPortal online tool. Each point reflects an individual analysis.",
"featured": false
},
{
"figure": "https://jabet.bsmiab.org/media/article_images/2023/11/07/178-1646022244-Figure2.jpg",
"caption": "Figure 2. Analysis of HTRA1 mRNA expression in different human cancers. (a) The HTRA1 expression box plot was constructed from the Oncomine online tool. The left plot represents the normal tissue, while the cancer tissue is seen in the right plot. Analysis of MG (Malignant Glioma) compared with normal cerebellum (i), DLBC (Lymphoid Neoplasm Diffuse Large B-cell Lymphoma) compared with normal B-lymphocyte (ii), OV (Ovarian cancer) compared with normal ovarian surface epithelium (iii), PDAC (Pancreatic Ductal Adenocarcinoma) compared with the normal pancreas (iv), KIRC (Clear Cell Renal Cell Carcinoma compared with normal kidney cell (v), SKCM (Cutaneous Melanoma compared with normal skin (vi), COAD (Colon adenocarcinoma) compared with a normal colon (vii), READ (Rectum adenocarcinoma) compared with the normal rectum. (b) Analysis of HTRA1 expression in The Cancer Genome Atlas (TCGA) and Genotype-Tissue Expression (GTex) database. The box plot was generated using GEPIA to show the expression patterns of HTRA1 in tumor (T) tissues compared to its normal (N) tissue. The left red plot represents tumor tissue, while the right blue blot reflects normal tissue (i-viii). The criteria of this analysis were 0.01 and 2 for p-value and fold change, respectively. GBM (Glioblastoma multiforme), DLBC (Lymphoid Neoplasm Diffuse Large B-cell Lymphoma), OV (Ovarian carcinoma), PAAD (Pancreatic adenocarcinoma), KIRC (Kidney renal clear cell carcinoma), SKCM (Skin Cutaneous Melanoma), COAD (Colon adenocarcinoma), READ (Rectum adenocarcinoma).",
"featured": false
},
{
"figure": "https://jabet.bsmiab.org/media/article_images/2023/11/07/178-1646022244-Figure3.jpg",
"caption": "Figure 3. Analysis of HTRA2 mRNA expression in different human cancers. (a) The HTRA2 expression box plot was constructed from the Oncomine online tool. The left plot represents the normal tissue, while the cancer tissue is seen in the right plot. Analysis of GBM (Glioblastoma) compared with the cerebellum (i), DLBC (Lymphoid Neoplasm Diffuse Large B-cell Lymphoma) compared with B-lymphocyte (ii), OV (Ovarian cancer) compared with ovarian surface epithelium (iii), PDAC (Pancreatic Ductal Adenocarcinoma) compared with the pancreas (iv), ccRCC (Clear Cell Renal Cell Carcinoma) compared with kidney (v), SKCM (Skin Cutaneous Melanoma) compared with skin (vi), COAD (Colon adenocarcinoma) compared with a normal colon (vii), BRCA (Invasive breast carcinoma) compared with breast (viii). (b) Analysis of HTRA2 expression in The Cancer Genome Atlas (TCGA) and Genotype-Tissue Expression (GTex) database. The box plot was generated using GEPIA to show the expression patterns of HTRA2 in tumor (T) tissues compared to its normal (N) tissue. The left red plot represents tumor tissue, while the right blue blot reflects normal tissue (i-viii). The criteria of this analysis were 0.01 and 2 for p-value and fold change, respectively. GBM (Glioblastoma multiforme), DLBC (Lymphoid Neoplasm Diffuse Large B-cell Lymphoma), OV (Ovarian carcinoma), PAAD (Pancreatic adenocarcinoma), KIRC (Kidney renal clear cell carcinoma), SKCM (Skin Cutaneous Melanoma), COAD (Colon adenocarcinoma), BRCA (Invasive breast carcinoma).",
"featured": false
},
{
"figure": "https://jabet.bsmiab.org/media/article_images/2023/11/07/178-1646022244-Figure4.jpg",
"caption": "Figure 4. Analysis of promoter methylation in both HTRA1 and HTRA2 genes. The box plots were obtained from UALCAN online database. (a) The figure shows the methylation status of the HTRA1 promoter in several human cancers (i-vii). (b) The figure shows the methylation status of HTRA2 promoter in several human cancers (i-vii). BLCA, urothelial bladder carcinoma; BRCA, breast invasive carcinoma; COAD, colon adenocarcinoma; ESCA, esophageal carcinoma; HNSC, head, and neck squamous cell carcinoma; KIRC, kidney renal clear cell carcinoma; LIHC, liver hepatocellular carcinoma; LUAD, lung adenocarcinoma; PRAD, prostate adenocarcinoma.",
"featured": false
},
{
"figure": "https://jabet.bsmiab.org/media/article_images/2023/11/07/178-1646022244-Figure5.jpg",
"caption": "Figure 5. Recognition of protein-protein interactions necessary for HTRA1 and HTRA2 function. (a) The connecting nodes obtained using STRING are shown in circles. The predicted protein partners of HTRA1 and HTRA2 are shown in figures (i) and (ii), respectively. (b) This figure shows a total of 219 mutations, including 192 missense mutations, 19 truncating mutations, four in-frame mutations, and four fusion mutations. All the mutation sites are localized from 0 to 480 amino acids residue (i). A total of 170 mutations, including 131 missense mutations, 37 truncating mutations, and two in-frame mutations, are located between amino acids 0 and 458 (ii). The cancer types summary indicates that the HTRA1 and HTRA2 genes have predominantly altered in skin cancer (melanoma for HTRA1 and metastatic melanoma for HTRA2).",
"featured": false
},
{
"figure": "https://jabet.bsmiab.org/media/article_images/2023/11/07/178-1646022244-Figure6.jpg",
"caption": "Figure 6. (a) Frequency of genetic changes in HTRA1-centered-signature-gene (HTRA1, RPL34, ACAN, YME1L1, HSPD1, CLPP, PLEKHG4, CFH, ARMS2, CLPX, CTRC) was retrieved from cBioPortal database, which includes a minimum of 20% alterations. The color of the bar indicates the alteration types. Green color indicates mutation, purple indicates fusion, red indicates amplification, blue indicates deep deletion, and grey indicates multiple alterations in the alteration frequency (i). The alteration frequency of HTRA2-centered-signature-gene (HTRA2, BIRC2, BIRC3, ENDOG, PINK1, PARK2, TIA1, MAPK14, TRAF2, DIABLO, XIAP) was retrieved from cBioPortal database which includes a minimum of 15% alterations. The color of the bar indicates the alteration types. Green color indicates mutation, purple indicates fusion, red indicates amplification, blue indicates deep deletion, and grey indicates multiple alterations in the alteration frequency (ii). (b) The HTRA1-centered-gene-signature alterations most commonly occur in cutaneous squamous cell carcinoma (SCC). We explored the OncoPrint feature to identify how genomic alterations are distributed through the HTRA1 and its protein partners gene within cutaneous squamous cell carcinoma. A missense mutation (green), splice fusion (yellow), truncating mutation (purple), and no alterations (grey) were included in the alteration frequency (i). The HTRA2-centered-gene-signature alterations most commonly occur in gastric cancer. We explored the OncoPrint feature in order to identify how genomic alterations are distributed through the HTRA1 and its protein partners gene within gastric cancer. A missense mutation (green), splice mutation (yellow), deep deletion (blue), amplification (red), and no alterations (grey) were included in the alteration frequency (ii).",
"featured": false
},
{
"figure": "https://jabet.bsmiab.org/media/article_images/2023/11/07/178-1646022244-Figure7.jpg",
"caption": "Figure 7. HTRA1 and HTRA2 gene expression with their clinical significance. (a) Survival plot generated from PrognoScan with HTRA1 expression pattern (red, high expression; blue, low expression) for (i) brain cancer, (ii) blood cancer. Survival plot generated from Kaplan-Meier Plotter with HTRA1 expression pattern (red, high expression; black, low expression) for (iii) ovarian cancer. Survival plot generated from R2: Kaplan Meier scanner with HTRA1 expression pattern (red, high expression; blue, low expression) for (vi) Pancreatic cancer, (v) kidney cancer, (vii) skin cancer, (vii) colon cancer. Survival plot generated from OncoLnc with HTRA1 expression pattern (red, high expression; blue, low expression) for (ix) rectum cancer. The analysis threshold was Cox p <0.05 for all databases. (b) Survival plot generated from R2: Kaplan Meier scanner with HTRA2 expression pattern (red, high expression; blue, low expression) for (i) brain cancer, (ii) blood cancer, (iii) pancreatic cancer, (v) kidney cancer, (vii) colon cancer. Survival plot generated from Kaplan-Meier plotter with HTRA2 expression pattern (red, high expression; black, low expression) for (iii) ovarian cancer. Survival plot generated from PrognoScan with HTRA2 expression pattern (red, high expression; blue, low expression) for (vi) skin cancer, (viii) breast cancer. The analysis threshold was Cox p <0.05 for all databases.",
"featured": false
},
{
"figure": "https://jabet.bsmiab.org/media/article_images/2023/11/07/178-1646022244-Figure8.jpg",
"caption": "Figure 8. Study of the correlated gene in selected four types of cancer. These correlated genes were obtained from the R2 database. Venny 2.1 was used to create the Venn diagram for identifying the common genes. (a) The Venn diagram shows the genes positively correlated with HTRA1 in leukemia, lymphoma, breast, and pancreatic cancer (i). The Venn diagram shows the genes positively associated with HTRA2 in lymphoma, skin, kidney, and pancreatic cancer (ii). (b) Venn diagram of the negatively correlated gene with HTRA1 (i) and HTRA2 (ii) in selected four cancers.",
"featured": false
},
{
"figure": "https://jabet.bsmiab.org/media/article_images/2023/11/07/178-1646022244-Figure9.jpg",
"caption": "Figure 9. Pathways and gene ontologies related to HTRA1, HTRA2, and correlated genes. Pathways are obtained from Enrichr online database. The color gradient and the bar length reflect the significance level of the study (brighter color represents more significance). (a) GO and pathways of HTRA1. (i) KEGG human 2019, (ii) Reactome 2016, (iii) Panther 2016, (iv) GO biological process 2018, (v) GO molecular function 2018, and (vi) GO cellular component 2018. (b) GO and pathways of HTRA2. (i) KEGG human 2019, (ii) Reactome 2016, (iii) Panther 2016, (iv) GO biological process 2018, (v) GO molecular function 2018, and (vi) GO cellular component 2018.",
"featured": false
}
],
"authors": [
{
"id": 301,
"affiliation": [
{
"affiliation": "Department of Biotechnology and Genetic Engineering, Faculty of Biological Sciences, Islamic University, Kushtia-7003, Bangladesh"
}
],
"first_name": "Abu",
"family_name": "Reza",
"email": null,
"author_order": 1,
"ORCID": "http://orcid.org/0000-0001-5934-4850",
"corresponding": false,
"co_first_author": false,
"co_author": false,
"corresponding_author_info": "",
"article": 81
},
{
"id": 302,
"affiliation": [
{
"affiliation": "Department of Biotechnology and Genetic Engineering, Faculty of Biological Sciences, Islamic University, Kushtia-7003, Bangladesh"
}
],
"first_name": "Md. Tasnim-E",
"family_name": "Tarik",
"email": null,
"author_order": 2,
"ORCID": null,
"corresponding": false,
"co_first_author": false,
"co_author": false,
"corresponding_author_info": "",
"article": 81
},
{
"id": 303,
"affiliation": [
{
"affiliation": "Department of Biotechnology and Genetic Engineering, Faculty of Biological Sciences, Islamic University, Kushtia-7003, Bangladesh"
}
],
"first_name": "Rizone Al",
"family_name": "Hasib",
"email": null,
"author_order": 3,
"ORCID": "http://orcid.org/0000-0003-3300-6751",
"corresponding": false,
"co_first_author": false,
"co_author": false,
"corresponding_author_info": "",
"article": 81
},
{
"id": 304,
"affiliation": [
{
"affiliation": "Department of Biotechnology and Genetic Engineering, Faculty of Biological Sciences, Islamic University, Kushtia-7003, Bangladesh"
}
],
"first_name": "Md. Khasrul",
"family_name": "Alam",
"email": null,
"author_order": 4,
"ORCID": null,
"corresponding": false,
"co_first_author": false,
"co_author": false,
"corresponding_author_info": "",
"article": 81
},
{
"id": 305,
"affiliation": [
{
"affiliation": "Department of Genetic Engineering and Biotechnology, Faculty of Biological Sciences and Technology, Jashore University of Science and Technology, Bangladesh."
}
],
"first_name": "Md. Shahedur",
"family_name": "Rahman",
"email": null,
"author_order": 5,
"ORCID": null,
"corresponding": false,
"co_first_author": false,
"co_author": false,
"corresponding_author_info": "",
"article": 81
},
{
"id": 306,
"affiliation": [
{
"affiliation": "Department of Biotechnology and Genetic Engineering, Faculty of Biological Sciences, Islamic University, Kushtia-7003, Bangladesh"
}
],
"first_name": "Mohammad Abu Hena Mostofa",
"family_name": "Jamal",
"email": "jamalbtg@gmail.com",
"author_order": 6,
"ORCID": "http://orcid.org/0000-0003-0542-4323",
"corresponding": true,
"co_first_author": false,
"co_author": false,
"corresponding_author_info": "Mohammad Abu Hena Mostofa Jamal, Department of Biotechnology and\r\nGenetic Engineering, Faculty of Biological Sciences, Islamic University,\r\nKushtia-7003, Bangladesh, email: jamalbtg@gmail.com",
"article": 81
}
],
"views": 1346,
"downloads": 132,
"references": [
{
"id": 2293,
"serial_number": 1,
"pmc": null,
"reference": "Maru GB. Understanding the molecular mechanisms of cancer prevention by dietary phytochemicals: From experimental models to clinical trials. World Journal of Biological Chemistry 2016;7:88. https://doi.org/10.4331/wjbc.v7.i1.88.",
"DOI": null,
"article": 81
},
{
"id": 2294,
"serial_number": 2,
"pmc": null,
"reference": "Siegel RL, Miller KD, Jemal A. Cancer statistics, 2018. CA: A Cancer Journal for Clinicians 2018;68:7–30. https://doi.org/10.3322/caac.21442.",
"DOI": null,
"article": 81
},
{
"id": 2295,
"serial_number": 3,
"pmc": null,
"reference": "Sung H, Ferlay J, Siegel RL, Laversanne M, Soerjomataram I, Jemal A, et al. Global Cancer Statistics 2020: GLOBOCAN Estimates of Incidence and Mortality Worldwide for 36 Cancers in 185 Countries. CA Cancer J Clin 2021;71:209–49. https://doi.org/10.3322/CAAC.21660.",
"DOI": null,
"article": 81
},
{
"id": 2296,
"serial_number": 4,
"pmc": null,
"reference": "Miller KD, Nogueira L, Mariotto AB, Rowland JH, Yabroff KR, Alfano CM, et al. Cancer treatment and survivorship statistics, 2019. CA: A Cancer Journal for Clinicians 2019; 69:363–85.",
"DOI": null,
"article": 81
},
{
"id": 2297,
"serial_number": 5,
"pmc": null,
"reference": "Pucci C, Martinelli C, Ciofani G. Innovative approaches for cancer treatment: Current perspectives and new challenges. Ecancermedicalscience 2019;13. https://doi.org/10.3332/ecancer.2019.961.",
"DOI": null,
"article": 81
},
{
"id": 2298,
"serial_number": 6,
"pmc": null,
"reference": "Rahman F, Mahmood T Bin, Amin A, Alam R, Jharna JF, Samad A, et al. A multi-omics approach to reveal the key evidence of GDF10 as a novel therapeutic biomarker for breast cancer. Informatics in Medicine Unlocked 2020;21:100463. https://doi.org/10.1016/j.imu.2020.100463.",
"DOI": null,
"article": 81
},
{
"id": 2299,
"serial_number": 7,
"pmc": null,
"reference": "Intlekofer AM, Finley LWS. Metabolic signatures of cancer cells and stem cells. Nature Metabolism 2019;1:177–88. https://doi.org/10.1038/s42255-019-0032-0.",
"DOI": null,
"article": 81
},
{
"id": 2300,
"serial_number": 8,
"pmc": null,
"reference": "Phan LM, Yeung SCJ, Lee MH. Cancer metabolic reprogramming: importance, main features, and potentials for precise targeted anti-cancer therapies. Cancer Biology & Medicine 2014; 11:1.",
"DOI": null,
"article": 81
},
{
"id": 2301,
"serial_number": 9,
"pmc": null,
"reference": "De Berardinis RJ, Chandel NS. Fundamentals of cancer metabolism. Science Advances 2016;2. https://doi.org/10.1126/sciadv.1600200.",
"DOI": null,
"article": 81
},
{
"id": 2302,
"serial_number": 10,
"pmc": null,
"reference": "Pavlova NN, Thompson CB. The Emerging Hallmarks of Cancer Metabolism. Cell Metabolism 2016;23:27–47. https://doi.org/10.1016/j.cmet.2015.12.006.",
"DOI": null,
"article": 81
},
{
"id": 2303,
"serial_number": 11,
"pmc": null,
"reference": "Luengo A, Gui DY, Vander Heiden MG. Targeting Metabolism for Cancer Therapy. Cell Chemical Biology 2017;24:1161–80. https://doi.org/10.1016/j.chembiol.2017.08.028.",
"DOI": null,
"article": 81
},
{
"id": 2304,
"serial_number": 12,
"pmc": null,
"reference": "Abdul QA, Yu BP, Chung HY, Jung HA, Choi JS. Epigenetic modifications of gene expression by lifestyle and environment. Archives of Pharmacal Research 2017;40:1219–37. https://doi.org/10.1007/s12272-017-0973-3.",
"DOI": null,
"article": 81
},
{
"id": 2305,
"serial_number": 13,
"pmc": null,
"reference": "Saha SK, Islam SMR, Abdullah-Al-Wadud M, Islam S, Ali F, Park KS. Multiomics Analysis Reveals that GLS and GLS2 Differentially Modulate the Clinical Outcomes of Cancer. J Clin Med 2019;8.",
"DOI": null,
"article": 81
},
{
"id": 2306,
"serial_number": 14,
"pmc": null,
"reference": "Acharya S, Dutta S, Bose K. A distinct concerted mechanism of structural dynamism defines activity of human serine protease HtrA3. Biochemical Journal 2020;477:407. https://doi.org/10.1042/BCJ20190706.",
"DOI": null,
"article": 81
},
{
"id": 2307,
"serial_number": 15,
"pmc": null,
"reference": "Wysocka M, Wojtysiak A, Okońska M, Gruba N, Jarząb M, Wenta T, et al. Design and synthesis of new substrates of HtrA2 protease. Analytical Biochemistry 2015;475:44–52. https://doi.org/10.1016/j.ab.2015.01.013.",
"DOI": null,
"article": 81
},
{
"id": 2308,
"serial_number": 16,
"pmc": null,
"reference": "Darreh-Shori T, Rezaeianyazdi S, Lana E, Mitra S, Gellerbring A, Karami A, et al. Increased Active OMI/HTRA2 Serine Protease Displays a Positive Correlation with Cholinergic Alterations in the Alzheimer’s Disease Brain. Molecular Neurobiology 2019;56:4601. https://doi.org/10.1007/S12035-018-1383-3.",
"DOI": null,
"article": 81
},
{
"id": 2309,
"serial_number": 17,
"pmc": null,
"reference": "Chien J, Campioni M, Shridhar V, Baldi A. HtrA Serine Proteases as Potential Therapeutic Targets in Cancer. Current Cancer Drug Targets 2009;9:451–68. https://doi.org/10.2174/156800909788486704.",
"DOI": null,
"article": 81
},
{
"id": 2310,
"serial_number": 18,
"pmc": null,
"reference": "Williams BL, Seager NA, Gardiner JD, Pappas CM, Cronin MC, di San Filippo CA, et al. Chromosome 10q26-driven age-related macular degeneration is associated with reduced levels of HTRA1 in human retinal pigment epithelium. Proc Natl Acad Sci U S A 2021;118. https://doi.org/10.1073/PNAS.2103617118.",
"DOI": null,
"article": 81
},
{
"id": 2311,
"serial_number": 19,
"pmc": null,
"reference": "Zurawa-Janicka D, Skorko-Glonek J, Lipinska B. HtrA proteins as targets in therapy of cancer and other diseases. Expert Opinion on Therapeutic Targets 2010;14:665–79. https://doi.org/10.1517/14728222.2010.487867.",
"DOI": null,
"article": 81
},
{
"id": 2312,
"serial_number": 20,
"pmc": null,
"reference": "Baldi A, De Luca A, Morini M, Battista T, Felsani A, Baldi F, et al. The HtrA1 serine protease is down-regulated during human melanoma progression and represses growth of metastatic melanoma cells. Oncogene 2002;21:6684–8. https://doi.org/10.1038/sj.onc.1205911.",
"DOI": null,
"article": 81
},
{
"id": 2313,
"serial_number": 21,
"pmc": null,
"reference": "Chien J, Staub J, Hu S-I, Erickson-Johnson MR, Couch FJ, Smith DI, et al. A candidate tumor suppressor HtrA1 is downregulated in ovarian cancer. Oncogene 2004;23:1636–44. https://doi.org/10.1038/sj.onc.1207271.",
"DOI": null,
"article": 81
},
{
"id": 2314,
"serial_number": 22,
"pmc": null,
"reference": "Narkiewicz J, Klasa-Mazurkiewicz D, Zurawa-Janicka D, Skorko-Glonek J, Emerich J, Lipinska B. Changes in mRNA and protein levels of human HtrA1, HtrA2 and HtrA3 in ovarian cancer. Clinical Biochemistry 2008;41:561–9. https://doi.org/10.1016/j.clinbiochem.2008.01.004.",
"DOI": null,
"article": 81
},
{
"id": 2315,
"serial_number": 23,
"pmc": null,
"reference": "Faccio L, Fusco C, Chen A, Martinotti S, Bonventre J V., Zervos AS. Characterization of a novel human serine protease that has extensive homology to bacterial heat shock endoprotease HtrA and is regulated by kidney ischemia. Journal of Biological Chemistry 2000;275:2581–8. https://doi.org/10.1074/jbc.275.4.2581.",
"DOI": null,
"article": 81
},
{
"id": 2316,
"serial_number": 24,
"pmc": null,
"reference": "Suzuki Y, Imai Y, Nakayama H, Takahashi K, Takio K, Takahashi R. A serine protease, HtrA2, is released from the mitochondria and interacts with XIAP, inducing cell death. Molecular Cell 2001;8:613–21. https://doi.org/10.1016/S1097-2765(01)00341-0.",
"DOI": null,
"article": 81
},
{
"id": 2317,
"serial_number": 25,
"pmc": null,
"reference": "Narkiewicz J, Lapinska-Szumczyk S, Zurawa-Janicka D, Skorko-Glonek J, Emerich J, Lipinska B. Expression of human HtrA1, HtrA2, HtrA3 and TGF-β1 genes in primary endometrial cancer. Oncology Reports 2009;21:1529–37. https://doi.org/10.3892/or_00000385.",
"DOI": null,
"article": 81
},
{
"id": 2318,
"serial_number": 26,
"pmc": null,
"reference": "Hu XY, Xu YM, Chen XC, Ping H, Chen ZH, Zeng FQ. Immunohistochemical analysis of Omi/HtrA2 expression in prostate cancer and benign prostatic hyperplasia. APMIS 2006;114:893–8. https://doi.org/10.1111/j.1600-0463.2006.apm_271.x.",
"DOI": null,
"article": 81
},
{
"id": 2319,
"serial_number": 27,
"pmc": null,
"reference": "Lee SH, Lee JW, Kim HS, Kim SY, Park WS, Kim SH, et al. Immunohistochemical analysis of Omi/HtrA2 expression in stomach cancer. APMIS 2003;111:586–90. https://doi.org/10.1034/j.1600-0463.2003.1110508.x.",
"DOI": null,
"article": 81
},
{
"id": 2320,
"serial_number": 28,
"pmc": null,
"reference": "Rhodes DR, Yu J, Shanker K, Deshpande N, Varambally R, Ghosh D, et al. ONCOMINE: A Cancer Microarray Database and Integrated Data-Mining Platform. Neoplasia 2004;6:1–6. https://doi.org/10.1016/s1476-5586(04)80047-2.",
"DOI": null,
"article": 81
},
{
"id": 2321,
"serial_number": 29,
"pmc": null,
"reference": "Rhodes DR, Kalyana-Sundaram S, Mahavisno V, Varambally R, Yu J, Briggs BB, et al. Oncomine 3.0: Genes, pathways, and networks in a collection of 18,000 cancer gene expression profiles. Neoplasia 2007;9:166–80. https://doi.org/10.1593/neo.07112.",
"DOI": null,
"article": 81
},
{
"id": 2322,
"serial_number": 30,
"pmc": null,
"reference": "Tang Z, Li C, Kang B, Gao G, Li C, Zhang Z. GEPIA: A web server for cancer and normal gene expression profiling and interactive analyses. Nucleic Acids Research 2017;45:W98–102. https://doi.org/10.1093/nar/gkx24.",
"DOI": null,
"article": 81
},
{
"id": 2323,
"serial_number": 31,
"pmc": null,
"reference": "Li C, Tang Z, Zhang W, Ye Z, Liu F. GEPIA2021: integrating multiple deconvolution-based analysis into GEPIA. Nucleic Acids Research 2021;49:W242–6. https://doi.org/10.1093/NAR/GKAB418.",
"DOI": null,
"article": 81
},
{
"id": 2324,
"serial_number": 32,
"pmc": null,
"reference": "Chandrashekar DS, Bashel B, Balasubramanya SAH, Creighton CJ, Ponce-Rodriguez I, Chakravarthi BVSK, et al. UALCAN: A Portal for Facilitating Tumor Subgroup Gene Expression and Survival Analyses. Neoplasia (United States) 2017;19:649–58. https://doi.org/10.1016/j.neo.2017.05.002.",
"DOI": null,
"article": 81
},
{
"id": 2325,
"serial_number": 33,
"pmc": null,
"reference": "Szklarczyk D, Franceschini A, Wyder S, Forslund K, Heller D, Huerta-Cepas J, et al. STRING v10: Protein-protein interaction networks, integrated over the tree of life. Nucleic Acids Research 2015;43:D447–52. https://doi.org/10.1093/nar/gku1003.",
"DOI": null,
"article": 81
},
{
"id": 2326,
"serial_number": 34,
"pmc": null,
"reference": "Szklarczyk D, Franceschini A, SW-N acids, 2015 undefined. STRING v10: protein–protein interaction networks, integrated over the tree of life. AcademicOupCom n.d.",
"DOI": null,
"article": 81
},
{
"id": 2327,
"serial_number": 35,
"pmc": null,
"reference": "Cerami E, Gao J, Dogrusoz U, Gross BE, Sumer SO, Aksoy BA, et al. The cBio Cancer Genomics Portal: An open platform for exploring multidimensional cancer genomics data. Cancer Discovery 2012;2:401–4. https://doi.org/10.1158/2159-8290.CD-12-0095.",
"DOI": null,
"article": 81
},
{
"id": 2328,
"serial_number": 36,
"pmc": null,
"reference": "Gao J, Aksoy BA, Dogrusoz U, Dresdner G, Gross B, Sumer SO, et al. Integrative analysis of complex cancer genomics and clinical profiles using the cBioPortal. Science Signaling 2013;6. https://doi.org/10.1126/scisignal.2004088.",
"DOI": null,
"article": 81
},
{
"id": 2329,
"serial_number": 37,
"pmc": null,
"reference": "Lánczky A, Győrffy B. Web-Based Survival Analysis Tool Tailored for Medical Research (KMplot): Development and Implementation. J Med Internet Res 2021;23. https://doi.org/10.2196/27633.",
"DOI": null,
"article": 81
},
{
"id": 2330,
"serial_number": 38,
"pmc": null,
"reference": "Mizuno H, Kitada K, Nakai K, Sarai A. PrognoScan: a new database for meta-analysis of the prognostic value of genes. BMC Medical Genomics 2009;2:18. https://doi.org/10.1186/1755-8794-2-18.",
"DOI": null,
"article": 81
},
{
"id": 2331,
"serial_number": 39,
"pmc": null,
"reference": "Anaya J. OncoLnc: Linking TCGA survival data to mRNAs, miRNAs, and lncRNAs. PeerJ Computer Science 2016;2016:e67. https://doi.org/10.7717/peerj-cs.67.",
"DOI": null,
"article": 81
},
{
"id": 2332,
"serial_number": 40,
"pmc": null,
"reference": "R2: Genomics Analysis and Visualization Platform n.d. https://hgserver1.amc.nl/cgi-bin/r2/main.cgi.",
"DOI": null,
"article": 81
},
{
"id": 2333,
"serial_number": 41,
"pmc": null,
"reference": "Koster J, Molenaar JJ, Versteeg R. Abstract A2-45: R2: Accessible web-based genomics analysis and visualization platform for biomedical researchers. Cancer Research 2015;75:A2-45. https://doi.org/10.1158/1538-7445.TRANSCAGEN-A2-45.",
"DOI": null,
"article": 81
},
{
"id": 2369,
"serial_number": 42,
"pmc": null,
"reference": "Kuleshov M v., Jones MR, Rouillard AD, Fernandez NF, Duan Q, Wang Z, et al. Enrichr: a comprehensive gene set enrichment analysis web server 2016 update. Nucleic Acids Research 2016;44:W90–7. https://doi.org/10.1093/NAR/GKW377.",
"DOI": null,
"article": 81
},
{
"id": 2370,
"serial_number": 43,
"pmc": null,
"reference": "Hara K, Shiga A, Fukutake T, Nozaki H, Miyashita A, Yokoseki A, et al. Association of HTRA1 Mutations and Familial Ischemic Cerebral Small-Vessel Disease. New England Journal of Medicine 2009;360:1729–39. https://doi.org/10.1056/nejmoa0801560.",
"DOI": null,
"article": 81
},
{
"id": 2371,
"serial_number": 44,
"pmc": null,
"reference": "Altobelli E, Latella G, Morroni M, Licini C, Tossetta G, Mazzucchelli R, et al. Low HtrA1 expression in patients with long standing ulcerative colitis and colorectal cancer. Oncol Rep 2017;38:418–26.",
"DOI": null,
"article": 81
},
{
"id": 2372,
"serial_number": 45,
"pmc": null,
"reference": "Watanabe T, Kobunai T, Toda E, Yamamoto Y, Kanazawa T, Kazama Y, et al. Distal colorectal cancers with microsatellite instability (MSI) display distinct gene expression profiles that are different from proximal MSI cancers. Cancer Research 2006;66:9804–8. https://doi.org/10.1158/0008-5472.CAN-06-1163.",
"DOI": null,
"article": 81
},
{
"id": 2373,
"serial_number": 46,
"pmc": null,
"reference": "Hendrix ND, Wu R, Kuick R, Schwartz DR, Fearon ER, Cho KR. Fibroblast growth factor 9 has oncogenic activity and is a downstream target of Wnt signaling in ovarian endometrioid adenocarcinomas. Cancer Res 2006;66:1354–62. https://doi.org/10.1158/0008-5472.CAN-05-3694.",
"DOI": null,
"article": 81
},
{
"id": 2374,
"serial_number": 47,
"pmc": null,
"reference": "Shridhar V, Sen A, Chien J, Staub J, Avula R, Kovats S, et al. Identification of underexpressed genes in early- and late-stage primary ovarian tumors by suppression subtraction hybridization. Cancer Res 2002;62:262–70.",
"DOI": null,
"article": 81
},
{
"id": 2375,
"serial_number": 48,
"pmc": null,
"reference": "Kulis M, Esteller M. DNA Methylation and Cancer. vol. 70. Adv Genet; 2010. https://doi.org/10.1016/B978-0-12-380866-0.60002-2.",
"DOI": null,
"article": 81
},
{
"id": 2376,
"serial_number": 49,
"pmc": null,
"reference": "Men C, Chai H, Song X, Li Y, Du H, Ren Q. Identification of DNA methylation associated gene signatures in endometrial cancer via integrated analysis of dna methylation and gene expression systematically. Journal of Gynecologic Oncology 2017;28. https://doi.org/10.3802/jgo.2017.28.e83.",
"DOI": null,
"article": 81
},
{
"id": 2377,
"serial_number": 50,
"pmc": null,
"reference": "Wajed SA, Laird PW, DeMeester TR. DNA Methylation: An Alternative Pathway to Cancer. Annals of Surgery 2001;234:10. https://doi.org/10.1097/00000658-200107000-00003.",
"DOI": null,
"article": 81
},
{
"id": 2378,
"serial_number": 51,
"pmc": null,
"reference": "DeWan A, Liu M, Hartman S, Zhang SSM, Liu DTL, Zhao C, et al. HTRA1 promoter polymorphism in wet age-related macular degeneration. Science (1979) 2006;314:989–92. https://doi.org/10.1126/science.1133807.",
"DOI": null,
"article": 81
},
{
"id": 2379,
"serial_number": 52,
"pmc": null,
"reference": "Zumbrunn J, Trueb B. Primary structure of a putative serine protease specific for IGF-binding proteins. FEBS Letters 1996;398:187–92. https://doi.org/10.1016/S0014-5793(96)01229-X.",
"DOI": null,
"article": 81
},
{
"id": 2380,
"serial_number": 53,
"pmc": null,
"reference": "Schillinger J, Severin K, Kaschani F, Kaiser M, Ehrmann M. HTRA1-Dependent Cell Cycle Proteomics. Journal of Proteome Research 2018;17:2679–94. https://doi.org/10.1021/acs.jproteome.8b00129.",
"DOI": null,
"article": 81
},
{
"id": 2381,
"serial_number": 54,
"pmc": null,
"reference": "Li W, Srinivasula SM, Chai J, Li P, Wu JW, Zhang Z, et al. Structural insights into the pro-apoptotic function of mitochondrial serine protease htra2/omi. Nature Structural Biology 2002;9:436–41.",
"DOI": null,
"article": 81
},
{
"id": 2382,
"serial_number": 55,
"pmc": null,
"reference": "Zurawa-Janicka D, Kobiela J, Galczynska N, Stefaniak T, Lipinska B, Lachinski A, et al. Changes in expression of human serine protease HtrA1, HtrA2 and HtrA3 genes in benign and malignant thyroid tumors. Oncology Reports 2012;28:1838–44. https://doi.org/10.3892/or.2012.1988.",
"DOI": null,
"article": 81
},
{
"id": 2383,
"serial_number": 56,
"pmc": null,
"reference": "Jensen LJ, Kuhn M, Stark M, Chaffron S, Creevey C, Muller J, et al. STRING 8 – A global view on proteins and their functional interactions in 630 organisms. Nucleic Acids Research 2009;37. https://doi.org/10.1093/nar/gkn760.",
"DOI": null,
"article": 81
},
{
"id": 2384,
"serial_number": 57,
"pmc": null,
"reference": "Athanasios A, Charalampos V, Vasileios T, Ashraf G. Protein-Protein Interaction (PPI) Network: Recent Advances in Drug Discovery. Current Drug Metabolism 2017; 18:5–10.",
"DOI": null,
"article": 81
},
{
"id": 2385,
"serial_number": 58,
"pmc": null,
"reference": "Martin GS. Cell signaling and cancer. Cancer Cell, vol. 4, Cell Press; 2003, p. 167–74. https://doi.org/10.1016/S1535-6108(03)00216-2.",
"DOI": null,
"article": 81
},
{
"id": 2386,
"serial_number": 59,
"pmc": null,
"reference": "Sever R, Brugge JS. Signal transduction in cancer. Cold Spring Harbor Perspectives in Medicine 2015;5. https://doi.org/10.1101/cshperspect.a006098.",
"DOI": null,
"article": 81
},
{
"id": 2387,
"serial_number": 60,
"pmc": null,
"reference": "Zurawa-Janicka D, Kobiela J, Slebioda T, Peksa R, Stanislawowski M, Wierzbicki PM, et al. Expression of HtrA genes and its association with microsatellite instability and survival of patients with colorectal cancer. International Journal of Molecular Sciences 2020;21. https://doi.org/10.3390/ijms21113947.",
"DOI": null,
"article": 81
},
{
"id": 2388,
"serial_number": 61,
"pmc": null,
"reference": "Hu Q, Myers M, Fang W, Yao M, Brummer G, Hawj J, et al. Role of ALDH1A1 and HTRA2 expression in CCL2/CCR2-mediated breast cancer cell growth and invasion. Biol Open 2019;8.",
"DOI": null,
"article": 81
},
{
"id": 2389,
"serial_number": 62,
"pmc": null,
"reference": "Altobelli E, Angeletti PM, Morroni M, Profeta VF. HtrA1 as a promising tissue marker in cancer: A meta-analysis. BMC Cancer 2018;18. https://doi.org/10.1186/s12885-018-4041-2.",
"DOI": null,
"article": 81
},
{
"id": 2390,
"serial_number": 63,
"pmc": null,
"reference": "Zhang X, Xu Q, Yang L, Lai Y, Zhang Z, Han C, et al. The genes slyA, STM3120 and htrA are required for the anticancer ability of VNP20009. Oncotarget 2016;7:81187–96. https://doi.org/10.18632/oncotarget.13217.",
"DOI": null,
"article": 81
},
{
"id": 2391,
"serial_number": 64,
"pmc": null,
"reference": "Zhang Y, Xu H, Frishman D. Genomic determinants of somatic copy number alterations across human cancers. Hum Mol Genet 2016;25:1019–30. https://doi.org/10.1093/hmg/ddv623.",
"DOI": null,
"article": 81
},
{
"id": 2392,
"serial_number": 65,
"pmc": null,
"reference": "Shlien A, Malkin D. Copy number variations and cancer. Genome Med 2009;1:62. https://doi.org/10.1186/gm62.",
"DOI": null,
"article": 81
},
{
"id": 2393,
"serial_number": 66,
"pmc": null,
"reference": "Zhou L, Baba Y, Kitano Y, Miyake K, Zhang X, Yamamura K, et al. KRAS, BRAF, and PIK3CA mutations, and patient prognosis in 126 pancreatic cancers: pyrosequencing technology and literature review. Medical Oncology 2016;33. https://doi.org/10.1007/s12032-016-0745-9.",
"DOI": null,
"article": 81
},
{
"id": 2394,
"serial_number": 67,
"pmc": null,
"reference": "Sclafani F, Wilson SH, Cunningham D, Gonzalez De Castro D, Kalaitzaki E, Begum R, et al. Analysis of KRAS, NRAS, BRAF, PIK3CA and TP53 mutations in a large prospective series of locally advanced rectal cancer patients. International Journal of Cancer 2020;146:94–102. https://doi.org/10.1002/ijc.32507.",
"DOI": null,
"article": 81
},
{
"id": 2395,
"serial_number": 68,
"pmc": null,
"reference": "Li A, Schleicher SM, Andre F, Mitri ZI. Genomic Alteration in Metastatic Breast Cancer and Its Treatment. American Society of Clinical Oncology Educational Book 2020;40:30–43. https://doi.org/10.1200/edbk_280463.",
"DOI": null,
"article": 81
},
{
"id": 2396,
"serial_number": 69,
"pmc": null,
"reference": "Roock W De, Vriendt V De, Normanno N, Ciardiello F, Tejpar S. KRAS, BRAF, PIK3CA, and PTEN mutations: Implications for targeted therapies in metastatic colorectal cancer. The Lancet Oncology 2011;12:594–603. https://doi.org/10.1016/S1470-2045(10)70209-6.",
"DOI": null,
"article": 81
},
{
"id": 2397,
"serial_number": 70,
"pmc": null,
"reference": "Narkiewicz J, Klasa-Mazurkiewicz D, Zurawa-Janicka D, Skorko-Glonek J, Emerich J, Lipinska B. Changes in mRNA and protein levels of human HtrA1, HtrA2 and HtrA3 in ovarian cancer. Clinical Biochemistry 2008;41:561–9. https://doi.org/10.1016/J.CLINBIOCHEM.2008.01.004.",
"DOI": null,
"article": 81
},
{
"id": 2398,
"serial_number": 71,
"pmc": null,
"reference": "Zurawa-Janicka D, Skorko-Glonek J, Lipinska B. HtrA proteins as targets in therapy of cancer and other diseases.2010;14:665–79. https://doi.org/10.1517/14728222.2010.487867.",
"DOI": null,
"article": 81
},
{
"id": 2399,
"serial_number": 72,
"pmc": null,
"reference": "Laraia L, McKenzie G, Spring DR, Venkitaraman AR, Huggins DJ. Overcoming Chemical, Biological, and Computational Challenges in the Development of Inhibitors Targeting Protein-Protein Interactions. Chemistry and Biology 2015;22:689–703. https://doi.org/10.1016/j.chembiol.2015.04.019.",
"DOI": null,
"article": 81
},
{
"id": 2400,
"serial_number": 73,
"pmc": null,
"reference": "Altobelli E, Marzioni D, Lattanzi A, Angeletti PM. HtrA1: Its future potential as a novel biomarker for cancer. Oncology Reports 2015;34:555–66. https://doi.org/10.3892/OR.2015.4016/DOWNLOAD.",
"DOI": null,
"article": 81
},
{
"id": 2401,
"serial_number": 74,
"pmc": null,
"reference": "Xia J, Wang F, Wang L, Fan Q. Elevated serine protease HtrA1 inhibits cell proliferation, reduces invasion, and induces apoptosis in esophageal squamous cell carcinoma by blocking the nuclear factor-κB signaling pathway. Tumour Biol 2013;34:317–28. https://doi.org/10.1007/S13277-012-0553-6.",
"DOI": null,
"article": 81
},
{
"id": 2402,
"serial_number": 75,
"pmc": null,
"reference": "Lee SH, Lee JW, Kim HS, Kim SY, Park WS, Kim SH, et al. Immunohistochemical analysis of Omi/HtrA2 expression in stomach cancer. APMIS 2003;111:586–90. https://doi.org/10.1034/J.1600-0463.2003.1110508.X.",
"DOI": null,
"article": 81
},
{
"id": 2403,
"serial_number": 76,
"pmc": null,
"reference": "Meurette O, Mehlen P. Notch Signaling in the Tumor Microenvironment. Cancer Cell 2018;34:536–48. https://doi.org/10.1016/j.ccell.2018.07.009.",
"DOI": null,
"article": 81
},
{
"id": 2404,
"serial_number": 77,
"pmc": null,
"reference": "Aithal MGS, Rajeswari N. Role of Notch signalling pathway in cancer and its association with DNA methylation. Journal of Genetics 2013;92:667–75. https://doi.org/10.1007/s12041-013-0284-5.",
"DOI": null,
"article": 81
},
{
"id": 2405,
"serial_number": 78,
"pmc": null,
"reference": "Wörthmüller J, Rüegg C. The crosstalk between FAK and Wnt signaling pathways in cancer and its therapeutic implication. International Journal of Molecular Sciences 2020;21:1–23. https://doi.org/10.3390/ijms21239107.",
"DOI": null,
"article": 81
},
{
"id": 2406,
"serial_number": 79,
"pmc": null,
"reference": "Oka C, Saleh R, Bessho Y, Reza HM. Interplay between HTRA1 and classical signalling pathways in organogenesis and diseases. Saudi Journal of Biological Sciences 2022; 29:1919–27.",
"DOI": null,
"article": 81
},
{
"id": 2407,
"serial_number": 80,
"pmc": null,
"reference": "Pruefer FG, Lizarraga F, Maldonado V, Melendez-Zajgla J. Participation of Omi Htra2 serine-protease activity in the apoptosis induced by cisplatin on SW480 colon cancer cells. Journal of Chemotherapy 2008;20:348–54. https://doi.org/10.1179/JOC.2008.20.3.348.",
"DOI": null,
"article": 81
},
{
"id": 2408,
"serial_number": 81,
"pmc": null,
"reference": "Altobelli E, Marzioni D, Lattanzi A, Angeletti PM. HtrA1: Its future potential as a novel biomarker for cancer. Oncology Reports 2015;34:555–66. https://doi.org/10.3892/or.2015.4016.",
"DOI": null,
"article": 81
},
{
"id": 2409,
"serial_number": 82,
"pmc": null,
"reference": "Miyamoto M, Takano M, Iwaya K, Shinomiya N, Goto T, Kato M, et al. High-temperature-required protein A2 as a predictive marker for response to chemotherapy and prognosis in patients with high-grade serous ovarian cancers. British Journal of Cancer 2015;112:739–44. https://doi.org/10.1038/bjc.2015.1",
"DOI": null,
"article": 81
},
{
"id": 2410,
"serial_number": 83,
"pmc": null,
"reference": "Xia J, Wang F, Wang L, Fan Q. Elevated serine protease HtrA1 inhibits cell proliferation, reduces invasion, and induces apoptosis in esophageal squamous cell carcinoma by blocking the nuclear factor-κB signaling pathway. Tumor Biology 2013;34:317–28. https://doi.org/10.1007/s13277-012-0553-6",
"DOI": null,
"article": 81
},
{
"id": 2411,
"serial_number": 84,
"pmc": null,
"reference": "Wu L, Li X, Li Z, Cheng Y, Wu F, Lv C, et al. HtrA serine proteases in cancers: A target of interest for cancer therapy. Biomedicine & Pharmacotherapy 2021;139:111603. https://doi.org/10.1016/J.BIOPHA.2021.111603",
"DOI": null,
"article": 81
}
]
},
{
"id": 79,
"slug": "178-1647728954-micro-rna-evaluation-specification-and-stabilization-study-in-mixednon-mixed-body-fluids-as-a-specific-molecular-marker",
"featured": false,
"slider": false,
"issue": "Vol5 Issue2",
"type": "original_article",
"manuscript_id": "178-1647728954",
"recieved": "2022-02-28",
"revised": null,
"accepted": "2022-04-12",
"published": "2022-04-17",
"pdf_file": "https://jabet.bsmiab.org/media/pdf_file/2023/31/178-1647728954.pdf",
"title": "Micro-RNA evaluation, specification, and stabilization study in mixed/non-mixed body fluids as a specific molecular marker",
"abstract": "<p>Body fluids are frequently recovered by forensic investigators from crime scenes, and their identification is an important aspect of forensic case analysis. Determining the type and origin of human fluids recovered at a crime scene will give essential information for crime scene reconstruction by establishing a link between sample donors and actual criminal activity. The expression levels of microRNAs (miRNAs) such as miR-10b, miR-135b, miR-16, miR-126, miR-124-3p, and miR-372 in seminal fluids, blood, vaginal fluid stains, and their mixture, were measured using a quantitative real-time PCR technique. Using SNORD-47 as a reference gene, the target genes’ identification and stability were assessed. miR-10b and miR-135b were expressed at higher levels in seminal fluids stains than in vaginal secretion stains; miR-124-3p and miR-372 were expressed at higher levels in vaginal stains than in seminal fluids stains; miR-16 and miR-126 were expressed at a higher level in bloodstains than in both seminal fluids and vaginal stains, and six miRNAs were expressed in seminal fluids/vaginal/blood mix stains. In conclusion, the results indicate that the expression levels of miR-10b and miR-135b (seminal fluids), miR-124-3p and miR-372 (vaginal secretion), and miR-16 and miR-126 (blood) were higher in these samples compared to the housekeeping gene SNORD-47.</p>",
"journal_reference": "J Adv Biotechnol Exp Ther. 2022; 5(2): 347-357.",
"academic_editor": "Md Jamal Uddin, PhD; ABEx Bio-Research Center, Dhaka, Bangladesh",
"cite_info": "Al-Mawlah YH, Naji MZ, et al. Micro-RNA evaluation, specification, and stabilization study in mixed/non-mixed body fluids as a specific molecular marker. J Adv Biotechnol Exp Ther. 2022; 5(2): 347-357.",
"keywords": [
"RT-qPCR",
"Body fluids identification",
"Body fluid’s biomarker",
"Reference genes",
"miRNA"
],
"DOI": "10.5455/jabet.2022.d120",
"sections": [
{
"section_number": 1,
"section_title": "INTRODUCTION",
"body": "<p>In various incidents, including sexual assaults, stains might be a combination of different body fluids, such as seminal fluids and vaginal material, or blood and saliva. Even though several procedures for effectively resolving DNA mixtures exist, there are presently no analytical methods for resolving the mixing of physiological fluids. RNA analysis is becoming increasingly common, with micro-RNAs (miRNA) and messenger RNA (mRNA) being used to identify body fluids [<a href=\"#r-1\">1–3</a>].<br />\r\nmiRNAs are small RNA structures, evolutionarily conserved non-coding RNA (about 20–25 nt) plays an essential regulative role in many cellular processes. miRNAs can downregulate gene expression by base-pairing with the 3´ untranslated regions (3´UTR) of target messenger RNAs (mRNAs) and miRNA mediated regulation is now acknowledged to represent a new instance of regulatory control over gene expression programs in many organisms [<a href=\"#r-4\">4</a>].<br />\r\nThe main role of miRNA is negatively regulating gene expression by silencing (blocking) the messenger RNA or degrading it, miRNAs suppress gene expression based on their complementarity to a part of one or more mRNAs, usually at a site in the 3′-UTR. The annealing of the miRNA to the target mRNA inhibits protein translation. In some cases, the formation of dsRNA through the binding of miRNA triggers the degradation of the mRNA transcript, although, in other cases, it is thought that the miRNA complex blocks the protein translation machinery or otherwise prevents protein translation without causing the mRNA to be degraded [<a href=\"#r-5\">5</a>].<br />\r\nThe study of mRNA and miRNA expressions in bodily fluid, particularly in the last decade, has been a key emphasis. It can generate a DNA profile with evidential strength and provide important information on the origin of the bodily fluid. miRNAs are known to regulate gene expression inside the cells that make them, and they can also be released as extracellular molecules to regulate other cells or interact between cells [<a href=\"#r-6\">6</a>]. miRNAs are expressed differently in various cell types, according to their expression levels, suggesting the potential application of miRNAs in identifying cell types and tissues [<a href=\"#r-7\">7</a>]. One of the major challenges in utilizing miRNAs as body fluid identification markers are their stability inside the samples. Seminal fluids can be detected on materials or clothes in sexual assault cases, and they may also be collected from the victim’s body. Vaginal secretions are one of the most important forensically relevant bodily fluids [<a href=\"#r-4\">4</a>]. Vaginal secretions, unlike other body fluids, lack specific proteins that can be used to identify them with traditional protein-depending on methods, making their detection impossible. miRNAs have recently been explored as an alternative tool for the identification of forensic body fluids [<a href=\"#r-8\">8</a>].<br />\r\nIt has been suggested that miRNAs can be employed as potential markers for body fluid recognition in forensic science. For instance, previous studies reported miRNA markers that could be used to detect seminal fluids are miR-10b and miR-135b and vaginal secretions were miR-124-3p and miR-372 [<a href=\"#r-4\">4</a>,<a href=\"#r-7\">7–10</a>]<sup>. </sup>Meanwhile, another study showed that miR-16 and miR-451 could be used as biomarkers for bloodstain [<a href=\"#r-9\">9,10</a>]. Therefore, the goal of this study is to see how mixed samples or stains such as seminal fluids and vaginal secretions, blood and vaginal secretions, and blood and seminal fluids affected the expression of miR-10b and miR-135b, miR-124-3p and miR-372, miR-16, and miR-126 in fresh and dried samples.</p>"
},
{
"section_number": 2,
"section_title": "MATERIALS AND METHODS",
"body": "<p><strong>Collection and preparation of samples</strong><br />\r\nHealthy volunteers provided five samples of seminal fluid, vaginal secretions, and bloodstain. Male donors donated freshly ejaculated sperm in sealed Falcon tubes, which were subsequently transferred to sterile cotton swabs. Vaginal secretions were obtained using a sterile cotton-tipped swab, and the mixture of seminal fluids and vaginal secretions were mixed with various amounts, while venipuncture was used to draw blood into EDTA vials. All samples were dried at room temperature in the dark for two weeks before being processed for RNA extraction.<br />\r\nEvery volunteer was introduced with written informed permission. This research received ethical approval (DSM/HO-16642) for scientific research from the Ministry of Health MOH and Ministry of Higher Education and Scientific Research (MOHESR) ethics committees in Iraq.</p>\r\n\r\n<p> </p>\r\n\r\n<p><strong>Selection of miRNA</strong><br />\r\nmiR-10b and miR-135b were chosen for seminal fluids, whereas miR-124-3p and miR-372 were chosen for vaginal secretions, and miR-16 and miR-126 were selected for bloodstain [<a href=\"#r-4\">4</a>,<a href=\"#r-7\">7–10</a>], and all markers for mixed seminal fluids/vaginal secretions, blood stains/vaginal secretions and bloodstains/seminal fluids. For all samples, SNORD-47 was chosen as the housekeeping gene to normalize miRNA expression levels.</p>\r\n\r\n<p> </p>\r\n\r\n<p><strong>RNA analysis</strong><br />\r\nTotal RNA was extracted using the RNAzol RT reagent (Sigma-Aldrich/USA), as directed by the manufacturer. The yield and integrity of RNA were measured.<br />\r\nA housekeeping gene was used in a normalization strategy to calculate the sample’s RQ (Relative Quantification) [<a href=\"#r-11\">11</a>]. SNORD-47 was previously characterized as a housekeeping transcript for miRNA normalization in the context of expression measurement in a variety of biological samples [<a href=\"#r-2\">12</a>]. Other housekeeping genes for forensically related body fluids have been proposed and should be considered in the future [<a href=\"#r-3\">13</a>]. A Microspectrophotometer nanodrop (Biodrop / UK) device was used to evaluate the concentration and purity of samples at 260 nm and 280 nm. Pure RNA A260/280 ratios typically range from 1.8 to 2.2. Total RNA was isolated from three body fluids samples and utilized in the MiRNA All-In-One cDNA Synthesis Kit from abm / USA for cDNA synthesis.<br />\r\nThe Bright Green miRNA qPCR Master Mix reverse transcription and RT-qPCR experiments were performed according to the manufacturer’s instructions. The expression level of the reference gene was measured in triplicates in all samples with the negative control. RT-PCR mixture was in total 20 μl including 10 μl (1x) Bright Green miRNA qPCR Master Mix, 300 nM for each primer, 3 μl cDNA product. thermocycler set up was 95̊C for 10 minutes, followed by 40 cycles of 95̊C for 10 seconds, followed by 63̊C for 15 seconds, and a 30-second extension at 72̊C.</p>\r\n\r\n<p> </p>\r\n\r\n<p><strong>Statistical analysis</strong><br />\r\nSPSS statistical program for social sciences was used to analyze the data (version 20.0 for Windows, SPSS, Chicago, IL, USA) [<a href=\"#r-4\">14</a>].</p>"
},
{
"section_number": 3,
"section_title": "RESULTS",
"body": "<p><strong>Expression of miRNA</strong><br />\r\nSNORD-47 was used to compare the miRNA targets that were examined. The average CT value was calculated using the triplicates of each sample. CT = CT (Target miRNA) –CT (Endogenous Control) was computed by subtracting the average CT for the endogenous control from the target miRNA of interest [<a href=\"#r-11\">11</a>]. The expression of miRNAs target genes in the mixture of vaginal secretions and seminal fluid samples were varied according to fluids concentration which was prepared as opposite concentrations sorting as shown in <a href=\"#Table-1\">Table 1</a>.<br />\r\nMiR-10b and miR-135b were expressed at higher levels in the presence of seminal fluids and decreased with seminal fluids concentration decreasing until reach zero expression when the concentration of the seminal fluid is zeroed. while miR-124-3p and miR-372 were also expressed at higher levels in the presence of vaginal secretions stains than in seminal fluids stains as shown in in <a href=\"#Table-1\">Table 1</a>. The analysis of mixed blood/seminal fluids stains showed that miR-16 and miR-126 were expressed at higher levels in the presence of bloodstains and decreased with blood concentration decreasing until reach zero expression when the blood concentration is zeroed, the same for miR-10b and miR-135b in seminal fluids stains (<a href=\"#Table-2\">Table 2</a>). MiR-16 and miR-126 in a mixture of bloodstain and vaginal secretions were also expressed only in presence of bloodstain, and the same results for miR-124-3p and miR-372 were expressed only in presence of vaginal secretion stains (<a href=\"#Table-3\">Table 3</a>). Six miRNAs were expressed in seminal fluids/vaginal secretions, blood/seminal fluids and blood/vaginal secretion as a mixed stain but show lower expression levels in stored samples than in fresh samples (<a href=\"#Table-1\">Table 1-3</a>).</p>\r\n\r\n<div id=\"Table-1\">\r\n<p><a href=\"https://jabet.bsmiab.org/table/178-1647728954-table1/\">Table-1</a><strong>Table 1. </strong>The average of Ct and ΔCt values for mixed seminal fluid and vaginal secretion stain.</p>\r\n</div>\r\n\r\n<div id=\"Table-2\">\r\n<p><a href=\"https://jabet.bsmiab.org/table/178-1647728954-table2/\">Table-2</a><strong>Table 2.</strong> The average of Ct and ΔCt values for mixed blood and seminal fluids stain.</p>\r\n</div>\r\n\r\n<div id=\"Table-3\">\r\n<p><a href=\"https://jabet.bsmiab.org/table/178-1647728954-table3/\">Table-3</a><strong>Table 3. </strong>The average of Ct and ΔCt values for mixed blood and vaginal secretion stain.</p>\r\n\r\n<p> </p>\r\n</div>\r\n\r\n<p><strong>Stability of miRNAs</strong><br />\r\nA mixture of bodily fluid stains was incubated at room temperature for two weeks in a dark and dry environment to examine the stability of miRNAs.<br />\r\nThe purpose of this test is to investigate the potential of miRNAs to be used as markers for certain bodily fluids and to examine the durability of miRNAs in samples over time. The specificity of targeted miRNAs is important, since being used to detect the most unique and specific miRNA to the targeted body fluids. However, not all miRNA has the same quantity in body fluids. Besides, a variety of events such as different diseases or metabolic pathways affect the number of miRNAs in fluids [<a href=\"#r-15\">15</a>].<br />\r\n<a href=\"#figure1\">Figure 1A</a> shows the gene expression of miRNAs with fresh stains that have not been stored. The results of this research demonstrate that the expression levels of miR-10b and miR-135b (seminal fluids), miR-124-3p, and miR-372 (vaginal secretion) were higher in these samples compared to the gene expression levels of mixed seminal fluids/vaginal secretions stain that was kept in the dark at room temperature for two weeks (treated sample) which show lower fold expression (<a href=\"#figure1\">Figure 1B</a>).<br />\r\nReal-time PCR shows magnificent results of microRNA genes of vaginal secretion (miR-124-3p and miR-372) in samples M1 and Mt1 (<a href=\"#figure1\">Figure 1</a>A and B), while all vaginal secretions showed no Ct values in contrast to microRNA genes of seminal fluids (miR-10b and miR135b) in sample M6 and Mt6, that make miR-10b and miR135b are a very suitable marker for seminal fluids also for miR-124-3p and miR-372 are very suitable for vaginal secretions.<br />\r\nFor treated mixed sample seminal fluid/vaginal secretion which was stored in dark at room temperature for two weeks, the results are shown in <a href=\"#figure1\">Figure 1B</a>, the sample Mt2 where the concentration 20ng of vaginal secretion RNA concentration, the expression fold was very low for both miR-372 and miR-124-3p and that may be due to the majority of microRNA in vaginal secretion are extracellularly making it more affected by environmental conditions during the time comparing to microRNA of seminal fluids which were found as extra and intracellular (inside strong disulfide structure of semen) which were more protected to withstand environmental conditions [<a href=\"#r-16\">16</a>].<br />\r\nA recent study on a variety of samples including seminal fluids, saliva, blood, and menstrual blood indicated that miR-10b and miR-135b were presented in higher levels in seminal fluids, although they were stored for a year in the dark at room temperature [<a href=\"#r-17\">17</a>].</p>\r\n\r\n<div id=\"figure1\">\r\n<figure class=\"image\"><img alt=\"\" src=\"/media/article_images/2023/47/07/178-1647728954-Figure1.jpg\" width=\"500\" />\r\n<figcaption><strong>Figure 1. </strong>Gene expression values of mixed sample (seminal fluid/vaginal secretion). A) Untreated fresh sample. B) Treated sample (two weeks at room temperature and dark).</figcaption>\r\n</figure>\r\n\r\n<p> </p>\r\n</div>\r\n\r\n<p><strong>Stability of miRNAs expression in mixed fluids</strong><br />\r\nAnalysis of miRNAs in mixed blood/seminal fluids fresh samples showed that miR-16 and miR-126 expression levels were higher in bloodstain while the expression levels of miR-10b and miR-135b were higher in seminal fluids stain (<a href=\"#figure2\">Figure 2A</a>), further analysis showed that miRNAs are detectable as a unique miRNA gene to bloodstain as well as the miR-10b and miR-135b to seminal fluids even after storage in dark at room temperature (<a href=\"#figure2\">Figure 2B</a>), it has been found that the expression levels of miR-451, miR-150 and miR-126 were unchanged and very stable even after two weeks of storage in dark at room temperature (gene expression still about 1.5. for miR-150 and miR-451, while miR-126 expression decreased from 1.7 in fresh to 1.5 in treated samples), meanwhile, the expression levels of miR-16 was lower but still detectable (1.3) in fresh samples and 0.68 in treated samples) [<a href=\"#r-18\">18</a>].<br />\r\n<br />\r\nBlood/vaginal secretion stain mixture at its fresh untreated state showed that miR-16 and miR-126 (bloodstain) and miR-124-3p and miR-372 (vaginal secretion stain) were expressed higher (<a href=\"#figure3\">Figure 3A</a>), the treated mixed samples which were stored in dark at room temperature also showed stable expression (<a href=\"#figure3\">Figure 3B</a>), while, miR-16 and miR-126 genes were still detectable and uniquely not expressed in the absence of bloodstain, while miR-124-3p and miR-372 were also detected as unique miRNA gene to vaginal secretion stain but with lower expression level in comparison to miRNAs gene of vaginal secretion in blood/seminal fluids mixture.<br />\r\nAnother study indicated the absence of miR-124-3p, miR-214 and miR-891in menstrual blood after storing for 1 month at room temperature under light [<a href=\"#r-19\">19</a>].<br />\r\nAt a crime scene, the ability to distinguish between various kinds of bodily fluids is also critical. A prior investigation using Raman spectroscopy failed to distinguish between cat, dog, and human blood samples [<a href=\"#r-20\">20</a>]. Dry traces of bodily fluids such as blood, seminal fluids, saliva, vaginal fluid, and perspiration were analyzed using Raman microspectroscopy, which uses non-actinic (non-destructive) near-infrared light [<a href=\"#r-21\">21</a>]. According to studies of miRNA stability in various settings, miRNAs tend to degrade in samples exposed to strong chemicals and environmental conditions [<a href=\"#r-22\">22</a>]. Zubakov and his colleagues found that the stability of miRNAs in old samples did not seem to be deteriorated when samples were stored at room temperature for one year [<a href=\"#r-23\">23</a>].<br />\r\nAs shown in <a href=\"#figure4\">Figure 4A</a> the expression levels of vaginal secretions miRNA in mixed samples (vaginal secretion/seminal fluids) which miR-124-3p and miR-372 decreased significantly between fresh and treated samples as following significance: miR-124-3p: 0.009 and miR-372: 0.008 at P-value ≤ 0.05. This means all miRNA markers of vaginal secretion in mixed samples were affected similarly by storing and the decreases were about 0.3-0.5 for vaginal secretion miRNA genes showing that miR-372 and miR-124-3p were not stable for storing, hence, it is not suitable to be chosen as a marker for vaginal secretion fluids.<br />\r\nmiR-10b and miR-135b in seminal fluids show no significant changes as follow: miR-10b: 0.089, miR135b: 0.090 at (P≤ 0.05), which increase the chance of miR-10b and miR-135b as a specific biomarker to seminal fluids stains.<br />\r\n<br />\r\n<a href=\"#figure4\">Figure 4B</a> shows that the gene`s expression of mixed miRNA genes which were miR-10b, miR-135b for seminal fluids and miR-16, miR-126 for blood samples were showed no significant change at P ≤ 0.05 in treated samples with the following significance: miR-10b: 0.323 and miR135b: 0.110) comparing to fresh samples, the same results shown for miR-16 and miR-126 for bloodstain were also showed no significant change as follow: miR-16: 0.526 and miR-126: 0.954. This means all miRNA markers in mixed samples (blood/seminal fluids) were stable after storing due to no significant change between fresh and treated mixed samples, except miR-126 in blood samples which shows higher stability with almost no change in its levels in treated samples, suggesting that miR-126 is the most stable one after storing and that increases the chance of being selected as a marker for blood samples. <a href=\"#figure4\">Figure 4C</a> show the gene’s expression fold of mixed (blood / vaginal secretion) miRNA genes which were miR-124-3p and miR-372 for vaginal secretion were significantly decreased at (P ≤ 0.05) in treated samples (miR-124-3p: 0.045 and miR-372: 0.032) in contrast to fresh samples, while miR-16 and miR-126 for bloodstain were showed no significant changes (miR-16: 0.323, miR-126: 0.405) between fresh and treated samples showing that all miRNA markers in mixed samples were affected by storing except the miR-126 and miR-16 genes in blood samples, implying its higher stability, thus, miR-126 and miR-16 are the most stable miRNAs after storing which increases their chance to be.</p>\r\n\r\n<div id=\"figure2\">\r\n<figure class=\"image\"><img alt=\"\" height=\"167\" src=\"/media/article_images/2023/47/07/178-1647728954-Figure2.jpg\" width=\"500\" />\r\n<figcaption><strong>Figure 2. </strong>Gene expression values of mixed sample (blood/seminal fluid). A) Untreated fresh sample. B) Treated sample (two weeks at room temperature and dark).</figcaption>\r\n</figure>\r\n</div>\r\n\r\n<div id=\"figure3\">\r\n<figure class=\"image\"><img alt=\"\" height=\"176\" src=\"/media/article_images/2023/47/07/178-1647728954-Figure3.jpg\" width=\"500\" />\r\n<figcaption><strong>Figure 3. </strong>Gene expression values of mixed sample (blood/vaginal secretion). A) Untreated fresh sample. B) Treated sample (two weeks at room temperature and dark).</figcaption>\r\n</figure>\r\n</div>\r\n\r\n<div id=\"figure4\">\r\n<figure class=\"image\"><img alt=\"\" height=\"386\" src=\"/media/article_images/2023/47/07/178-1647728954-Figure4.jpg\" width=\"500\" />\r\n<figcaption><strong>Figure 4.</strong> miRNAs gene expression fold differed significancy between fresh and treated mixed samples, A) Seminal fluids and vaginal secretions (Sig. of miR-10b: 0.089, miR135b: 0.090, miR-124-3p: 0.009 and miR-372: 0.008, P value ≤ 0.05). B) Blood and seminal fluids (Sig. of miR-16:0.526, miR-126:0.954, miR-10b: 0.323, miR135b: 0.110, P value ≤ 0.05). C) Blood and vaginal secretion (Sig. of miR-16:0.82, miR-126:0.954, miR-124-3p: 0.21, miR-372: 0.198, P value ≤ 0.05).</figcaption>\r\n</figure>\r\n</div>"
},
{
"section_number": 4,
"section_title": "DISCUSSIONS",
"body": "<p>The main idea of this study was to evaluate the miRNA as a specific molecular marker for three fluids (blood, seminal fluids, vaginal secretions, and their mix) fresh and stored. The results briefly show that miR-16 and miR-126 are strongly stable biomarkers for bloodstain even after storage for two weeks when they were found as a mixed sample (as a simulation of the crime scene) in both states, fresh and stored mixed samples, while miR-124-3p and miR-372 show good response as a specific biomarker for vaginal secretion but with less stability after storing comparing to blood and seminal fluids miRNAs.<br />\r\nWhile miRNA-16 and miRNA-126 show very stable and specific markers for bloodstains in fresh and treated mixed samples. miRNAs stability was important to make this study complete since the detection of old or deteriorated forensic samples is a challenge due to the degradation of samples in forensic crime scenes as a result of exposure to all unfavorable conditions like humidity, temperature, sunlight, etc.<a href=\"#r-24\"> </a>[<a href=\"#r-24\">24</a>]. Because of their small length of 18-25 nucleotides, degradation has a lower influence on miRNAs (miRNA) than it does on mRNA. Since 2009, a group of researchers has been assessing the feasibility and usefulness of forensic miRNA and miRNA expression analysis using quantitative PCR (qPCR) in forensic situations [<a href=\"#r-15\">15</a>,<a href=\"#r-24\">24</a>]. A recent study on a variety of samples including seminal fluids, saliva, blood and menstrual blood indicated that miR-10b and miR-135b were presented in higher levels in seminal fluids, in spite of the fact that they were stored for a year in the dark at room temperature [<a href=\"#r-17\">17</a>]. It has been found that the expression levels of miR-451, miR-150 and miR-126 were unchanged and very stable even after two weeks of storage in dark at room temperature (gene expression still about 1.5. for miR-150 and miR- 451, while miR-126 expression decreased from 1.7 in fresh to 1.5 in treated samples), meanwhile, the expression levels of miR-16 was lower but still detectable (1.3) in fresh samples and 0.68 in treated samples) [<a href=\"#r-18\">18</a>]. Another study indicated the absence of miR-124-3p, miR-214 and miR-891in menstrual blood after storing for 1 month at room temperature under light [<a href=\"#r-19\">19</a>]. Besides, it has been evidenced that miR-124-3p and miR-372 were decreased significantly after storage for two weeks and sensitivity was also weak compared to blood miRNA which was miR-451 and miR-16 [<a href=\"#r-25\">25</a>].<br />\r\nThe long-term preservation of miRNA molecules in dry circumstances might be due to a variety of factors. According to Fordyce and colleagues, drying a sample lowers the activity of RNases, which protects the nucleic acid against destruction. Another explanation for RNA stability might be their capacity to withstand hydrolytic depurination due to stronger N-glycosidic bonds and depyrimidination processes, as well as their capacity to create secondary and tertiary structures that limit phosphodiester bond hydrolysis [<a href=\"#r-26\">26</a>].<br />\r\nFor instance, it has been evidenced that the presence of AU-rich motifs in the RNA sequence is linked to the rate of RNA degradation in live cells [<a href=\"#r-27\">27</a>]. As a result, this issue should be considered when choosing RNA markers for medical purposes. Micro–RNA is particularly persistent postmortem due to its capacity to bind to proteins and subcellular compartmentalization [<a href=\"#r-28\">28</a>].</p>"
},
{
"section_number": 5,
"section_title": "CONCLUSION",
"body": "<p>In conclusion, this study found that miR-16 and miR-126 are strongly stable biomarkers for bloodstain even after storage for two weeks when they were found as a mixed sample (as a simulation of the crime scene) in both states, fresh and stored mixed samples, while miR-124-3p and miR-372 show good response as a specific biomarker for vaginal secretion but with less stability after storing comparing to blood and seminal fluids miRNAs. While miRNA-16 and miRNA-126 show very stable and specific markers for bloodstains in fresh and treated mixed samples. As a result, these miRNAs can be used to identify criminal body fluids samples at crime scenes when they were mixed together (<a href=\"#figure5\">Figure 5</a>).</p>\r\n\r\n<div id=\"figure5\">\r\n<figure class=\"image\"><img alt=\"\" height=\"326\" src=\"/media/article_images/2023/47/07/178-1647728954-Figure5.jpg\" width=\"348\" />\r\n<figcaption><strong>Figure 5. </strong>Summary of the study. It shows the fluid that might be found in a crime scene especially when it’s found mixed with one or more another type of fluid, and the role of micro-RNA molecules to identify each type of fluid considering that the micro-RNA molecules are tissue-specific molecules. The figure is created with<em> BioRender.com</em>.</figcaption>\r\n</figure>\r\n</div>"
},
{
"section_number": 6,
"section_title": "ACKNOWLEDGEMENT",
"body": "<p>This research received no external funding. The authors would like to thank Dr Lubna Albayati. Pune for their kind support with all laboratory equipment and provide the suitable facilities to make this work done.</p>"
},
{
"section_number": 7,
"section_title": "AUTHOR CONTRIBUTIONS",
"body": "<p>Conception and design of study: Yasir Haider Al-Mawlah and Mohammed Zuhair Naji. Drafting the manuscript: Mustafa Jawad Al-Imari and Hadi Sajid Abdulabbas. Analysis and/or interpretation of data: Yasir Haider Al-Mawlah.</p>"
},
{
"section_number": 8,
"section_title": "CONFLICTS OF INTEREST",
"body": "<p>There is no conflict of interest among the authors.</p>"
}
],
"figures": [
{
"figure": "https://jabet.bsmiab.org/media/article_images/2023/47/07/178-1647728954-Figure1.jpg",
"caption": "Figure 1. Gene expression values of mixed sample (seminal fluid/vaginal secretion). A) Untreated fresh sample. B) Treated sample (two weeks at room temperature and dark).",
"featured": false
},
{
"figure": "https://jabet.bsmiab.org/media/article_images/2023/47/07/178-1647728954-Figure2.jpg",
"caption": "Figure 2. Gene expression values of mixed sample (blood/seminal fluid). A) Untreated fresh sample. B) Treated sample (two weeks at room temperature and dark).",
"featured": false
},
{
"figure": "https://jabet.bsmiab.org/media/article_images/2023/47/07/178-1647728954-Figure3.jpg",
"caption": "Figure 3. Gene expression values of mixed sample (blood/vaginal secretion). A) Untreated fresh sample. B) Treated sample (two weeks at room temperature and dark).",
"featured": false
},
{
"figure": "https://jabet.bsmiab.org/media/article_images/2023/47/07/178-1647728954-Figure4.jpg",
"caption": "Figure 4. miRNAs gene expression fold differed significancy between fresh and treated mixed samples, A) Seminal fluids and vaginal secretions (Sig. of miR-10b: 0.089, miR135b: 0.090, miR-124-3p: 0.009 and miR-372: 0.008, P value ≤ 0.05). B) Blood and seminal fluids (Sig. of miR-16:0.526, miR-126:0.954, miR-10b: 0.323, miR135b: 0.110, P value ≤ 0.05). C) Blood and vaginal secretion (Sig. of miR-16:0.82, miR-126:0.954, miR-124-3p: 0.21, miR-372: 0.198, P value ≤ 0.05).",
"featured": false
},
{
"figure": "https://jabet.bsmiab.org/media/article_images/2023/47/07/178-1647728954-Figure5.jpg",
"caption": "Figure 5. Summary of the study. It shows the fluid that might be found in a crime scene especially when it's found mixed with one or more another type of fluid, and the role of micro-RNA molecules to identify each type of fluid considering that the micro-RNA molecules are tissue-specific molecules. The figure is created with BioRender.com.",
"featured": false
}
],
"authors": [
{
"id": 297,
"affiliation": [
{
"affiliation": "DNA Research Center, University of Babylon, Babylon, Hillah-Najaf Street, 51001, Iraq"
}
],
"first_name": "Yasir Haider",
"family_name": "Al-Mawlah",
"email": "yasser.almawla@uobabylon.edu.iq",
"author_order": 1,
"ORCID": "http://orcid.org/0000-0002-2453-9567",
"corresponding": true,
"co_first_author": false,
"co_author": false,
"corresponding_author_info": "Yasir Haider Al-Mawlah, PhD; DNA Research Center, University of Babylon, Babylon, Hillah-Najaf Street, 51001, Iraq, e-mail: yasser.almawla@uobabylon.edu.iq",
"article": 79
},
{
"id": 298,
"affiliation": [
{
"affiliation": "Department of Medical Laboratory Techniques, Al-Mustaqbal University College, Hillah-Najaf Street, 51001, Iraq"
}
],
"first_name": "Mohammed Zuhair",
"family_name": "Naji",
"email": null,
"author_order": 2,
"ORCID": null,
"corresponding": false,
"co_first_author": false,
"co_author": false,
"corresponding_author_info": "",
"article": 79
},
{
"id": 299,
"affiliation": [
{
"affiliation": "Department of Medical Laboratory Techniques, Al-Mustaqbal University College, Hillah-Najaf Street, 51001, Iraq"
}
],
"first_name": "Mustafa Jawad",
"family_name": "Al-Imari",
"email": null,
"author_order": 3,
"ORCID": "http://orcid.org/0000-0002-7313-7580",
"corresponding": false,
"co_first_author": false,
"co_author": false,
"corresponding_author_info": "",
"article": 79
},
{
"id": 300,
"affiliation": [
{
"affiliation": "Continuous Education Department, University of Al-Ameed, Karbala, 56001, Iraq"
}
],
"first_name": "Hadi Sajid",
"family_name": "Abdulabbas",
"email": null,
"author_order": 4,
"ORCID": "http://orcid.org/0000-0002-4336-9022",
"corresponding": false,
"co_first_author": false,
"co_author": false,
"corresponding_author_info": "",
"article": 79
}
],
"views": 190,
"downloads": 66,
"references": [
{
"id": 2265,
"serial_number": 1,
"pmc": null,
"reference": "Zubakov D, Kokshoorn M, Kloosterman A, Kayser M. New markers for old stains: Stable mRNA markers for blood and saliva identification from up to 16-year-old stains. International Journal of Legal Medicine. 2009;123(1):71–4.",
"DOI": null,
"article": 79
},
{
"id": 2266,
"serial_number": 2,
"pmc": null,
"reference": "Li Z, Peng D, Tian H, Wang J, Xia Y, Zhang L, Bai P. Expression changes of microRNAs in menstrual blood samples of different menstrual cycle collection days. Forensic Science International: Genetics Supplement Series. 2017;6:e159–61.",
"DOI": null,
"article": 79
},
{
"id": 2267,
"serial_number": 3,
"pmc": null,
"reference": "Lynch C, Fleming R. A review of direct polymerase chain reaction of DNA and RNA for forensic purposes. Wiley Interdisciplinary Reviews: Forensic Science. 2019;",
"DOI": null,
"article": 79
},
{
"id": 2268,
"serial_number": 4,
"pmc": null,
"reference": "Hanson EK, Lubenow H, Ballantyne J. Identification of forensically relevant body fluids using a panel of differentially expressed microRNAs. Analytical Biochemistry. 2009 Apr 15;387(2):303–14.",
"DOI": null,
"article": 79
},
{
"id": 2269,
"serial_number": 5,
"pmc": null,
"reference": "Ying S, Chang DC, Lin S. Chapter 1 The MicroRNA. 2018;936:1–19.",
"DOI": null,
"article": 79
},
{
"id": 2270,
"serial_number": 6,
"pmc": null,
"reference": "Uchimoto ML, Beasley E, Coult N, Omelia EJ, World D, Williams G. Considering the effect of stem-loop reverse transcription and real-time PCR analysis of blood and saliva specific microRNA markers upon mixed body fluid stains. Forensic Science International: Genetics. 2013;7(4).",
"DOI": null,
"article": 79
},
{
"id": 2271,
"serial_number": 7,
"pmc": null,
"reference": "Silva SS, Lopes C, Teixeira AL, Sousa MJC de, Medeiros R. Forensic miRNA: Potential biomarker for body fluids? Forensic Science International: Genetics. 2015;14:1–10.",
"DOI": null,
"article": 79
},
{
"id": 2272,
"serial_number": 8,
"pmc": null,
"reference": "Mayes C, Seashols-Williams S, Hughes-Stamm S. A capillary electrophoresis method for identifying forensically relevant body fluids using miRNAs. Legal Medicine. 2018;30.",
"DOI": null,
"article": 79
},
{
"id": 2273,
"serial_number": 9,
"pmc": null,
"reference": "Williams G, Uchimoto ML, Coult N, World D, Beasley E. Body fluid mixtures: Resolution using forensic microRNA analysis. Forensic Science International: Genetics Supplement Series. 2013;4(1):e292–3.",
"DOI": null,
"article": 79
},
{
"id": 2274,
"serial_number": 10,
"pmc": null,
"reference": "Alshehhi S, Haddrill PR. Estimating time since deposition using quantification of RNA degradation in body fluid-specific markers. Forensic Science International. 2019;298:58–63.",
"DOI": null,
"article": 79
},
{
"id": 2275,
"serial_number": 11,
"pmc": null,
"reference": "chmittgen TD, Livak KJ. Analysis of relative gene expression data using real-time quantitative PCR and the 2(-Delta Delta C(T)) Method. Methods. 2001;25(4).",
"DOI": null,
"article": 79
},
{
"id": 2276,
"serial_number": 12,
"pmc": null,
"reference": "Sun L, Jiang R, Li J, Wang B, Ma C, Lv Y, Mu N. MicoRNA-425-5p is a potential prognostic biomarker for cervical cancer. Annals of Clinical Biochemistry. 2017;54(1).",
"DOI": null,
"article": 79
},
{
"id": 2277,
"serial_number": 13,
"pmc": null,
"reference": "Sauer E, Extra A, Cachée P, Courts C. Identification of organ tissue types and skin from forensic samples by microRNA expression analysis. Forensic Science International: Genetics. 2017;28:99–110.",
"DOI": null,
"article": 79
},
{
"id": 2278,
"serial_number": 14,
"pmc": null,
"reference": "Iuliano A, Franzese M. Introduction to biostatistics. In: Encyclopedia of Bioinformatics and Computational Biology: ABC of Bioinformatics. 2018. p. 648–71.",
"DOI": null,
"article": 79
},
{
"id": 2279,
"serial_number": 15,
"pmc": null,
"reference": "Maiese A, Scatena A, Costantino A, di Paolo M, la Russa R, Turillazzi E, Frati P, Fineschi V. MicroRNAs as Useful Tools to Estimate Time Since Death. A Systematic Review of Current Literature. Diagnostics. 2021;11(1).",
"DOI": null,
"article": 79
},
{
"id": 2280,
"serial_number": 16,
"pmc": null,
"reference": "Barbu MG, Thompson DC, Suciu N, Cristian Voinea S, Cretoiu D, Predescu DV. Molecular Sciences The Roles of MicroRNAs in Male Infertility. 2021; Available from: https://doi.org/10.3390/ijms22062910",
"DOI": null,
"article": 79
},
{
"id": 2281,
"serial_number": 17,
"pmc": null,
"reference": "Zubakov D, Chamier-Ciemińska J, Kokmeijer I, Maciejewska A, Martínez P, Pawłowski R, Haas C, Kayser M. Introducing novel type of human DNA markers for forensic tissue identification: DNA copy number variation allows the detection of blood and semen. Forensic Science International: Genetics. 2018;36.",
"DOI": null,
"article": 79
},
{
"id": 2282,
"serial_number": 18,
"pmc": null,
"reference": "Al-Mawlah YH, Jebor MA, Abdulla AA. The effect of mixing seminal fluid and vaginal secretion on the expression of mirna markers in a simulated forensic scientific detection. Annals of the Romanian Society for Cell Biology. 2021;25(4):11477–82.",
"DOI": null,
"article": 79
},
{
"id": 2283,
"serial_number": 19,
"pmc": null,
"reference": "Wang, Zhang J, Luo H, Ye Y, Yan J, Hou Y. Screening and confirmation of microRNA markers for forensic body fluid identification. Forensic Science International: Genetics. 2013;7(1):116–23.",
"DOI": null,
"article": 79
},
{
"id": 2284,
"serial_number": 20,
"pmc": null,
"reference": "De Wael K, Lepot L, Gason F, Gilbert B. In search of blood-Detection of minute particles using spectroscopic methods. Forensic Science International. 2008;180(1): 37-42.",
"DOI": null,
"article": 79
},
{
"id": 2285,
"serial_number": 21,
"pmc": null,
"reference": "Virkler K, Lednev IK, Virkler and Lednev. 2009. Analysis of body fluids for forensic purposes: From laboratory testing to non-destructive rapid confirmatory identification at a crime scene. Vol. 188, Forensic Science International. Forensic Sci Int; 2009. p. 1–17.",
"DOI": null,
"article": 79
},
{
"id": 2286,
"serial_number": 22,
"pmc": null,
"reference": "Wang S, Wang Z, Tao R, He G, Liu J, Li C, Hou Y. The potential use of Piwi-interacting RNA biomarkers in forensic body fluid identification: A proof-of-principle study. Forensic Science International: Genetics. 2019;39(July 2018):129–35.",
"DOI": null,
"article": 79
},
{
"id": 2287,
"serial_number": 23,
"pmc": null,
"reference": "Zubakov D, Boersma AWM, Choi Y, van Kuijk PF, Wiemer EAC, Kayser M. MicroRNA markers for forensic body fluid identification obtained from microarray screening and quantitative RT-PCR confirmation. International Journal of Legal Medicine. 2010 May;124(3):217–26.",
"DOI": null,
"article": 79
},
{
"id": 2288,
"serial_number": 24,
"pmc": null,
"reference": "Hanson, Lubenow H, Ballantyne J. Identification of forensically relevant body fluids using a panel of differentially expressed microRNAs. Forensic Science International: Genetics Supplement Series. 2009;2(1):503–4.",
"DOI": null,
"article": 79
},
{
"id": 2289,
"serial_number": 25,
"pmc": null,
"reference": "Al-Mawlah YH, Jebor MA, Abdulla AA. Identification of suitable reference gene for normalization of microRNAs in forensically revenant body fluids by reverse transcription-quantitative polymerase chain reaction. Annals of the Romanian Society for Cell Biology. 2021;25(4):5112–6.",
"DOI": null,
"article": 79
},
{
"id": 2290,
"serial_number": 26,
"pmc": null,
"reference": "Misiewicz-Krzeminska I, Krzeminski P, Corchete LA, Quwaider D, Rojas EA, Herrero AB, Gutiérrez NC. Factors regulating microRNA expression and function in multiple myeloma. Noncoding RNA. 2019;5(1).",
"DOI": null,
"article": 79
},
{
"id": 2291,
"serial_number": 27,
"pmc": null,
"reference": "Na JY, Park JT. Postmortem RNA stability and availability of microRNAs in postmortem body fluids in forensic medicine. Romanian Journal of Legal Medicine. 2018;26(2):167–72.",
"DOI": null,
"article": 79
},
{
"id": 2292,
"serial_number": 28,
"pmc": null,
"reference": "Arroyo JD, Chevillet JR, Kroh EM, Ruf IK, Pritchard CC, Gibson DF, Mitchell PS, Bennett CF, Pogosova-Agadjanyan EL, Stirewalt DL, Tait JF, Tewari M. Argonaute2 complexes carry a population of circulating microRNAs independent of vesicles in human plasma. Proc Natl Acad Sci U S A. 2011;108(12).",
"DOI": null,
"article": 79
}
]
},
{
"id": 65,
"slug": "178-1646159464-quantitative-analysis-of-the-factors-influencing-ida-and-tsh-downregulation-in-correlation-to-the-fluctuation-of-activated-vitamin-d3-in-women",
"featured": false,
"slider": false,
"issue": "Vol5 Issue2",
"type": "original_article",
"manuscript_id": "178-1646159464",
"recieved": "2022-03-01",
"revised": null,
"accepted": "2022-04-04",
"published": "2022-04-13",
"pdf_file": "https://jabet.bsmiab.org/media/pdf_file/2023/17/178-1646159464.pdf",
"title": "Quantitative analysis of the factors influencing IDA and TSH downregulation in correlation to the fluctuation of activated vitamin D3 in women",
"abstract": "<p>Anemia and thyroid disorders are global health issues that affect all ages but are more apparent in women. In this case, some serological components responsible for iron deficiency anemia (IDA) and thyroid-stimulating hormone (TSH) downregulation in women have been found actively regulated through a complex vitamin D3 mediated mechanism. This research has been investigated the correlation between activated vitamin D3 and the serological components responsible for IDA and dysregulation of TSH in childbearing and non-child-bearing women of different health conditions. Experimental sampling from 482 women suffering from both IDA and TSH dysregulation was taken, aged between 0 and 70 years. Serological parameters, such as iron, total iron-binding capacity, and ferritin, were assessed for IDA profiling, whereas thyroid-stimulating hormone and free thyroxin were for TSH profiling based on the individual’s serum vitamin D3 concentration. The resulting serological data were interpreted using sophisticated computer programming language and algorithms for quantitative biochemical analysis. The study resulted in a significant correlation between FT4 and vitamin D3 (p < 0.0001) for all age groups. TSH also showed strong interactions with the fluctuation of vitamin D3 levels (p < 0.0001), except for the children aged below 10 years (p < 0.063). The iron, TIBC, TSH, and FT4 showed phenomenal regulation with the steroidal-vitamin D3 concentration for congenital patients. Unlike the others, ferritin has a substantial connection with activated Vitamin D3 (p < 0.0064) fluctuation in the serum. To ratify, the concentrations of TSH, FT4, iron, TIBC, and ferritin were found to be significantly interconnected in terms of serum vitamin D3 concentration in women suffering from IDA and TSH downregulation simultaneously. In addition, the BMI condition of the patients can be a major factor in terms of correlating vitamin D3 with the regulatory factors of IDA and thyroid TSH as resulted in this research. To understand the accuracy and efficacy of the serum vitamin D3 in IDA and TSH downregulation, some other inflammatory markers and parathyroid hormone analysis of many samples can be conducted in continuation of this study.</p>",
"journal_reference": "J Adv Biotechnol Exp Ther. 2022; 5(2): 320-333.",
"academic_editor": "Md Jamal Uddin, PhD, ABEx Bio-Research Center, Dhaka, Bangladesh",
"cite_info": "Azad SA, Ahmed S, et al. Quantitative analysis of the factors influencing IDA and TSH downregulation in correlation to the fluctuation of activated vitamin D3 in women. J Adv Biotechnol Exp Ther. 2022; 5(2): 320-333.",
"keywords": [
"BMI",
"TSH downregulation",
"Activated vitamin D3 concentration",
"Reproductive and non-reproductive women",
"Quantitative assessment of the serological factors",
"IDA"
],
"DOI": "10.5455/jabet.2022.d118",
"sections": [
{
"section_number": 1,
"section_title": "INTRODUCTION",
"body": "<p>Anemia is a global public health concern nowadays that affects developing countries and developed countries with the major consequences of human health hazards. According to the previous data, it affects one-quarter of the global population, with pregnant women and young children having a higher prevalence rate than men [<a href=\"#r-1\">1</a>]. Turning to the factors, iron deficiency is the major cause of poor nutrition, which correspondingly results in severe Anemia with the consequence of both mother and child’s death [<a href=\"#r-2\">2</a>]. Iron is vital to all biological functions, including DNA synthesis, respiration, cell proliferation, energy production, and so on [<a href=\"#r-3\">3</a>]. Over 2 billion people are affected by iron deficiency worldwide [<a href=\"#r-4\">4,5</a>], and the ubiquity of anemia among pregnant women and young children due to iron depletion has been well documented [<a href=\"#r-6\">6,7</a>]. Age is also significantly correlated with IDA in childbearing females [<a href=\"#r-8\">8</a>]. Additionally, premenopausal women who stick to a restrictive diet and usually intake a little amount of iron are mostly at risk of iron deficiency since they also lost iron during their menstrual cycle. However, in 2002, WHO reported iron deficiency anemia (IDA) as one of the most important factors in the global burden of disease [<a href=\"#r-9\">9</a>]. Therefore, frequent screening of IDA is very significant. Numerous iron indicators are used to screen for IDA, and a potential example is how serum ferritin can be used as a diagnostic tool in clinical practice [<a href=\"#r-10\">10</a>]. A combination of two serum transferrin markers is used in detecting IDA in regular hemodialysis anemic patients [<a href=\"#r-11\">11</a>].<br />\r\nThyroid gland dysfunction is also one of the most prevalent endocrine disorders worldwide [<a href=\"#r-12\">12</a>]. Globally about 1.6 billion people are at risk of developing abnormal thyroid concentration due to iodine deficiency [<a href=\"#r-13\">13</a>]. There are two types of thyroid disorder means- hyperthyroidism and hypothyroidism. Iron status in humans is inextricably related to thyroid gland function. IDA deteriorates thyroid metabolism and retards the physical and mental development of both young and adult individuals. Based on several investigations, IDA is interconnected with hypothyroidism which significantly increases serum thyroid-stimulating hormone (TSH) levels and decreases serum iron, serum ferritin, free T4 (FT4), transferrin, RBC count, and so on [<a href=\"#r-14\">14-18</a>]. Ferritin is a universal protein that acts as an iron carrier, and serum ferritin level is negatively correlated with serum TSH levels [<a href=\"#r-19\">19,20</a>]. In addition to iron and ferritin, values of total iron-binding capacity (TIBC), FT3, and FT4 have been reported as significantly lower in hypothyroid patients suffering from IDA [<a href=\"#r-21\">21,22</a>]. This lower serum ferritin level is also associated with reducing sex hormones along with TSH, which exaggerates other endocrine dysfunctionalities [<a href=\"#r-23\">23</a>]. The deficiency of iron can clinically produce hypothyroidism frequently in individuals [<a href=\"#r-24\">24</a>]. Similarly, alterations in thyroid status change serum iron metabolism and hematological index phenomenally [<a href=\"#r-16\">16</a>].<br />\r\nVitamin D is a fat-soluble steroid hormone mainly produced in the skin when exposed to sunlight. Vitamin D may also be acquired from the ingested diet to a minor extent [<a href=\"#r-25\">25</a>]. To explain further, vitamin D biosynthesis (25-hydroxyvitamin D) in the skin becomes initiated by UV rays of sun lights which convert 7-dehydrocholesterol to pre-vitamin D3; then, it is thermally isomerized to vitamin D3. However, vitamin D needs to be activated through a hydroxylation reaction mechanism, where a hydroxylase enzyme acts as the catalyst. In recent years vitamin D3 has taken close attention because its deficiency entails the risks of various human diseases such as gestation-associated disorders [<a href=\"#r-26\">26</a>]. According to previous studies, insufficiency of vitamin D3 is prevalent in over one billion people globally [<a href=\"#r-27\">27,28</a>]. The lower vitamin D3 levels are associated with higher serum TSH levels [25] and lower hemoglobin and ferritin levels [<a href=\"#r-29\">29</a>]. Studies highly suggested the supplementation of vitamin D3 in case of hypothyroidism and Anemia, along with the high recommendation for the screening of vitamin D3 deficiency in all hypothyroid patients [<a href=\"#r-25\">25</a>,<a href=\"#r-30\">30</a>]. It is practically required for monitoring iron nutritional status as it exaggerates thyroid disorders in reproductive age and pregnant women [<a href=\"#r-14\">14</a>]. Thyroid dysfunctions must also be considered by physicians treating anemia to ensure early detection and proper treatment [<a href=\"#r-31\">31</a>]. Literature reveals that there is no study conducted yet on Bangladeshi patients suffering from iron deficiency anemia and thyroid hormone dysregulation, especially in women, where factors like lifestyle, sun exposure, dieting with proper vitamin D3 supplementation at both reproductive and nonreproductive conditions are also required to be studied.<br />\r\nConsidering all the aforementioned facts, this current study aims to evaluate the impacts of vitamin D3 on the regulation of IDA and imbalanced TSH concentrations among the women of Bangladesh. In addition, a new dimension of studying the serological status of the anemic and thyroid patients depending on their vitamin D3 profiles can be achieved, through which it should be clinically suggestive as a serological parameter for assessing IDA, along with the ‘up and down-regulation’ of TSH.</p>"
},
{
"section_number": 2,
"section_title": "MATERIALS AND METHODS",
"body": "<p><strong>Clinical diagnosis of selective serological compounds</strong><br />\r\nThe current research started with diagnosing serum vitamin D3 levels [32] of the 482 women (452 are the test samples and 30 are the control samples) suffering from IDA and TSH simultaneously, where 56 of the diseased women have been taking medications (12.389%) for their thyroid issues to optimize their normal concentrations of TSH. To analyze the regulatory effects of vitamin D3 on the IDA and TSH disorders among the patients, several specific serological parameters were considered, such as serum iron (µg/dl), total iron-binding capacity (TIBC, µg/dl), and ferritin (ng/dl) for IDA confirmation. Whereas serum TSH (µIU/mL) and free thyroxine (FT4, ng/dl) were assessed to determine the TSH up and down regulations. The iron (µg/dl) and TIBC (µg/dl) levels of the patients’ serum were quantitatively analyzed using ‘Dimen-sion®IRON Flex® reagent cartridge (DF85)’ and ‘Dimension®Flex® Reagent IBCT’ (Sie-mens Healthcare Diagnostics Inc., USA) respectively, following the referred methodology [<a href=\"#r-33\">33,34</a>]. The ferritin level (ng/dl) was tested quantitatively with ‘Beckman Coulter Access Ferritin Calibrators (S0-S5)’ considering its established protocol [<a href=\"#r-34\">34,35</a>]. On the other hand, ‘ADVIA®Centaur™ TSH-3 Kit’ (Siemens, USA) and ‘ADVIA®Centaur™ FT4 Kit’ (Siemens, USA) were used to diagnose the concentrations of TSH (µIU/mL) and FT4 (ng/dl) respectively. Different patient groups were classified following their age, reproductive status, and past clinical history in all aspects. All those serum components were tested depending on their respective vitamin D3 concentrations to identify if there were any precise correlations with activated vitamin D3 or not. The kit used to detect vitamin D3 was ‘Human Vitamin D3 (VD3) ELISA kit; Cat No. MBS264661’. For transparent analysis, clinical data of the same serological tests and the vitamin D3 profiling of several normal women were also used as a control to compare with the IDA and thyroid patients. The BMI of all the control and clinical patients were taken were normal women considered below 25 (BMI<25). On the other hand, overweight and obese individuals were considered as 25<MBI<30 and 30<BMI<35 respectively. BMI of more than 35 was taken as morbidly obese [<a href=\"#r-36\">36</a>]. Downregulation of TSH was considered depending on the increase of the patients’ BMI in this study.<br />\r\nThe total research work was conducted under the Ethical Guidelines and Monitoring of Jashore Medical College (JMC), Bangladesh Medical and Dental Council (BMDC) in collaboration with the RPG Authority (Govt. Registration ID: 05-060-06021) under Project Category C2 (#Project EA No- 10/2021-2022). The ‘Ethical Clearance’ directly follows the Declaration of Helsinki and the Ministry of Health, Bangladesh. All necessary documents have been conserved by the corresponding author, which will be shared upon conditional requests. The authors are very cordial in publishing the manuscript and their consent is clear.</p>\r\n\r\n<p> </p>\r\n\r\n<p><strong>Post-diagnosis serological data analysis </strong><br />\r\nTo study the quantitative interactivity of the aforementioned serum components based on the individuals’ vitamin D3 concentration, different bioanalytical parameters were preferred, including- the two-way ANOVA test [37], Brown-Forsythe test [<a href=\"#r-38\">38,39</a>], Bartlett’s test [<a href=\"#r-40\">40,41</a>], and Tukey’s multiple comparisons test ‘p values’ as the majors [42-44]. In addition, least-square mean (LSM), mean difference (MD); standard error of the difference (SED); the difference between predicted means (DBPM), and 95% CI of difference (95% CID) were also analyzed. In this study, vitamin D3 was assigned to be considered as a significant serological analyzer only if its quantitative values belong to p < 0.05 in all aspects [<a href=\"#r-45\">45,46</a>].</p>\r\n\r\n<p> </p>\r\n\r\n<p><strong>Software tools for the resulted data assessment </strong><br />\r\nThe biostatistical analysis and computational algorithms were performed using computational ‘R Programming Scripts’ (version R-4.0.2, for Linux) [<a href=\"#r-47\">47-49</a>] and ‘GraphPad Prism’ (version 8.1.2, for Mac OS) [<a href=\"#r-50\">50-53</a>] premium software packages.</p>"
},
{
"section_number": 3,
"section_title": "RESULTS",
"body": "<p>In this research, the concentrations of TSH, FT4, iron, TIBC, and ferritin were found regulating in correlation to the vitamin D3 concentrations of the corresponding women suffering from IDA and TSH downregulation.</p>\r\n\r\n<p> </p>\r\n\r\n<p><strong>Quantitative analysis of the factors regulating TSH in response to Vit. D3</strong><br />\r\nIndividual patients belonging between 11 to 70 years possess a very strong correlation of both the TSH and FT4 level (p < 0.0001) with their respective vitamin D3 counts (in the scale of significance p < 0.05) (<a href=\"#figure1\">Figure 1</a>). Though there is an insignificant relationship between the TSH and vitamin D3 (p < 0.063) among the patients ranging between 0 to 10 years (Figure 1A), the correlation between FT4 and vitamin D3 is highly significant (p < 0.0001) for the same age group (<a href=\"#figure1\">Figure 1B</a>). The upper and lower values of TSH and FT4 are 3.1 (µIU/mL), 1.2 (µIU/mL), and 1.25 (ng/dl), 1.01 (ng/dl) respectively, for the women aged below 10 years. In both aspects, the activated vitamin D3 upper and lower values are- 25.3 (ng/mL) and 8.19 (ng/mL), respectively.</p>\r\n\r\n<div id=\"figure1\">\r\n<figure class=\"image\"><img alt=\"\" height=\"431\" src=\"/media/article_images/2023/33/07/178-1646159464-Figure1.jpg\" width=\"500\" />\r\n<figcaption><strong>Figure 1. </strong>(A) The correlation between the thyroid-stimulating hormone (TSH) and vitamin D3; (B) The correlation between free thyroxin (FT4) and vitamin D3 status in thyroid dysregulated women patients. µIU/mL (micrograms international units per milliliter), ng/mL (nanograms per milliliter), LS mean (the mean of Longitudinal Section), SE (standard error), CI (confidence interval).</figcaption>\r\n</figure>\r\n\r\n<p> </p>\r\n</div>\r\n\r\n<p><strong>Quantitative assessment of the factors regulating IDA in response to Vit. D3</strong><br />\r\nThe serum iron, TIBC, and ferritin level fluctuate dramatically with the concentration of vitamin D3 present for all the selected patients from different age groups, resulting in the current serological quantitative analysis (<a href=\"#figure2\">Figure 2</a>). The iron level increases (150µg/dl) and decreases (9µg/dl) with the ups and downs of vitamin D3 levels as 54.98 ng/mL and 8 ng/mL, respectively. The correlation between iron and vitamin D3 is found significant (p < 0.0001) among reproductive patients (<a href=\"#figure2\">Figure 2A</a>). On the other hand, TIBC increased (580µg/dl) with the reduction of vitamin D3 (8ng/mL) and decreased (156µg/dl) with the progress of vitamin D3 concentration (52.7ng/mL), which means their serological profiles are reversible to each other (<a href=\"#figure2\">Figure 2B</a>). Similarly, ferritin downregulates (5ng/mL) as the vitamin D3 level promotes (52.7ng/mL), resembling the findings of TIBC as well (<a href=\"#figure2\">Figure 2C</a>) among reproductive women. In both the cases of TIBC and ferritin, the values are equally significant (p < 0.0001) when correlated with their vitamin D3 limits (<a href=\"#figure2\">Figure 2B and 2C</a>). The correlation of iron, TIBC, and ferritin concerning the vitamin D3 level has also been found significant in nonproductive women (p < 0.0001 for each on the scale of significance p < 0.02), except for the women aged below fourteen years.</p>\r\n\r\n<div id=\"figure2\">\r\n<figure class=\"image\"><img alt=\"\" height=\"342\" src=\"/media/article_images/2023/33/07/178-1646159464-Figure2.jpg\" width=\"500\" />\r\n<figcaption><strong>Figure 2.</strong> (A) The correlation between iron and vitamin D3; (B) The correlation between TIBC and vitamin D3; and (C) The correlation between ferritin and vitamin D3 status in anemic women of reproductive ages. TIBC (total iron-binding capacity), µg/dL (micrograms per deciliter), ng/mL (nanograms per milliliter).</figcaption>\r\n</figure>\r\n\r\n<p> </p>\r\n</div>\r\n\r\n<p><strong>Impacts of Vit. D3 on the congenital patients of IDA and TSH downregulation</strong><br />\r\nThis study experienced 13 congenital cases of IDA and TSH disorders among all women. Surprisingly, according to their vitamin D3 profiles, all serological parameters have been found highly significant considering their two-way ANOVA and ‘Tukey’s multiple t-tests’ of variables (<a href=\"#figure3\">Figure 3</a>). For the congenital patients, individual correlations of TIBC, TSH, and FT4 with their vitamin D3 concentration is exactly p < 0.0001 (<a href=\"#figure3\">Figure 3A</a>). In contrast, ferritin shows a strong correlation but unlike the others with vitamin D3 concentration, means (p < 0.0064). The values obtained from the interactive components means iron, TIBC, ferritin, TSH, and FT4, with the vitamin D3, have been found very authentic considering their DBPM, SEM, and CID parameters, which established the findings as 95% confident (<a href=\"#figure3\">Figure 3B</a>). It’s resulted that there are no null (‘0’) values in their 95% CID, which means the quantitative outputs are highly authentic and statistically significant. The ‘Z value’ for 95% confidence is 1.96 (Z = 1.96) as calculated from the statistical parameters (<a href=\"#figure3\">Figure 3</a>).<br />\r\n </p>\r\n\r\n<div id=\"figure3\">\r\n<figure class=\"image\"><img alt=\"\" height=\"352\" src=\"/media/article_images/2023/33/07/178-1646159464-Figure3.jpg\" width=\"500\" />\r\n<figcaption><strong>Figure 3. </strong>(A) Two-way ANOVA and ‘Tukey’s multiple t-tests’ are showing the correlation of the variables with vitamin D3 among 13 congenital cases of IDA and TSH disorder. The stacked columns demonstrate the relationship of Iron, TIBC, Ferritin, TSH, and FT4 against vitamin D3 in the case of 13 congenital patients who had iron deficiency anemia and thyroid deficiency. (B) The level of divergence of the obtained values (from Figure 3A) contains 95% confidence considering the DBPM, SED, and CID parameters. The level of significance of correlation of vitiation D3- with the IDA causing parameters are mentioned as (*), while parameters regulating thyroid functions were illustrated as ‘#’.</figcaption>\r\n</figure>\r\n</div>\r\n\r\n<p> </p>\r\n\r\n<p><strong>Quantitative fluctuations of the patients’ IDA and TSH parameters as compared to the control group </strong><br />\r\nThe overall results of each parameter were assessed based on the standard data generated by sampling the same serological parameters from thirty normal women as a control to compare their vitamin D3 profiles with the diseased women on that exact parameter. The vitamin D3 level of the normal women ranged between 20ng/mL to 40ng/mL. In response to which, their iron, TIBC, ferritin, TSH, and FT4 ranges were found as 50–93 µg/dl, 250–423 µg/dl, 45–113 ng/mL, 0.5–4.0 µIU/mL, and 0.70−1.67 ng/dl respectively (<a href=\"#figure4\">Figure 4</a>). TSH levels of the participant normal pregnant women who were in the first trimester showed a significant positive correlation with BMI (r=0.253 and p=0.033) and those who were in the second trimester showed BMI (r=0.261 and p=0.029) of pregnancy in this research. The normal range of TSH levels in non-pregnant adult women was ranged between 0.8 and 5.0 mIU/L. Considering the TSH values, the BMI of the normal women was found below 25 (kg/m2) in this research meaning 21 to 24.6 (kg/m2). The clinically hypothyroid patients suffering from the IDA simultaneously ranged between 25.3 and 28.7 (kg/m2). Females aged less than 10 years, showed BMI showed 17 to 18.7 (kg/m2) suffering from hypothyroidism and IDA simultaneously. This is mainly observed among the congenital sufferers studied in this research. The normal females below 10 years showed 13.1 to 13.4 (kg/m2) of their BMI. Higher BMI levels were found to associate with lower concentrations of vitamin D3 in this research. Obesity was recognized strongly among the female patients who have been suffering from different stages of vitamin D3 deficiency in all the ages tested, which is another key finding of this research.</p>\r\n\r\n<div id=\"figure4\">\r\n<figure class=\"image\"><img alt=\"\" height=\"269\" src=\"/media/article_images/2023/33/07/178-1646159464-Figure4.jpg\" width=\"500\" />\r\n<figcaption><strong>Figure 4.</strong> Illustration of the correlations of iron, TIBC, Ferritin, TSH, and FT4 of 30 physically and clinically healthy women with their individual-corresponding vitamin D3 levels.</figcaption>\r\n</figure>\r\n</div>"
},
{
"section_number": 4,
"section_title": "DISCUSSION",
"body": "<p>Vitamin D has long been recognized as an important hormone in regulating the musculoskeletal system as well as accounts for anemia risk and thyroid abnormalities. In the context of thyroid disorders, the antiproliferative and differentiating effects of the activated form of vitamin D are significant, and its function in modulating the immune system has been demonstrated in autoimmune thyroid disease (AITD) [<a href=\"#r-54\">54,55</a>]. Several research studies have shown that vitamin D3 has vital role in maintaining bone health, immunity, and muscles. Many studies showed a link between vitamin D deficiency and thyroid downregulations [<a href=\"#r-56\">56</a>]. IDA is a common problem and highly prevalent among Bangladeshi women, especially among pregnant women and females living in low iron water supplies [<a href=\"#r-57\">57</a>]. Many IDA patients remain undiagnosed worldwide as the early stages show minor symptoms.<br />\r\nThe function of several proteins, and metabolic activity, including imbalance of thyroid hormones, may occur due to iron deficiency. Changes in ferritin levels affect thyroid functions. Low levels of TSH and high levels of FT4 occur due to an imbalance in TSI (thyroid-stimulating immunoglobulin), leading to hyperthyroidism. FT4 does not bind to proteins, which is good for diagnosing thyroid problems [<a href=\"#r-58\">58</a>].<br />\r\nThe potential relationship of activated vitamin D3 with the regulation of TSH has been identified (Figure 1A). We have collected the TSH in µIU unit and vitamin D3 in ng/mL unit of serum concentration from 452 women blood who possessed the TSH and IDA disorders according to the age limit of 0 to 70. According to the current study, the age limit was conducted among the 10 years intervals for the higher frequency of random sample collection. After the statistical analysis of the relationship between TSH and vitamin D3, it showed (p < 0.063) among the patients ranged from 0 to 10 years. The values of the serological components for women over 10 years can act randomly because their hormonal and metabolic profile remained developmental like the neonatal, which can fluctuate insignificantly under any circumstances [<a href=\"#r-59\">59</a>]. According to the result, the LS mean of TSH and vitamin D3 is 4.338 and 15.73, in the Mean Difference and SE Difference is −11.39 and 0.9083 (<a href=\"#figure1\">Figure 1A</a>).<br />\r\nThis study analyzed Free T4 (FT4) measurements that are not bound and can freely enter and affect the body tissues. FT4 normal values are 0.7 to 1.9ng/dL (Figure 4). Vitamin D3 can exert biological effects by binding with VDR (vitamin D receptor). The effects of vitamin D depend on VDR. Their polymorphic variants have been studied to a limited extent in the case of thyroid cancer [60]. In another study, there is an evaluation of the relationship between hypothyroidism and vitamin D, and their results indicated that patients with hypothyroidism suffered from hypovitaminosis D with hypocalcemia [<a href=\"#r-30\">30</a>]. A potential relationship has been obtained between activated vitamin D3 and FT4 (Figure 1B) in this research. The statistical analysis significant relationship between vitamin D3 mediated FT4 regulation (p < 0.0001) among the patients ranged from 0 to 10 years. The upper and lower values of FT4 and vitamin D3 are 1.25 (ng/dl), 1.01 (ng/dl), and 25.3 (ng/mL), 8.19 (ng/mL), respectively; where the LS means of FT4 and vitamin D3 are 0.9320 and 15.73, in which the Mean Difference and SE of Difference are −14.80 and 0.8127. People who have hypothyroidism may not get enough vitamin D because of one of two possible reasons. Firstly, low vitamin D levels may be a result of inadequate vitamin D absorption from the gut. Secondly, the body may not adequately activate vitamin D [<a href=\"#r-30\">30</a>]. The low value of vitamin D reduces the absorption efficiency of intestinal calcium, and the body responds by enhancing parathyroid hormone (PTH) release [<a href=\"#r-61\">61</a>]. Increased blood PTH concentrations, particularly in the elderly, also occurred due to low calcium levels and an increased risk of fracture [<a href=\"#r-62\">62</a>]. Furthermore, vitamin D therapy with calcidiol improves vitamin D while also dramatically lowering PTH levels, hence minimizing hyperparathyroidism [<a href=\"#r-63\">63</a>]. The current investigation found vitamin D insufficiency in those aged 60 and more that may be linked to changes in mineral bone density and secondary hyperparathyroidism [<a href=\"#r-64\">64</a>].<br />\r\nIron-deficiency anemia is defined when blood levels of iron will be low, or less than 10 micromoles per liter (mmol/L) for both men and women (normally 10−30 mmol/L) (Figure 4). Iron deficiency anemia increases susceptibility to infectious disease, increased child mortality, slowed child development, and reduces scholastic performance [<a href=\"#r-66\">66</a>]. There is an association between vitamin D deficiency with the regulation of a greater risk of anemia, lower mean hemoglobin (LMH), and higher usage of erythrocyte-stimulating agents [<a href=\"#r-66\">66</a>]. The research results have been depicted a strong correlation between iron and vitamin D3 (p < 0.0001) among the patients (<a href=\"#figure2\">Figure 2A</a>). The Vit. D3 level of the normal women ranged from 20ng/mL to 40ng/mL, and the iron level is 50−93 µg/dl (<a href=\"#figure4\">Figure 4</a>). Here Iron level is increased (150µg/dl) and decreased (9µg/dl) with the increase and decrease of vitamin D3 levels as 54.98 ng/mL and 8 ng/mL, respectively. Total iron-binding capacity (TIBC) plays a pivotal role in indirectly measuring the percentage of transferrin situation involved in a positive correlation with vitamin D [<a href=\"#r-67\">67</a>]. Transferrin and vitamin D levels decreased, whereas TIBC levels increased during iron-deficient anemic patients [<a href=\"#lr-68\">68</a>]. According to this study, the serum TIBC range for all the patients was between 220 µg/dL to 578 µg/dL with some fluctuations.<br />\r\nIn contrast, the activated Vitamin D value was between 8 ng/mL and 26.29 ng/mL with a little bit of oscillation. In this research, it was found that serum TIBC result was increased. In contrast, serum vitamin D3 level was decreased in all the individual patients, consequently indicating iron deficiency anemia [<a href=\"#r-69\">69</a>], as compared to the normal range (<a href=\"#figure4\">Figure 4</a>). The ferritin level in the human body indicates the iron status and iron storage. Ferritin levels are lower in people who have iron-deficiency anemia, but they may be higher in people with inflammation and chronic disease-related Anemia [<a href=\"#r-70\">70</a>]. However, in the present analysis, the range of the ferritin level was from 21 ng/mL to 166 ng/mL with some fluctuations, and the vitamin D3 level was between the ranges of 8 to 26.29 ng/mL respected to the normal control. It was noticed that serum vitamin D3 value was slightly higher, whereas serum ferritin values were significantly lower following the vitamin D3 scores for all the patients (<a href=\"#figure2\">Figure 2C</a>). The current investigation found a positive association between serum vitamin D3 concentration and ferritin levels, consistent with previous findings [<a href=\"#r-71\">71,72</a>].<br />\r\nIt is mainly due to maternal risk factors such as inadequate dietary intake of vitamin D, insufficient exposure to sunlight, and pregnancy that occurs close to the people who suffer from congenital vitamin D deficiency [<a href=\"#r-73\">73</a>]. Low maternal vitamin D levels may raise the risk of a newborn’s deficiency [<a href=\"#r-74\">74</a>]. Besides, spontaneous hypothyroidism affects between 1% and 2% of the population and is more prevalent in older women [<a href=\"#r-75\">75</a>]. Therefore, a poor pregnancy outcome is associated with vitamin D deficiency or insufficiency, which leads to several disorders such as low birth weight in newborns [<a href=\"#r-76\">76</a>]. According to the current serological assessment, the value of vitamin D3 (8.19−25.3ng/mL) and iron (15−75 µg/dl) reduced significantly (<a href=\"#figure3\">Figures 3A and 3B</a>) than the control group (20−40 ng/mL) and (50−93 µg/dl), respectively (<a href=\"#figure4\">Figure 4</a>). Moreover, the FT4 level decreased slightly from the control 0.7−1.67 ng/dl to congenital 0.77−1.5 ng/dl. On the other hand, TIBC, Ferritin, and TSH indicate an upper range of 220−566 µg/dl, 17−150 ng/mL, and 1.2−5.7 µIU/mL than healthy people 250−423 µg/dl, 45–113 ng/mL, and, 0.5−4 µIU/mL, respectively. The results possessed a higher percentage of TIBC and a lower percentage of TSH. The TIBC, TSH, and FT4 have a significant relationship with their vitamin D3 concentration which is exactly p < 0.0001, whereas ferritin shows a strong correlation with vitamin D3 (p < 0.0064) (<a href=\"#figure3\">Figure 3A and 3B</a>).<br />\r\nThe research has described the values and regulatory relationships of the same serological parameters as iron, TIBC, ferritin, TSH, and FT4, with the serum vitamin D concentration of 30 normal women as a control group, where the range of vitamin D3 was found 20ng/mL – 40 ng/mL among the control group females, which was within the normal limit (<a href=\"#figure4\">Figure 4</a>). On the other hand, the range of iron, TIBC, Ferritin, TSH, and FT4 were found 50−93mcg/dl, 250−423mcg/dl, 45−113n/mL, 0.5-4.0 mcgIU/ml, respectively, which were also within the normal ranges (<a href=\"#figure4\">Figure 4</a>). The potential Vitamin D3 based regulation of the other serological parameters has been found in normal 30 women, used as the standard. Considering the biostatistical analysis, the overall one-way ANOVA test, Brown-Forsythe test, Barlett’s test, and the vitamin D3 correlation p-values were all exactly <0.0001 (in the scale of significance p < 0.05). The R square (R<sup>2</sup>) value was 0.9337, and Barrett’s statistics was 84.97%.<br />\r\nIn clinical immunology, nutritional issues play a pivotal role in stimulating the secondary immune response when necessary. In the case of IDA, several nongenetic issues are involved including iron deficiencies as the major one. Application of proper food supplements especially the probiotic microorganisms and prebiotics, responsible for intestinal iron absorption can be very good preventives of IDA [<a href=\"#r-77\">77-80</a>]. Passive immuniazation can imply a significant effect on the recovery of TSH downregulation among the patients [<a href=\"#r-81\">81</a>], where the secondary immune response is activated due to systematic opsonization [<a href=\"#r-82\">82</a>]. Besides, the research on the IDA and TSH downregulation among women is rapidly progressing over time globally with the radical advancements in the clinical molecular biology and medical biotechnology sectors.</p>"
},
{
"section_number": 5,
"section_title": "CONCLUSION",
"body": "<p>It is reasonable to expect that significant vitamin D deficiency will occur in the majority of the women suffering from various forms of thyroid autoimmunity and iron deficiency anemia (IDA), based on our previous experience and the findings of our research study. The question remains on how to respond in such a circumstance. Based on the results of our serological research, it can be concluded that the concentrations of TSH, FT4, iron, TIBC, and ferritin were correlated with the levels of serum vitamin D3 in women suffering from TSH downregulation and IDA. Moreover, depending on a woman’s reproductive status, age, and BMI; vitamin D3 has can be suggested as a biomarker for tracking the status of IDA and TSH irregularities. However, more research with a larger sample size is required to understand better the serological profiles of patients with IDA and TSH disorders.</p>"
},
{
"section_number": 6,
"section_title": "FUNDING",
"body": "<p>This research was supported by Basic Science Research Program through the National Research Foundation of Korea (NRF) funded by the Ministry of Education (NRF-2020R1I1A2066868), the National Research Foundation of Korea (NRF) grant funded by the Korean government (MSIT) (No. 2020R1A5A2019413).</p>"
},
{
"section_number": 7,
"section_title": "ACKNOWLEDGMENTS",
"body": "<p>The authors are grateful to the RPG Interface Lab (Govt. License ID: 05-060-06021) authority for providing all types of technical support (under the Project of Category: C2; ID. #10-2021/22). At the same time, the authors are showing their gratitude to Prof. Dr. Md. Mohidur Rahman (Principal, JMC, Bangladesh), and Dr. Md. Azam Saklain (Associate Prof. and Head of the Pathology Department, JMC, Bangladesh) for arranging the ethical clearance certificate of this research unconditionally.</p>"
},
{
"section_number": 8,
"section_title": "AUTHOR CONTRIBUTIONS",
"body": "<p>Conceptualization, Methodology, Supervision: Sharmin Ahmed; Project administration and Co-supervision: Salauddin Al Azad; Resources: Md. Abdul Rashid Mia, Data curation: Partha Biswas, Mithila Farjana; Writing original draft: All the authors participated equally; Visualization: Farzana Alam Arshe, Investigation: Sabrina Jahan Mily, Ananya Baidya Ankhi, Mahdi Mubin Shaikat; Validation and software: Salauddin Al Azad, Sabeeha Sultana, Kashfia Mawa, Zannatul Naim, Riazul Islam; Revision, and correspondence: Md. Ataur Rahman; Funding, and correspondence: Bonglee Kim.</p>"
},
{
"section_number": 9,
"section_title": "CONFLICTS OF INTEREST",
"body": "<p>There is no conflict of interest among the authors.There is no conflict of interest among the authors.</p>"
}
],
"figures": [
{
"figure": "https://jabet.bsmiab.org/media/article_images/2023/33/07/178-1646159464-Figure1.jpg",
"caption": "Figure 1. (A) The correlation between the thyroid-stimulating hormone (TSH) and vitamin D3; (B) The correlation between free thyroxin (FT4) and vitamin D3 status in thyroid dysregulated women patients. µIU/mL (micrograms international units per milliliter), ng/mL (nanograms per milliliter), LS mean (the mean of Longitudinal Section), SE (standard error), CI (confidence interval).",
"featured": false
},
{
"figure": "https://jabet.bsmiab.org/media/article_images/2023/33/07/178-1646159464-Figure2.jpg",
"caption": "Figure 2. (A) The correlation between iron and vitamin D3; (B) The correlation between TIBC and vitamin D3; and (C) The correlation between ferritin and vitamin D3 status in anemic women of reproductive ages. TIBC (total iron-binding capacity), µg/dL (micrograms per deciliter), ng/mL (nanograms per milliliter).",
"featured": false
},
{
"figure": "https://jabet.bsmiab.org/media/article_images/2023/33/07/178-1646159464-Figure3.jpg",
"caption": "Figure 3. (A) Two-way ANOVA and ‘Tukey’s multiple t-tests’ are showing the correlation of the variables with vitamin D3 among 13 congenital cases of IDA and TSH disorder. The stacked columns demonstrate the relationship of Iron, TIBC, Ferritin, TSH, and FT4 against vitamin D3 in the case of 13 congenital patients who had iron deficiency anemia and thyroid deficiency. (B) The level of divergence of the obtained values (from Figure 3A) contains 95% confidence considering the DBPM, SED, and CID parameters. The level of significance of correlation of vitiation D3- with the IDA causing parameters are mentioned as (*), while parameters regulating thyroid functions were illustrated as ‘#’.",
"featured": false
},
{
"figure": "https://jabet.bsmiab.org/media/article_images/2023/33/07/178-1646159464-Figure4.jpg",
"caption": "Figure 4. Illustration of the correlations of iron, TIBC, Ferritin, TSH, and FT4 of 30 physically and clinically healthy women with their individual-corresponding vitamin D3 levels.",
"featured": false
}
],
"authors": [
{
"id": 271,
"affiliation": [
{
"affiliation": "School of Biotechnology, Jiangnan University, Wuxi, Jiangsu, 214122, PR China"
}
],
"first_name": "Salauddin Al",
"family_name": "Azad",
"email": null,
"author_order": 1,
"ORCID": "http://orcid.org/0000-0002-3035-7882",
"corresponding": false,
"co_first_author": false,
"co_author": false,
"corresponding_author_info": "",
"article": 65
},
{
"id": 272,
"affiliation": [
{
"affiliation": "Department of Pharmacology, Jashore Medical College, Jashore, 7400, Bangladesh"
}
],
"first_name": "Sharmin",
"family_name": "Ahmed",
"email": null,
"author_order": 2,
"ORCID": "http://orcid.org/0000-0003-1890-457X",
"corresponding": false,
"co_first_author": false,
"co_author": false,
"corresponding_author_info": "",
"article": 65
},
{
"id": 273,
"affiliation": [
{
"affiliation": "Department of Genetic Engineering and Biotechnology, Faculty of Biological Science and Technology, Jashore University of Science and Technology, Jashore, 7408, Bangladesh"
}
],
"first_name": "Partha",
"family_name": "Biswas",
"email": null,
"author_order": 3,
"ORCID": "http://orcid.org/0000-0002-9766-756X",
"corresponding": false,
"co_first_author": false,
"co_author": false,
"corresponding_author_info": "",
"article": 65
},
{
"id": 274,
"affiliation": [
{
"affiliation": "Department of Pharmaceutical Technology, Faculty of Pharmacy, International Islamic University Malaysia, Kuantan, 25200, Malaysia"
}
],
"first_name": "Md. Abdur Rashid",
"family_name": "Mia",
"email": null,
"author_order": 4,
"ORCID": null,
"corresponding": false,
"co_first_author": false,
"co_author": false,
"corresponding_author_info": "",
"article": 65
},
{
"id": 275,
"affiliation": [
{
"affiliation": "Department of Chemistry and Biochemistry, University of Oklahoma, Norman, 73019, USA"
}
],
"first_name": "Mithila",
"family_name": "Farjana",
"email": null,
"author_order": 5,
"ORCID": "http://orcid.org/0000-0002-8145-7066",
"corresponding": false,
"co_first_author": false,
"co_author": false,
"corresponding_author_info": "",
"article": 65
},
{
"id": 276,
"affiliation": [
{
"affiliation": "Department of Biochemistry and Microbiology, North South University, Dhaka, 1229, Bangladesh"
}
],
"first_name": "Farzana Alam",
"family_name": "Arshe",
"email": null,
"author_order": 6,
"ORCID": "http://orcid.org/0000-0002-5510-3264",
"corresponding": false,
"co_first_author": false,
"co_author": false,
"corresponding_author_info": "",
"article": 65
},
{
"id": 277,
"affiliation": [
{
"affiliation": "Ministry of Health, People’s Republic of Bangladesh"
}
],
"first_name": "Sabrina Jahan",
"family_name": "Mily",
"email": null,
"author_order": 7,
"ORCID": "http://orcid.org/0000-0002-1840-7613",
"corresponding": false,
"co_first_author": false,
"co_author": false,
"corresponding_author_info": "",
"article": 65
},
{
"id": 278,
"affiliation": [
{
"affiliation": "Department of Gastroenterology, Square Hospitals LTD, Dhaka, 1205, Bangladesh"
}
],
"first_name": "Ananya Baidya",
"family_name": "Ankhi",
"email": null,
"author_order": 8,
"ORCID": null,
"corresponding": false,
"co_first_author": false,
"co_author": false,
"corresponding_author_info": "",
"article": 65
},
{
"id": 279,
"affiliation": [
{
"affiliation": "Department of Mathematics and Natural Sciences, School of Data and Sciences, BRAC University, Dhaka, 1212, Bangladesh"
}
],
"first_name": "Mahdi Mubin",
"family_name": "Shaikat",
"email": null,
"author_order": 9,
"ORCID": "http://orcid.org/0000-0002-5570-7455",
"corresponding": false,
"co_first_author": false,
"co_author": false,
"corresponding_author_info": "",
"article": 65
},
{
"id": 280,
"affiliation": [
{
"affiliation": "Enam Medical College and Hospital, Savar, Dhaka, 1340, Bangladesh"
}
],
"first_name": "Sabeeha",
"family_name": "Sultana",
"email": null,
"author_order": 10,
"ORCID": "http://orcid.org/0000-0001-9808-9645",
"corresponding": false,
"co_first_author": false,
"co_author": false,
"corresponding_author_info": "",
"article": 65
},
{
"id": 281,
"affiliation": [
{
"affiliation": "Department Public Health & Bioinformatics, Asian University for Women, Chittagong, 4000, Bangladesh"
}
],
"first_name": "Kashfia",
"family_name": "Mawa",
"email": null,
"author_order": 11,
"ORCID": "http://orcid.org/0000-0002-3456-9110",
"corresponding": false,
"co_first_author": false,
"co_author": false,
"corresponding_author_info": "",
"article": 65
},
{
"id": 282,
"affiliation": [
{
"affiliation": "Department of Animal Production and Management, Sher-e-Bangla Agricultural University, Dhaka, 1207, Bangladesh"
}
],
"first_name": "Zannatul",
"family_name": "Naim",
"email": null,
"author_order": 12,
"ORCID": "http://orcid.org/0000-0002-2771-7576",
"corresponding": false,
"co_first_author": false,
"co_author": false,
"corresponding_author_info": "",
"article": 65
},
{
"id": 283,
"affiliation": [
{
"affiliation": "Department of Biochemistry and Immunology, Ibn-Sina hospital and Diagnostic Center, Jashore 7400, Bangladesh"
}
],
"first_name": "Riazul",
"family_name": "Islam",
"email": null,
"author_order": 13,
"ORCID": "http://orcid.org/0000-0001-5517-4874",
"corresponding": false,
"co_first_author": false,
"co_author": false,
"corresponding_author_info": "",
"article": 65
},
{
"id": 284,
"affiliation": [
{
"affiliation": "Global Biotechnology & Biomedical Research Network (GBBRN), Department of Biotechnology and Genetic Engineering, Faculty of Biological Sciences, Islamic University, Kushtia, 7003, Bangladesh."
},
{
"affiliation": "Department of Pathology, College of Korean Medicine, Kyung Hee University, Seoul 02447, South Korea"
},
{
"affiliation": "Korean Medicine-Based Drug Repositioning Cancer Research Center, College of Korean Medicine, Kyung Hee University, Seoul 02447, Korea"
}
],
"first_name": "Md. Ataur",
"family_name": "Rahman",
"email": null,
"author_order": 14,
"ORCID": "http://orcid.org/0000-0001-6649-3694",
"corresponding": false,
"co_first_author": false,
"co_author": false,
"corresponding_author_info": "",
"article": 65
},
{
"id": 285,
"affiliation": [
{
"affiliation": "Department of Pathology, College of Korean Medicine, Kyung Hee University, Seoul 02447, South Korea"
},
{
"affiliation": "Korean Medicine-Based Drug Repositioning Cancer Research Center, College of Korean Medicine, Kyung Hee University, Seoul 02447, Korea"
}
],
"first_name": "Bonglee",
"family_name": "Kim",
"email": "bongleekim@khu.ac.kr",
"author_order": 15,
"ORCID": "http://orcid.org/0000-0002-8678-156X",
"corresponding": true,
"co_first_author": false,
"co_author": false,
"corresponding_author_info": "Bonglee Kim, PhD; Korean Medicine-Based Drug Repositioning Cancer Research Center, College of Korean Medicine, Kyung Hee University, Seoul 02447, Korea, email: bongleekim@khu.ac.kr",
"article": 65
}
],
"views": 1517,
"downloads": 128,
"references": [
{
"id": 2107,
"serial_number": 1,
"pmc": null,
"reference": "Bieri JG. Second report of the ad hoc committee on standards for nutritional studies. The Journal of Nutrition. 1980;110(8):1726.",
"DOI": null,
"article": 65
},
{
"id": 2108,
"serial_number": 2,
"pmc": null,
"reference": "Macgregor MW. Maternal anaemia as a factor in prematurity and perinatal mortality. Scottish Medical Journal. 1963;8(4):134-40.",
"DOI": null,
"article": 65
},
{
"id": 2109,
"serial_number": 3,
"pmc": null,
"reference": "Hentze MW, Muckenthaler MU, Galy B, Camaschella C. Two to tango: regulation of Mammalian iron metabolism. Cell. 2010;142(1):24-38.",
"DOI": null,
"article": 65
},
{
"id": 2110,
"serial_number": 4,
"pmc": null,
"reference": "McLean E, Cogswell M, Egli I, Wojdyla D, De Benoist B. Worldwide prevalence of anaemia, WHO vitamin and mineral nutrition information system, 1993–2005. Public health nutrition. 2009;12(4):444-54.",
"DOI": null,
"article": 65
},
{
"id": 2111,
"serial_number": 5,
"pmc": null,
"reference": "Kassebaum NJ, Jasrasaria R, Naghavi M, Wulf SK, Johns N, Lozano R, Regan M, Weatherall D, Chou DP, Eisele TP, Flaxman SR. A systematic analysis of global anemia burden from 1990 to 2010. Blood, The Journal of the American Society of Hematology. 2014;123(5):615-24.",
"DOI": null,
"article": 65
},
{
"id": 2112,
"serial_number": 6,
"pmc": null,
"reference": "da Costa AG, Vargas S, Clode N, Graça LM. Prevalence and risk factors for iron deficiency anemia and iron depletion during pregnancy: A prospective study. Acta medica portuguesa. 2016;29(9):514-8.",
"DOI": null,
"article": 65
},
{
"id": 2113,
"serial_number": 7,
"pmc": null,
"reference": "Gupta PM, Perrine CG, Mei Z, Scanlon KS. Iron, anemia, and iron deficiency anemia among young children in the United States. Nutrients. 2016;8(6):330.",
"DOI": null,
"article": 65
},
{
"id": 2114,
"serial_number": 8,
"pmc": null,
"reference": "Levi M, Simonetti M, Marconi E, Brignoli O, Cancian M, Masotti A, Pegoraro V, Heiman F, Cricelli C, Lapi F. Gender differences in determinants of iron-deficiency anemia: a population-based study conducted in four European countries. Annals of hematology. 2019;98(7):1573-82.",
"DOI": null,
"article": 65
},
{
"id": 2115,
"serial_number": 9,
"pmc": null,
"reference": "World Health Organization. The world health report 2002: reducing risks, promoting healthy life. World Health Organization; 2002.",
"DOI": null,
"article": 65
},
{
"id": 2116,
"serial_number": 10,
"pmc": null,
"reference": "Khan A, Khan WM, Ayub M, Humayun M, Haroon M. Ferritin is a marker of inflammation rather than iron deficiency in overweight and obese people. Journal of obesity. 2016;2016.",
"DOI": null,
"article": 65
},
{
"id": 2117,
"serial_number": 11,
"pmc": null,
"reference": "Suega K, Kandarini Y, Tubung J. Role of soluble transferrin receptor and transferrin receptor-ferritin index to detect iron deficiency anemia in regular hemodialysis patients. Open Access Macedonian Journal of Medical Sciences. 2019;7(1):97.",
"DOI": null,
"article": 65
},
{
"id": 2118,
"serial_number": 12,
"pmc": null,
"reference": "Unnikrishnan AG, Menon UV. Thyroid disorders in India: An epidemiological perspective. Indian journal of endocrinology and metabolism. 2011;15(Suppl2):S78.",
"DOI": null,
"article": 65
},
{
"id": 2119,
"serial_number": 13,
"pmc": null,
"reference": "Ansari MA. Thyroid disorders in Bangladesh-past, present, and future. Journal of Dhaka Medical College. 2014;23(2):151-2.",
"DOI": null,
"article": 65
},
{
"id": 2120,
"serial_number": 14,
"pmc": null,
"reference": "Luo J, Wang X, Yuan L, Guo L. Iron deficiency, a risk factor of thyroid disorders in reproductive-age and pregnant women: a systematic review and meta-analysis. Frontiers in endocrinology. 2021;12:93.",
"DOI": null,
"article": 65
},
{
"id": 2121,
"serial_number": 15,
"pmc": null,
"reference": "Refaat B. Prevalence and characteristics of anemia associated with thyroid disorders in non-pregnant Saudi women during the childbearing age: a cross-sectional study. Biomed J. 2015;38(4):307-16.",
"DOI": null,
"article": 65
},
{
"id": 2122,
"serial_number": 16,
"pmc": null,
"reference": "Rostaei Rad N, Vakili M, Zavar-reza J, Rezaie S, Shirvani AR. The relationship between thyroid hormone levels and body iron status in iranian hypothyroidism patients. International Journal of Medical Laboratory. 2016;3(3):176-84.",
"DOI": null,
"article": 65
},
{
"id": 2123,
"serial_number": 17,
"pmc": null,
"reference": "Sehat R, Shahabi Satlsar E, Hanachi P. Association between Iron, TIBC and Ferritin with Thyroid Hormones Levels in Patients Referred to Shouride Clinic Laboratory. Journal of Payavard Salamat. 2019;13(2):134-41.",
"DOI": null,
"article": 65
},
{
"id": 2124,
"serial_number": 18,
"pmc": null,
"reference": "Khatiwada S, Gelal B, Baral N, Lamsal M. Association between iron status and thyroid function in Nepalese children. Thyroid research. 2016;9(1):1-7.",
"DOI": null,
"article": 65
},
{
"id": 2125,
"serial_number": 19,
"pmc": null,
"reference": "Zilani M, Hasan N, Uddin SJ, Hossain H, Hazni H, Shilpi JA, et al. Chemical characterization and bioactivity of Trichosanthes dioica edible shoot extract. Oriental Pharmacy and Experimental Medicine. 2018;18(2):167-75.",
"DOI": null,
"article": 65
},
{
"id": 2126,
"serial_number": 20,
"pmc": null,
"reference": "He L, Shen C, Zhang Y, Chen Z, Ding H, Liu J, et al. Evaluation of serum ferritin and thyroid function in the second trimester of pregnancy. Endocrine Journal. 2018;65(1):75-82.",
"DOI": null,
"article": 65
},
{
"id": 2127,
"serial_number": 21,
"pmc": null,
"reference": "Shukla A, Agarwal S, Gupta A, Sarkar G. Relationship between body iron status and thyroid profile in an adult population: a hospital based study. Natl J Lab Med. 2017;2:1.",
"DOI": null,
"article": 65
},
{
"id": 2128,
"serial_number": 22,
"pmc": null,
"reference": "El-Masry H, Hamed AM, Hassan MH, FAyEd HM, Abdelzaher MH. Thyroid Function among Children with Iron Deficiency Anaemia: Pre and Post Iron Replacement Therapy. Journal of Clinical & Diagnostic Research. 2018;12(1).",
"DOI": null,
"article": 65
},
{
"id": 2129,
"serial_number": 23,
"pmc": null,
"reference": "Mostafa GG, Zahran FE, Omer SA, Ibrahim A, Elhakeem H. The effect of serum ferritin level on gonadal, prolactin, thyroid hormones, and thyroid stimulating hormone in adult males with sickle cell anemia. Journal of Blood Medicine. 2020;11:27.",
"DOI": null,
"article": 65
},
{
"id": 2130,
"serial_number": 24,
"pmc": null,
"reference": "Dahiya K, Verma M, Dhankhar R, Ghalaut VS, Ghalaut PS, Sachdeva A, Malik I, Kumar R. Thyroid profile and iron metabolism: mutual relationship in hypothyroidism. Biomedical Research. 2016;27(4):1212-5.",
"DOI": null,
"article": 65
},
{
"id": 2131,
"serial_number": 25,
"pmc": null,
"reference": "Al Azad S, Ahmed S, Biswas P, et al. Quantitative Analysis of the Steroidal Calcitriol-Mediated Regulation of the Serological Components Responsible for IDA and TSH Disorders in Reproductive and Nonproductive Women. Preprints.org. 2021; DOI: 10.20944/preprints202110.0007.v1.",
"DOI": null,
"article": 65
},
{
"id": 2132,
"serial_number": 26,
"pmc": null,
"reference": "Olmos-Ortiz A, Avila E, Durand-Carbajal M, Díaz L. Regulation of calcitriol biosynthesis and activity: focus on gestational vitamin D deficiency and adverse pregnancy outcomes. Nutrients. 2015;7(1):443-80.",
"DOI": null,
"article": 65
},
{
"id": 2133,
"serial_number": 27,
"pmc": null,
"reference": "Nair R, Maseeh A. Vitamin D: The “sunshine” vitamin. Journal of pharmacology & pharmacotherapeutics. 2012;3(2):118.",
"DOI": null,
"article": 65
},
{
"id": 2134,
"serial_number": 28,
"pmc": null,
"reference": "Holick MF, Chen TC. Vitamin D deficiency: a worldwide problem with health consequences. The American journal of clinical nutrition. 2008;87(4):1080S-6S.",
"DOI": null,
"article": 65
},
{
"id": 2135,
"serial_number": 29,
"pmc": null,
"reference": "Anwar E, Farhana N. Formulation and Evaluation of Phytosome-Loaded Maltodextrin-Gum Arabic Microsphere System for Delivery of Camellia sinensis Extract. Journal of Young Pharmacists. 2018;10.",
"DOI": null,
"article": 65
},
{
"id": 2136,
"serial_number": 30,
"pmc": null,
"reference": "Mackawy AM, Al-Ayed BM, Al-Rashidi BM. Vitamin D deficiency and its association with thyroid disease. International journal of health sciences. 2013;7(3):267.",
"DOI": null,
"article": 65
},
{
"id": 2137,
"serial_number": 31,
"pmc": null,
"reference": "Ashraf TS, De Sanctis V, Yassin M, Wagdy M, Soliman N. Chronic anemia and thyroid function. Acta Bio Medica: Atenei Parmensis. 2017;88(1):119.",
"DOI": null,
"article": 65
},
{
"id": 2138,
"serial_number": 32,
"pmc": null,
"reference": "Garabédian M, Jacqz E, Guillozo H, Grimberg R, Guillot M, Gagnadoux MF, Broyer M, Lenoir G, Balsan S. Elevated plasma 1, 25-dihydroxyvitamin D concentrations in infants with hypercalcemia and an elfin facies. New England Journal of Medicine. 1985;312(15):948-52.",
"DOI": null,
"article": 65
},
{
"id": 2139,
"serial_number": 33,
"pmc": null,
"reference": "amanishi H, Iyama S, Yamaguchi Y, Kanakura Y, Iwatani Y. Modification of fully automated total iron-binding capacity (TIBC) assay in serum and comparison with dimension TIBC method. Clinical chemistry. 2002;48(9):1565-70.",
"DOI": null,
"article": 65
},
{
"id": 2140,
"serial_number": 34,
"pmc": null,
"reference": "Islam R, Akter KM, Rahman A, Khanam NN, Al Azad S, Islam MR, et al. The serological basis of the correlation between iron deficiency anemia and thyroid disorders in women: a community based study. J Pharm Res Int. 2021:69–81. https://doi.org/10.9734/jpri/2021/v33i19A31330.",
"DOI": null,
"article": 65
},
{
"id": 2141,
"serial_number": 35,
"pmc": null,
"reference": "Srinivasan B, Finkelstein JL, O’Dell D, Erickson D, Mehta S. Rapid diagnostics for point-of-care quantification of soluble transferrin receptor. EBioMedicine. 2019;42:504-10.",
"DOI": null,
"article": 65
},
{
"id": 2142,
"serial_number": 36,
"pmc": null,
"reference": "Milionis A, Milionis C. Correlation between body mass index and thyroid function in euthyroid individuals in Greece. International Scholarly Research Notices. 2013.",
"DOI": null,
"article": 65
},
{
"id": 2143,
"serial_number": 37,
"pmc": null,
"reference": "ZHAO H, WEN H, LIU Y, CAO L, DUAN Y, ZHENG X, HOU Z, LI X. The correlation between 25-hydroxy-vitamin D and serological indexes, immunological indexes in patients with rheumatoid arthritis. Chinese Journal of Rheumatology. 2019:95-101.",
"DOI": null,
"article": 65
},
{
"id": 2144,
"serial_number": 38,
"pmc": null,
"reference": "Erkan EP, Ströbel T, Dorfer C, Sonntagbauer M, Weinhäusel A, Saydam N, Saydam O. Circulating tumor biomarkers in meningiomas reveal a signature of equilibrium between tumor growth and immune modulation. Frontiers in oncology. 2019:1031.",
"DOI": null,
"article": 65
},
{
"id": 2145,
"serial_number": 39,
"pmc": null,
"reference": "Mantus G, Nyhoff LE, Kauffman RC, Edara VV, Lai L, Floyd K, Shi PY, Menachery VD, Edupuganti S, Scherer EM, Kay A. Evaluation of cellular and serological responses to acute SARS-CoV-2 infection demonstrates the functional importance of the receptor-binding domain. The Journal of Immunology. 2021;206(11):2605-13.",
"DOI": null,
"article": 65
},
{
"id": 2146,
"serial_number": 40,
"pmc": null,
"reference": "Komatsu N, Saijoh K, Kuk C, Liu AC, Khan S, Shirasaki F, Takehara K, Diamandis EP. Human tissue kallikrein expression in the stratum corneum and serum of atopic dermatitis patients. Experimental dermatology. 2007;16(6):513-9.",
"DOI": null,
"article": 65
},
{
"id": 2147,
"serial_number": 41,
"pmc": null,
"reference": "Robnett TJ, Machtay M, Hahn SM, Shrager JB, Friedberg JS, Kaiser LR. Pathological Response to Preoperative Chemoradiation Worsens with Anemia in Non—Small Cell Lung Cancer Patients. The Cancer Journal. 2002;8(3):263-7.",
"DOI": null,
"article": 65
},
{
"id": 2148,
"serial_number": 42,
"pmc": null,
"reference": "Alvarez-García G, García-Culebras A, Gutiérrez-Expósito D, Navarro-Lozano V, Pastor-Fernández I, Ortega-Mora LM. Serological diagnosis of bovine neosporosis: a comparative study of commercially available ELISA tests. Veterinary parasitology. 2013;198(1-2):85-95.",
"DOI": null,
"article": 65
},
{
"id": 2149,
"serial_number": 43,
"pmc": null,
"reference": "Arefin A, Ema TI, Islam T, Hossen MS, Islam T, Al Azad S, et al. Target specificity of selective bioactive compounds in blocking α-dystroglycan receptor to suppress Lassa virus infection: an in silico approach. Journal of Biomedical Research. 2021;35(6):459. https://doi.org/10.7555/JBR.35.20210111",
"DOI": null,
"article": 65
},
{
"id": 2150,
"serial_number": 44,
"pmc": null,
"reference": "Nipun TS, Ema TI, Mia MA, Hossen MS, Arshe FA, Ahmed SZ, et al. Active site-specific quantum tunneling of hACE2 receptor to assess its complexing poses with selective bioactive compounds in co-suppressing SARS-CoV-2 influx and subsequent cardiac injury. Journal of Advanced Veterinary and Animal Research. 2021;8(4):540-56. http://doi.org/10.5455/javar.2021.h544",
"DOI": null,
"article": 65
},
{
"id": 2151,
"serial_number": 45,
"pmc": null,
"reference": "Lüth S, Herkel J, Kanzler S, Frenzel C, Galle PR, Dienes HP, Schramm C, Lohse AW. Serologic markers compared with liver biopsy for monitoring disease activity in autoimmune hepatitis. Journal of clinical gastroenterology. 2008;42(8):926-30.",
"DOI": null,
"article": 65
},
{
"id": 2152,
"serial_number": 46,
"pmc": null,
"reference": "Vreugdenhil G, Baltus CA, Van Eijk HG, Swakk AJ. Anaemia of chronic disease: Diagnostic significance of erythrocyte and serological parameters in iron deficient rhuematiod arthritis pateints. Rheumatology. 1990;29(2):105-10.",
"DOI": null,
"article": 65
},
{
"id": 2153,
"serial_number": 47,
"pmc": null,
"reference": "Akter KM, Tushi T, Jahan Mily S, Mohona RA, Anis S, Chakraborty AK, et al. RT-PCR Mediated Identification of SARS-CoV-2 patients from particular regions of Bangladesh and the multi-factorial analysis considering their pre and post infection health conditions. Biotechnol J Int. 2020;24(6):43–56. https://doi.org/10.9734/bji/2020/v24i630121.",
"DOI": null,
"article": 65
},
{
"id": 2154,
"serial_number": 48,
"pmc": null,
"reference": "Dey D, Paul PK, Al Azad S, Al Mazid MF, Khan AM, Sharif MA, et al. Molecular optimization, docking, and dynamic simulation profiling of selective aromatic phytochemical ligands in blocking the SARS-CoV-2 S protein attachment to ACE2 receptor: an in silico approach of targeted drug designing. J Adv Vet Anim Res. 2021;8(1):24. https://doi.org/10.5455/javar.2021.h481.",
"DOI": null,
"article": 65
},
{
"id": 2155,
"serial_number": 49,
"pmc": null,
"reference": "Sharif MA, Hossen MS, Shaikat MM, Mashuk F, Haidary TI, Dey D, et al. Molecular optimization, docking and dynamic simulation study of selective natural aromatic components to block E2-CD81 complex formation in predating protease inhibitor resistant HCV influx. Int J Pharm Res. 2021;13(2) https://doi.org/10/318.38/ijpr/2021.13.02.408.",
"DOI": null,
"article": 65
},
{
"id": 2156,
"serial_number": 50,
"pmc": null,
"reference": "Al Azad S, Moazzem Hossain K, Rahman SM, Al Mazid MF, Barai P, Gazi MS. In ovo inoculation of duck embryos with different strains of Bacillus cereus to analyse their synergistic post-hatch anti-allergic potentialities. Veterinary medicine and science. 2020;6(4):992-9. doi: 10.1002/vms3.279",
"DOI": null,
"article": 65
},
{
"id": 2157,
"serial_number": 51,
"pmc": null,
"reference": "Rashaduzzaman M, Kamrujjaman M, Islam MA, Ahmed S, Al Azad S. An experimental analysis of different point specific musculoskeletal pain among selected adolescent-club cricketers in Dhaka city. Eur J Clin Exp Med. 2019;17(4):308–14. https://doi.org/10.15584/ejcem.2019.4.4.",
"DOI": null,
"article": 65
},
{
"id": 2158,
"serial_number": 52,
"pmc": null,
"reference": "Al Azad S, Farjana M, Mazumder B, Abdullah-Al-Mamun M, Haque AI. Molecular identification of a Bacillus cereus strain from Murrah buffalo milk showed in vitro bioremediation properties on selective heavy metals. Journal of advanced veterinary and animal research. 2020;7(1):62. doi: 10.5455/javar.2020.g394",
"DOI": null,
"article": 65
},
{
"id": 2159,
"serial_number": 53,
"pmc": null,
"reference": "Paul PK, Azad SA, Rahman MH, Farjana M, Uddin MR, Dey D, et al. Catabolic profiling ofselective enzymesin the saccharification of nonfood lignocellulose parts of biomassinto functional edible sugars and bioenergy: An in silico bioprospecting. J Adv Vet Anim Res. 2022; 9(1):19–32. http://doi.org/10.5455/javar.2022.i565",
"DOI": null,
"article": 65
},
{
"id": 2160,
"serial_number": 54,
"pmc": null,
"reference": "Kmieć P, Sworczak K. Vitamin D in thyroid disorders. Experimental and Clinical Endocrinology & Diabetes. 2015;123(07):386-93.",
"DOI": null,
"article": 65
},
{
"id": 2161,
"serial_number": 55,
"pmc": null,
"reference": "Wacker M, Holick MF. Sunlight and Vitamin D: A global perspective for health. Dermato-endocrinology. 2013;5(1):51-108.",
"DOI": null,
"article": 65
},
{
"id": 2162,
"serial_number": 56,
"pmc": null,
"reference": "Mele C, Caputo M, Bisceglia A, Samà MT, Zavattaro M, Aimaretti G, Pagano L, Prodam F, Marzullo P. Immunomodulatory effects of vitamin D in thyroid diseases. Nutrients. 2020;12(5):1444.",
"DOI": null,
"article": 65
},
{
"id": 2163,
"serial_number": 57,
"pmc": null,
"reference": "Ahmed F, Khan MR, Shaheen N, Ahmed KM, Hasan A, Chowdhury IA, Chowdhury R. Anemia and iron deficiency in rural Bangladeshi pregnant women living in areas of high and low iron in groundwater. Nutrition. 2018;51:46-52.",
"DOI": null,
"article": 65
},
{
"id": 2164,
"serial_number": 58,
"pmc": null,
"reference": "Harjantini U, Dewi YL, Hanim D, Nurwati I. Correlation of dietary iron intake and serum iron with thyroid stimulating hormone (TSH) and free thyroxine (FT4) levels in adult hyperthyroid patients. Journal of basic and clinical physiology and pharmacology. 2021;32(4):571-6.",
"DOI": null,
"article": 65
},
{
"id": 2165,
"serial_number": 59,
"pmc": null,
"reference": "Esan AJ. Hematological differences in newborn and aging: a review study. Hematol Transfus Int J. 2016;3(3):178-90.",
"DOI": null,
"article": 65
},
{
"id": 2166,
"serial_number": 60,
"pmc": null,
"reference": "Kim D. The role of vitamin D in thyroid diseases. International journal of molecular sciences. 2017;18(9):1949.",
"DOI": null,
"article": 65
},
{
"id": 2167,
"serial_number": 61,
"pmc": null,
"reference": "Heaney RP. Toward a physiological referent for the vitamin D requirement. Journal of endocrinological investigation. 2014;37(11):1127-30.",
"DOI": null,
"article": 65
},
{
"id": 2168,
"serial_number": 62,
"pmc": null,
"reference": "Larijani B, Hossein-Nezhad A, Feizabad E, Maghbooli Z, Adibi H, Ramezani M, Taheri E. Vitamin D deficiency, bone turnover markers and causative factors among adolescents: a cross-sectional study. Journal of Diabetes & Metabolic Disorders. 2016;15(1):1-6.",
"DOI": null,
"article": 65
},
{
"id": 2169,
"serial_number": 63,
"pmc": null,
"reference": "Bañón S, Rosillo M, Gómez A, Pérez-Elias MJ, Moreno S, Casado JL. Effect of a monthly dose of calcidiol in improving vitamin D deficiency and secondary hyperparathyroidism in HIV-infected patients. Endocrine. 2015;49(2):528-37.",
"DOI": null,
"article": 65
},
{
"id": 2170,
"serial_number": 64,
"pmc": null,
"reference": "El Hilali J, de Koning EJ, van Ballegooijen AJ, Lips P, Sohl E, van Marwijk HW, Visser M, van Schoor NM. Vitamin D, PTH and the risk of overall and disease-specific mortality: results of the Longitudinal Aging Study Amsterdam. The Journal of steroid biochemistry and molecular biology. 2016;164:386-94.",
"DOI": null,
"article": 65
},
{
"id": 2171,
"serial_number": 65,
"pmc": null,
"reference": "Lee JA, Hwang JS, Hwang IT, Kim DH, Seo JH, Lim JS. Low vitamin D levels are associated with both iron deficiency and anemia in children and adolescents. Pediatric hematology and oncology. 2015;32(2):99-108.",
"DOI": null,
"article": 65
},
{
"id": 2172,
"serial_number": 66,
"pmc": null,
"reference": "Sim JJ, Lac PT, Liu IL, Meguerditchian SO, Kumar VA, Kujubu DA, Rasgon SA. Vitamin D deficiency and anemia: a cross-sectional study. Annals of hematology. 2010;89(5):447-52.",
"DOI": null,
"article": 65
},
{
"id": 2173,
"serial_number": 67,
"pmc": null,
"reference": "Blanco-Rojo R, Pérez-Granados AM, Toxqui L, Zazo P, de la Piedra C, Vaquero MP. Relationship between vitamin D deficiency, bone remodelling and iron status in iron-deficient young women consuming an iron-fortified food. European journal of nutrition. 2013;52(2):695-703.",
"DOI": null,
"article": 65
},
{
"id": 2174,
"serial_number": 68,
"pmc": null,
"reference": "Raveendran AV, Shiji PV, Rajini P, Al Qassabi FS. Iron deficiency anemia: an update. BMH Medical Journal-ISSN 2348–392X. 2019;6(4):116-30.",
"DOI": null,
"article": 65
},
{
"id": 2175,
"serial_number": 69,
"pmc": null,
"reference": "Malczewska-Lenczowska J, Sitkowski D, Surała O, Orysiak J, Szczepańska B, Witek K. The association between Iron and vitamin D status in female elite athletes. Nutrients. 2018;10(2):167.",
"DOI": null,
"article": 65
},
{
"id": 2176,
"serial_number": 70,
"pmc": null,
"reference": "Kumari S, Swetha P, Nayak S, Singh S. The Association Between Ferritin and Vitamin D Levels in Premenopausal Fibroid Uterus Cases with Anemia. Cureus. 2021;13(2).",
"DOI": null,
"article": 65
},
{
"id": 2177,
"serial_number": 71,
"pmc": null,
"reference": "Bacchetta J, Zaritsky JJ, Sea JL, Chun RF, Lisse TS, Zavala K, Nayak A, Wesseling-Perry K, Westerman M, Hollis BW, Salusky IB. Suppression of iron-regulatory hepcidin by vitamin D. Journal of the American Society of Nephrology. 2014;25(3):564-72.",
"DOI": null,
"article": 65
},
{
"id": 2178,
"serial_number": 72,
"pmc": null,
"reference": "Seong JM, Yoon YS, Lee KS, Bae NY, Gi MY, Yoon H. Gender difference in relationship between serum ferritin and 25-hydroxyvitamin D in Korean adults. PloS one. 2017;12(5):e0177722.",
"DOI": null,
"article": 65
},
{
"id": 2179,
"serial_number": 73,
"pmc": null,
"reference": "Iyer KM. Metabolic and Endocrine Disorders. InGeneral Principles of Orthopedics and Trauma. 2019; 183-248.",
"DOI": null,
"article": 65
},
{
"id": 2180,
"serial_number": 74,
"pmc": null,
"reference": "Wang Y, Li H, Zheng M, Wu Y, Zeng T, Fu J, Zeng D. Maternal vitamin D deficiency increases the risk of adverse neonatal outcomes in the Chinese population: A prospective cohort study. PLoS One. 2018;13(4):e0195700.",
"DOI": null,
"article": 65
},
{
"id": 2181,
"serial_number": 75,
"pmc": null,
"reference": "Luster M, Duntas LH, Wartofsky L. The Thyroid and Its Diseases; Springer: pringer International Publishing AG. 2019.",
"DOI": null,
"article": 65
},
{
"id": 2182,
"serial_number": 76,
"pmc": null,
"reference": "Marei E, ُElmaghraby D, Gad AA. Vitamin D assessment in iron deficiency anemic pregnant women and their newborns. Egyptian Journal of Radiation Sciences and Applications. 2017;30(1):63-72.",
"DOI": null,
"article": 65
},
{
"id": 2183,
"serial_number": 77,
"pmc": null,
"reference": "Braun V, Hantke K. Recent insights into iron import by bacteria. Current opinion in chemical biology. 2011;15(2):328-34.",
"DOI": null,
"article": 65
},
{
"id": 2184,
"serial_number": 78,
"pmc": null,
"reference": "Brazaca SG, da Silva FC. Enhancers and inhibitors of iron availability in legumes. Plant Foods for Human Nutrition. 2003;58(3):1-8.",
"DOI": null,
"article": 65
},
{
"id": 2185,
"serial_number": 79,
"pmc": null,
"reference": "Abdullah-Al-Mamun M, Jakir Hasan M, Al Azad S, Giash Uddin M, Shahriyar S, Jyoti Mondal K. Evaluation of potential probiotic characteristics of isolated lactic acid bacteria from goat milk. Biotechnol J Int. 2016;14(2):1-7. https://doi.org/10.9734/BBJ/2016/26397",
"DOI": null,
"article": 65
},
{
"id": 2186,
"serial_number": 80,
"pmc": null,
"reference": "Dipta DE, Tanzila Ismail EM, Partha BISWAS SA, Shoeba Islam UR, Firoz M, Ahmed SZ, Salauddin AL, Rahman A, Afrin S, Mahedi RA, Badal MN. Antiviral effects of bacteriocin against animal-to-human transmittable mutated sars-cov-2: a systematic review. Front. Agric. Sci. Eng. 2021;8:603-22. DOI: 10.15302/J-FASE-2021397",
"DOI": null,
"article": 65
},
{
"id": 2187,
"serial_number": 81,
"pmc": null,
"reference": "Szabo M, Kovathana N, Gordon K, Frohmani LA. Effect of passive immunization with an antiserum to thyrotropin (TSH)-releasing hormone on plasma TSH levels in thyroidectomized rats. Endocrinology. 1978;102(3):799-805.",
"DOI": null,
"article": 65
},
{
"id": 2188,
"serial_number": 82,
"pmc": null,
"reference": "Al Azad S, Shahriyar S, Mondal KJ. Opsonin and its mechanism of action in secondary immune. Journal of Molecular Studies and Medicine Research. 2016;1(02):48-56. DOI: 10.18801/jmsmr.010216.06",
"DOI": null,
"article": 65
}
]
},
{
"id": 78,
"slug": "178-1642570027-optimization-of-surface-sterilization-method-for-the-isolation-of-endophytic-fungi-associated-with-curcuma-longa-l-and-their-antibacterial-activity",
"featured": false,
"slider": false,
"issue": "Vol5 Issue2",
"type": "original_article",
"manuscript_id": "178-1642570027",
"recieved": "2022-01-22",
"revised": null,
"accepted": "2022-04-07",
"published": "2022-04-13",
"pdf_file": "https://jabet.bsmiab.org/media/pdf_file/2023/07/178-1642570027.pdf",
"title": "Optimization of surface sterilization method for the isolation of endophytic fungi associated with Curcuma longa L. and their antibacterial activity",
"abstract": "<p>Medicinal plants have been extensively studied since ancient times and exploited for their various therapeutic applications. These plants have a repository of numerous beneficial chemical constituents imputable to their possible bioactive metabolites. Throughout the ages, turmeric (<em>Curcuma longa</em> L.) has a renowned nutritional and therapeutic importance. Each part of turmeric like rhizome, roots, stems, and leaves has its own medicinal properties. Inorder to recover endophytic mycoflora, epiphytic mycoflora must be eliminated via different sterilization techniques. In the present study, different sterilization methods have been assessed to isolate fungal endophytes from different parts of <em>Curcuma longa</em> L. The method involving the sequential washing of plant tissues with ethanol, sodium hypochlorite and ethanol used found more proficient in eliminating epiphytes. Five different surface sterilization treatments were evaluated for rhizome, roots, stem, and leaves of turmeric plant. Moreover, treatment 5 with combination of 70% ethanol for 1 min., followed by 2% sodium chloride for 2 to 3 min (2 min for leaf, and stem; 3 min for roots and rhizome) and 70 % ethanol for 30 seconds was found effective. A total of 38 fungal endophytes were recovered and screened for antibacterial activity against human pathogens <em>Staphylococcus aureus</em>, <em>Bacillus cereus</em>, <em>Pseudomonas aeruginosa</em> and <em>Escherichia coli</em>. Out of 38 isolates, only 11 (28.9%) isolates were found effective in inhibiting either one or all test pathogens. The results confirmed that turmeric plant of Haridwar region represents an extremely rich reservoir of potential endophytic mycoflora with possible source of novel bioactive metabolites. Further studies will resolute the potential of endophytic fungi for various biological activities such as antioxidant, antidiabetic and immunomodulatory.</p>",
"journal_reference": "J Adv Biotechnol Exp Ther. 2022; 5(2): 334-346.",
"academic_editor": "Md Jamal Uddin, PhD; ABEx Bio-Research Center, Dhaka, Bangladesh.",
"cite_info": "Deepak H, Virk V. Optimization of surface sterilization method for the isolation of endophytic fungi associated with Curcuma longa L. and their antibacterial activity. J Adv Biotechnol Exp Ther. 2022; 5(2): 334-346.",
"keywords": [
"Antibacterial activity",
"Curcuma longa",
"Endophytic fungi",
"Surface sterilization"
],
"DOI": "10.5455/jabet.2022.d119",
"sections": [
{
"section_number": 1,
"section_title": "INTRODUCTION",
"body": "<p><em>Curcuma longa</em> (Turmeric) also known as Haldi, is a traditional Indian medicinal plant, a perennial member of the Zingiberaceae family. It is believed that the plant originated from Southeast Asia and is widely distributed among tropical and subtropical regions [<a href=\"#r-1\">1</a>]. The main constituent of turmeric includes the curcuminoids, i.e., curcumin, demethoxycurcumin, and bisdemethoxycurcumin. The yellow color of turmeric is mainly due to the presence of curcumin in rhizome. Curcumin is a phenolic compound derived from the phenyl alanine and constitutes the major portion of food and nutraceutical. Curcumin has been reported to possess various biological activities such as antimicrobial, antioxidant, antidiabetic, anti-inflammatory and anticancer [<a href=\"#r-12\">2</a>]. Turmeric is a golden spice cultivated in India since ancient times. Turmeric also possesses a variety of medicinal properties, including anti-inflammatory, antioxidant, hepatoprotective, antimalarial and anticancer, antidiabetic, antimicrobial, antidepressants, cardiovascular diseases, gastrointestinal disorders and anti-inflammatory [<a href=\"#r-3\">3-7</a>]. Traditional medicinal plants are the treasure house for isolating endophytic species including bacteria, fungi, and actinomycetes, which can produce essential secondary metabolites [<a href=\"8#r-1\">8, 9</a>]. Within a plant, there is an existence of endophytic mycoflora, which robust within the healthy tissues, asymptomatically and assisting their host in a number of ways such as plant growth promotion, resistance against pathogens and production of secondary metabolites. Simultaneously, there has been a continual search for the discovery of novel bioactive compounds from endophytic mycoflora. Turmeric has been associated with a myriad of endophytic bacteria or endophytic fungi which protect the plant against biotic (defense against herbivory, allelopathic changes, protection from pathogens) and abiotic stresses (drought tolerance, salinity, temperature stress, heavy metal tolerance) and establishing host-plant symbiosis by supplying nutrients to the host [<a href=\"#r-1\">1</a>].<br />\r\nEndophytes may penetrate the host plants either horizontally or vertically. Endophytic fungi compete with epiphytes and plant pathogens through the secretion of bioactive secondary metabolites. Thus, effective colonization helps in the regulation of a balanced host-endophyte relationship. Endophytic fungi also influence the host plants plant’s ability to fight disease caused by parasitic nematodes by several means, such as antibiosis, secretion of extracellular hydrolytic enzymes, parasitism, and hormones that promote plant defense mechanisms [<a href=\"#r-1 0\">10</a>].<br />\r\nThere is numerous research available for the isolation of endophytic fungi from different plant tissues [<a href=\"#r-1 1\">11</a>]. The recovery of the endophytic microbiome usually depends on the sterilant used for surface sterilization method for the removal of epiphytes. The isolation of endophytes also depends on various factors like age of the plant, type of plant tissue, surface sterilant concentration, and time of exposure [<a href=\"#r-1 2\">12</a>]. Surface sterilization is the most critical and threshold stage for recovering the fungal endophytes from inter/intracellular niches from the host plant, concomitantly eliminating the surface epiphytes [<a href=\"#r-1 1\">11, 14</a>]. The most common chemical sterilant include ethanol, sodium hypochlorite, formaldehyde, and mercuric chloride [<a href=\"#r-1 3\">13</a>]. But formaldehyde and mercuric chloride are excluded from our study due to their adverse deleterious effects. Also increased exposure time for surface sterilization may damage the plant tissue and hamper the recovery of endophytes [<a href=\"#r-12\">12</a>]. The process of sterilization is difficult to carry out because the conditions required to kill the last bacterium or fungal spore on the surface may be lethal to some endophytic mycoflora as the sterilizing agent may penetrate the host tissue. Furthermore, a single sterilizing agent is ineffective to recover true fungal endophytes. Moreover, the use of different media for recovery of endophytic fungi resulting in the increased diversity of isolated fungi.<br />\r\nOnly a few plants have been thoroughly investigated in terms of their endophytic mycoflora. There is a need to discover novel and beneficial endophytic microbes among the diverse range of plants found in various ecosystems. Studies on endophytic fungi from <em>C. longa </em>mostly focused on inhibitory activity [<a href=\"#r-1 5\">15</a>], plant growth promotion, antagonistic and biocontrol agents [<a href=\"#r-1 6\">16, 17</a>]. To the best of our knowledge, this is the first report on isolation of endophytic fungi from <em>C. longa</em> from Haridwar region of Uttarakhand, India which is in the foothills of the Himalayas, Uttarakhand and a typical low-lying territory flooded with water, valley, basin, marshy ground, marsh, swamp, and meadow. Endophytes acclimatized to such a unique environment are more likely to create novel bioactive metabolites. Therefore, our aim of present research work was to carry out to the influence of different sterilizing agents on isolation of endophytic fungi from rhizome, roots, stem and leaves of <em>C. longa</em> and their antimicrobial activity against human pathogens.</p>"
},
{
"section_number": 2,
"section_title": "MATERIALS AND METHODS",
"body": "<p><strong>Chemicals</strong><br />\r\nPotato Dextrose Agar (PDA), Rose Bengal Agar (RBA), Water Agar (WA), Muller Hinton Agar (MHA) and Lactophenol cotton blue stain were obtained from HiMedia (Mumbai, India). Ethanol and sodium hypochlorite were procured from Sigma Chemical Company Ltd. (Aldrich, USA).</p>\r\n\r\n<p> </p>\r\n\r\n<p><strong>Collection of plant material</strong><br />\r\nRhizome, roots, stem, and leaves of healthy <em>Curcuma longa</em> L. plants were collected from the Haridwar region (latitude and longitude: 29.9457° N, 78.1642° E) of Uttarakhand, India in the month of July 2020 to December 2020. Three different sites were selected for isolation of fungal endophytes, i.e., Bahadrabad, Panjanhedi and Gurukula. The plant material was brought to the laboratory in sterile polyethylene bags (Himedia) and processed within a few hours after collection. Healthy and fresh plants were selected for the isolation of endophytic fungi. Explants that showed signs of physical damage or pathogenic infection were excluded from the study (<a href=\"#figure1\">Figure 1</a>).</p>\r\n\r\n<div id=\"figure1\">\r\n<figure class=\"image\"><img alt=\"\" height=\"336\" src=\"/media/article_images/2023/54/07/178-1642570027-Figure1.jpg\" width=\"373\" />\r\n<figcaption><strong>Figure 1. </strong>Collection site of <em>Curcuma longa</em> L. (Turmeric).</figcaption>\r\n</figure>\r\n\r\n<p> </p>\r\n</div>\r\n\r\n<p><strong>Isolation of endophytic fungi</strong><br />\r\nEndophytic fungi were isolated from <em>Curcuma longa</em> using a standard protocol with minor modifications [<a href=\"#r-1 7\">17</a>]. The most frequent method for isolating fungal endophytes is to surface sterilize the plant parts before plating it into the desired medium. The following stages were involved in the isolation and purification of endophytic fungi from plant tissue:</p>\r\n\r\n<p><em>Pre-treatment</em><br />\r\nPre-treatment includes washing of plant parts separately under running tap water for 10 to 15 minutes to remove dirt and debris from their superficial surface, followed by washing with sterile distilled water [<a href=\"#r-18\">18</a>].</p>\r\n\r\n<p><em>Surface sterilization</em><br />\r\nSodium hypochlorite and ethanol were utilized as sterilizing agents, either alone or in combination, at various concentrations, to evaluate the surface sterilization process. Surface sterilization was done by sequentially rinsing the plant materials (rhizome, roots, stem and leaves) with different sterilizing agent mentioned in <a href=\"#Table-1\">Table 1</a> for a specific period of time and followed by washing with sterile distilled water 2 to 3 times. Plant materials then dried in between folds of sterile filter paper under aseptic conditions.</p>\r\n\r\n<div id=\"Table-1\">\r\n<p><a href=\"https://jabet.bsmiab.org/table/178-1642570027-table1/\">Table-1</a><strong>Table 1. </strong>List of treatments used for the sterilization.</p>\r\n\r\n<p> </p>\r\n</div>\r\n\r\n<p><em>Efficiency of surface sterilization</em><br />\r\nThere are four different methods to access the sterility check of surface sterilized plant tissues. Firstly, by imprinting the surface-sterilized tissue onto the potato dextrose agar, culturing of aliquots of the last wash solution onto PDA medium, dipping of the surface sterilized plant tissue in sterile distilled water and potato dextrose broth to observe the viability of microorganisms [<a href=\"#r-11\">11</a>, <a href=\"#r-1 9\">19</a>] and finally by touching of the surface sterilized plant tissue with transparent cello adhesive tape and placing it on the lactophenol cotton blue stained slide.</p>\r\n\r\n<p> </p>\r\n\r\n<p><strong>Media for isolation of endophytic fungi</strong><br />\r\nThe choice of growth medium is essential as it directly influences the number of cultivable endophytic fungi isolated from plant tissues. For isolating endophytic fungi, standard media were used such as PDA, RBA, and WA. The growth medium was supplemented with standard antibiotic, chloramphenicol to avoid the growth of bacteria.</p>\r\n\r\n<p> </p>\r\n\r\n<p><strong>Isolation and identification of endophytic fungi</strong><br />\r\nThe surface sterilized plant tissues were cut into 0.5 x 0.5 cm pieces aseptically transferred onto the petri dishes with sterile forceps containing PDA, RBA and WA supplemented with antibiotics. Plates containing explants were sealed with parafilm and incubated at 25 ± 2°C for 7 days. The plates were observed for the formation of fungal colonies. The hyphal tips from the growing edges of the treated explants were picked with sterile needle and transferred aseptically onto a fresh PDA medium devoid of antibiotic. The isolated endophytic fungi were identified on the basis of their morphological characteristics such as fungal growth topography, colony colour, spore generation, growth rate, and colony margin with the help of lactophenol cotton blue staining [<a href=\"#r-20\">20, 21</a>]. The isolated endophytic fungi were identified using the cello tape scotch method [<a href=\"#r-22\">22</a>] and examined under a microscope at a magnification of 40 X. The pure cultures were maintained on PDA medium for further study.</p>\r\n\r\n<p> </p>\r\n\r\n<p><strong>Screening for antibacterial activity by agar disc diffusion assay</strong><br />\r\nThe antibacterial activity of isolated endophytic fungi was carried out using agar disc diffusion method for the rapid selection of bioactive microorganisms [<a href=\"#r-23\">23</a>]. Two gram-positive bacteria: <em>Staphylococcus aureus </em>(MTCC 96) and <em>Bacillus cereus </em>(MTCC 430) and two gram-negative bacteria: <em>Pseudo­monas aeruginosa </em>(MTCC 3163) and <em>Escherichia coli </em>(MTCC 77) were obtained from Institute of Microbial Technology, Chandigarh, India and used for the antibacterial activity. The overnight cultures of test bacteria were subsequently adjusted to 0.5 McFarland standards. The 100µl of test bacteria were inoculated over the MHA plates using a sterile cotton swab. All the isolated endophytic fungal isolates were cultivated on PDA for 7 days at 25±2°C. The mycelial discs (6mm in diameter) were cut from the growing margins of endophytic fungi using sterile cork borer and transferred to MHA plates seeded with the test bacteria. The plates were incubated at 37°C for 24 h. Each experiment was carried out in triplicate and antibacterial activity was assayed by measurement of zone of inhibition (ZOI) in millimeters.</p>\r\n\r\n<p> </p>\r\n\r\n<p><strong>Statistical analysis</strong><br />\r\nAll the experiments were carried out in triplicate. Data were recorded as the average of three independent readings for each of the experiments. The results were subjected to standard error.</p>"
},
{
"section_number": 3,
"section_title": "RESULTS",
"body": "<p><strong>Isolation and identification of endophytic fungi</strong><br />\r\nIn present study, fungal endophytes from <em>C. longa </em>were isolated followed by the application of different sterilization treatments. A total of 38 endophytic fungi of different genus and species were isolated from the rhizome, roots, stem and leaves of healthy plant among which 16 (CLZ1-CLZ16, where CLZ indicates Curcuma longa Rhizome) were recovered from the rhizome, 5 (CLR1-CLR5, where CLR indicates Curcuma longa Roots) were isolated from roots, 8 (CLS1-CLS8, where CLS indicates Curcuma longa Stem) from the stem, and 9 (CLL1-CLL9, where CLL indicates <em>Curcuma longa</em> Leaf) were isolated from leaves after surface sterilization treatment (<a href=\"#Table-2\">Table 2</a>). Fungal endophytes act as chemical synthesizers within the plant system and have been studied from several unexplored environments till date. The recovery of fungal endophytes largely depends upon the time and concentration of sterilant used. These results support the findings that sequential treatment with 70% ethanol for 3min, 0.5% NaOCl (sodium hypochlorite) for 3 min and 70% ethanol for 30s can be helpful in the recovery of bacterial endophytes from healthy and fresh rhizomes of <em>C. longa</em> [<a href=\"#r-1\">1</a>]. In the present study, lower concentration of sterilizing agents resulted in a higher contamination percentage, whereas higher concentration, on the other hand, led to lower incidence of contamination as well as a lower rate of survival (<a href=\"#figure2\">Figure 2</a>). <em>C. longa</em> explants treated with 70% ethanol for one minute, 2% sodium hypochlorite for 3 min., and 70% ethanol for 30 seconds showed higher percentage of survival. All the isolated endophytic fungi were characterized based on their morphological characteristics and their reproductive structures. The isolates were identifying as <em>Aspergillus</em> sp., <em>Penicillium</em> sp., <em>Fusarium</em> sp., and <em>Cladosporium</em> sp. Reproductive structures were absent in two strains and considered as mycelia sterilia while two were remain unidentified.</p>\r\n\r\n<div id=\"figure2\">\r\n<figure class=\"image\"><img alt=\"\" height=\"209\" src=\"/media/article_images/2023/54/07/178-1642570027-Figure2.jpg\" width=\"500\" />\r\n<figcaption><strong>Figure 2. </strong>Contamination and survival percentage of isolates the surface sterilization treatment.</figcaption>\r\n</figure>\r\n</div>\r\n\r\n<div id=\"Table-1\">\r\n<p><a href=\"https://jabet.bsmiab.org/table/178-1642570027-table2/\">Table-2</a><strong>Table 2. </strong>No. of endophytic fungi isolated per part of plant.</p>\r\n\r\n<p> </p>\r\n</div>\r\n\r\n<p><strong>Efficiency of surface sterilization</strong><br />\r\nFour different methods namely imprinting of sterilized plant tissue, culturing the final aliquots onto the specific media, and dipping the surface sterilized plant tissue into the nutrient broth indicates the efficiency of the surface sterilization method. The absence of spores and hyphae when observed under microscope also suggest that the sterility check was complete. There was no growth observed after 21 days of incubation in sterility check (<a href=\"#figure3\">Figure 3</a>). No turbidity in nutrient broth was observed (<a href=\"#Table-3\">Table 3</a>).</p>\r\n\r\n<div id=\"figure3\">\r\n<figure class=\"image\"><img alt=\"\" height=\"269\" src=\"/media/article_images/2023/54/07/178-1642570027-Figure3.jpg\" width=\"500\" />\r\n<figcaption><strong>Figure 3. </strong>Efficiency of surface sterilization method on potato dextrose agar.</figcaption>\r\n</figure>\r\n</div>\r\n\r\n<div id=\"Table-3\">\r\n<p><a href=\"https://jabet.bsmiab.org/table/178-1642570027-table3/\">Table-3</a><strong>Table 3. </strong>Efficiency of surface sterilization after 21 days treatment period of <em>Curcuma longa </em>L.</p>\r\n\r\n<p> </p>\r\n</div>\r\n\r\n<p><strong>Effect of culture medium on endophytic growth</strong><br />\r\nThe diversity of cultivable endophytic fungi largely depends upon the type of media used to recover fungal endophytes after sterilization treatment [<a href=\"#r-14\">14</a>]. Three different media were used to isolate endophytic fungi from different parts of <em>C. longa</em>. The maximum number of endophytes were recovered from the rhizome, followed by leaf, stem, and with the least number of isolates from the roots (<a href=\"#figure4\">Figure 4, 5</a>).</p>\r\n\r\n<div id=\"figure4\">\r\n<figure class=\"image\"><img alt=\"\" height=\"204\" src=\"/media/article_images/2023/54/07/178-1642570027-Figure4.jpg\" width=\"500\" />\r\n<figcaption><strong>Figure 4.</strong> Recovery percentage of endophytic fungi on different growth media.</figcaption>\r\n</figure>\r\n</div>\r\n\r\n<div id=\"figure5\">\r\n<figure class=\"image\"><img alt=\"\" height=\"138\" src=\"/media/article_images/2023/54/07/178-1642570027-Figure5.jpg\" width=\"500\" />\r\n<figcaption><strong>Figure 5. </strong>Colony morphology of endophytic fungal isolates on different media A) RBA, B) PDA, and C) WA.</figcaption>\r\n</figure>\r\n\r\n<p> </p>\r\n</div>\r\n\r\n<p><strong>Screening of antibacterial activity by agar disc diffusion method</strong><br />\r\nA total of 38 endophytic strains were isolated from different parts of <em>C. longa</em> and subjected for preliminary antimicrobial screening on solid medium. Of the 38 isolates examined, only 11 (28.9%) isolates displayed inhibitory activity against one or more test pathogens while other isolated endophytic fungi showed no antibacterial activity at all (<a href=\"#Table-4\">Table 4</a>). <em>Aspergillus</em> sp. 1, <em>Aspergillus</em> sp. 2, sterlia mycelia 1 and unidentified 2 sp. showed broad spectrum activity by inhibiting all the test pathogens, i.e., <em>E. coli</em>, <em>S. aureus</em>, <em>P. aeruginosa</em> and <em>B. cereus. Cladosporium</em> sp. showed inhibitory activity against <em>E. coli</em>, while <em>Fusarium</em> sp. was able to inhibit only gram-positive bacteria. Other strains were also found to be active. The obtained results are shown in (<a href=\"#figure6\">Figure 6</a>).</p>\r\n\r\n<div id=\"figure6\">\r\n<figure class=\"image\"><img alt=\"\" height=\"475\" src=\"/media/article_images/2023/54/07/178-1642570027-Figure6.jpg\" width=\"500\" />\r\n<figcaption><strong>Figure 6. </strong>Antibacterial activity of isolated fungal endophytes on MHA (Muller Hinton Agar Medium) against (A) <em>E. coli</em>, (B) <em>S. aureus</em>, (C) <em>P. aeruginosa</em> and (D) <em>B. cereus</em>.</figcaption>\r\n</figure>\r\n</div>\r\n\r\n<div id=\"Table-4\">\r\n<p><a href=\"https://jabet.bsmiab.org/table/178-1642570027-table4/\">Table-4</a><strong>Table 4. </strong>Antibacterial activity by endophytic fungi against test pathogens.</p>\r\n</div>"
},
{
"section_number": 4,
"section_title": "DISCUSSION",
"body": "<p><em>Curcuma longa</em> is an Indian traditional medicinal plant with antimicrobial, antioxidant, antidiabetic, antihypertensive, anti-obesity, and anti-inflammatory activities [<a href=\"#lr-24\">24</a>]. Endophytic isolation from such medicinal plants is of great importance as they mimic the host biochemical pathway for the synthesis of bioactive metabolites and provide protection to plants against plant pathogens [<a href=\"#r-23\">23</a>]. In the present work, different sterilization treatments and media were analyzed to obtain the diversity of cultivable endophytic fungi. A total of 38 endophytic fungi were isolated from different parts of <em>C. longa</em> and subjected to their antimicrobial activity by agar disc diffusion method. Five different treatments were assessed for surface sterilization (T1-T5). Surface sterilization with 70% ethanol (T1) does not show any significant results in eliminating the contaminating microorganisms and was sporadically inactive. Our findings supported the study of [<a href=\"#r-12\">12</a>] where 70% ethanol alone was not effective in the isolation of endophytic actinomycetes from medicinal plants. The application of ethanol and sodium hypochlorite in combination are the most used method to remove epiphytic microorganisms. In addition, pre-immersion of seeds from <em>Citrus limon</em> in sterile distilled water for 5 minutes and then surface sterilization with 70% ethanol and 2.5% sodium hypochlorite is preferable for the recovery of bacterial and fungal endophytes [<a href=\"#r-25\">25</a>]. Furthermore, different plant tissues require different treatment as higher concentration of sterilants may damage the host tissue and have impact on endophytic fungal communities also [<a href=\"#r-26\">26</a>]. Hence the efficiency of chemical sterilants were evaluated for removal of epiphytes from rhizome, roots, stem and leaves of <em>C. longa </em>found in the foothills of the Himalayas, the Tarai region in Uttarakhand, which is a typical low-lying territory flooded with water, valley, basin, marshy ground, marsh, swamp, and meadow.<br />\r\nIn our study, surface sterilization of the stem was done using 2% sodium hypochlorite for 2 minutes followed by 70% ethanol for 30 seconds. According to a study on <em>Phaseolus vulgaris</em>, <em>Pisum sativum</em>, and <em>Hordeum vulgare</em>, 70% ethanol, 2% sodium hypochlorite and 0.1% mercuric chloride was found effective in the recovery of bacterial endophytes [<a href=\"#r-27\">27</a>]. However, in our study, 70% ethanol for 1 minute for leaves, 2 % sodium hypochlorite for 3 minutes for leaves, stems, and roots, and 3 minutes for rhizome followed by 70 % ethanol for 30 seconds is effective for isolating endophytic fungi from rhizome with increased survival and decreased contamination rate at the same time. The L-asparaginase producing endophytic fungi has been recovered by sterilizing the plant material with 5% sodium hypochlorite for 3 to 8 min followed by 75% ethanol for 1 min [<a href=\"#r-28\">28</a>]. Subsequently, 0.5% of sodium hypochlorite was found effective in isolation endophytic fungi from <em>Solanum lycopersium</em> [<a href=\"#r-29\">29</a>] but in our study, high concentration of sodium hypochlorite (2%) was found efficacious in eliminating epiphytic mycoflora. Also, the amalgamation of 96% ethanol, with 1% sodium hypochlorite and 3% mercuric chloride was found effective in obtaining the culturable endophytes (bacteria, fungi and actinomycetes) from medicinal plants in Vietnam [<a href=\"#r-30\">30</a>]. Our results indicated that the individual treatments significantly resulted in the higher contamination percentage than the combination of all sterilizing agents. Also, increased ethanol concentration, sodium hypochlorite concentrations and exposure times are not suitable for isolation procedures; it can damage the host by penetrating inside the tissues and hamper the growth of cultivable endophytic fungi.<br />\r\nMedicinal plants and their phytoconstituents have gigantic therapeutic applications against a variety of ailments [<a href=\"#r-31\">31</a>]. Bioactive compounds from medicinal plants are a copious source of antimicrobial agents with no toxicity on cells. Hence, endophytic fungi from such medicinal plants are a pivotal source of novel secondary metabolites. The major compounds for antimicrobial activity from endophytic fungi include fatty acids, fatty acid esters, tertahydrofurans and sterols [<a href=\"#r-32\">32</a>]. Our results revealed that <em>C. longa</em> from Haridwar region could be exploited as a source of endophytic fungi with potential antimicrobial producers.<br />\r\nAlthough all parts of <em>C. longa</em> have been used in traditional formulations to treat a variety of ailments, we isolated endophytic fungi from healthy rhizome, roots, stem and leaves of the plant. In the present work, all the isolated endophytic fungi from <em>C. longa</em> were evaluated for their antimicrobial activity. Whereas, in an earlier study, 11 fungal endophytes recovered from turmeric plants were subjected to antimicrobial activity belonging to the phylum <em>Ascomycota</em> and <em>Fusarium </em>[<a href=\"#r-15\">15</a>]. However, 31 fungal endophytes isolated from healthy turmeric rhizomes and virulent pathogenic strains (<em>P. aphanidermatum</em> PyDOB-4 and <em>R. solani</em> RhsDOB-3) from diseased rhizome and leaf tissue [<a href=\"#r-17\">17</a>]. It is noteworthy that 16 endophytic fungal species were obtained from rhizome and only 5 species isolated from roots. Furthermore, 9 and 8 species were cultured from leaves and stem, respectively. The results also depicted that different plant tissues harbored different endophytic species which may be due to the availability of nutrients.<br />\r\nIn recent years, endophytic fungi have emerged themselves as a powerful source for producing novel compounds with tremendous biological activities. In our research, out of 38 endophytic fungal species, only 11 (28.9%) were found to have broad-spectrum antibacterial activity. The antimicrobial nature of endophytic fungus is due to the presence of some inhibitory compounds and hence further study is required to perform for the production and isolation of bioactive compounds. Similar results were observed in a study where 23 out of 113 endophytic fungal strains displayed antimicrobial activity isolated from the leaf and stem of <em>Zanthoxylum simulans </em>. Studies on antimicrobial activity by endophytic fungi also revealed certain compounds responsible for antimicrobials including, isobenzafuranones, and isocoumarins, alkaloids, phenolics, terpenes, and saponins . Also, the production of antimicrobial compounds largely varies with the incubation temperature and type of the medium used.<br />\r\nFurthermore, our results also indicated that endophytic fungi from <em>C. longa</em> have pharmaceutical potential to produce new antimicrobial compounds and the antimicrobial nature of the plant may be due to the repercussions of production of bioactive metabolites by endophytic fungi.</p>\r\n\r\n<div id=\"figure7\">\r\n<figure class=\"image\"><img alt=\"\" height=\"292\" src=\"/media/article_images/2023/54/07/178-1642570027-Figure7.jpg\" width=\"500\" />\r\n<figcaption><strong>Figure 7. </strong>The isolation pattern for endophytic fungi. Firstly, the whole plant washed with running tap water for 10-15 minutes in order to remove the dirt and debris attached to the surface. After washing, the plant parts were subjected to surface sterilization treatment, 70 % ethanol, 2-2.5 % sodium hypochlorite and 70 % ethanol. After surface sterilization, tissue fragments were placed onto the desired growth medium and incubated at 25±2°C for 7 to 15 days. After incubation, the growing hyphal regions were aseptically transferred to PDA to get pure colonies.</figcaption>\r\n</figure>\r\n\r\n<p> </p>\r\n</div>"
},
{
"section_number": 5,
"section_title": "CONCLUSION",
"body": "<p>In the present study, optimization of surface sterilization treatment enhances the diverse occurrence of endophytic mycoflora from traditional medicinal plant (<a href=\"#figure7\">Figure 7</a>). Furthermore, the observations of this study indicate that endophytic fungi from <em>C. longa</em> are potential source of antimicrobial compounds. Further, antioxidant, antidiabetic, and immunomodulatory activities will need to be included in future research.</p>"
},
{
"section_number": 6,
"section_title": "ACKNOWLEDGEMENT",
"body": "<p>Authors are thankful to the Department of Microbiology, Kanya Gurukula Campus, Gurukula Kangari (Deemed to be University), Haridwar for providing all the essential facilities for conducting the present study.</p>"
},
{
"section_number": 7,
"section_title": "AUTHORS CONTRIBUTIONS",
"body": "<p>HD; designed and performed the experiments; collected reagents, material analysis tools and recorded all data, write manuscripts and improved accordingly. VV; reviewed the data and the manuscript.</p>"
},
{
"section_number": 8,
"section_title": "CONFLICTS OF INTEREST",
"body": "<p>There is no conflict of interest among the authors.</p>"
}
],
"figures": [
{
"figure": "https://jabet.bsmiab.org/media/article_images/2023/54/07/178-1642570027-Figure1.jpg",
"caption": "Figure 1. Collection site of Curcuma longa L. (Turmeric).",
"featured": false
},
{
"figure": "https://jabet.bsmiab.org/media/article_images/2023/54/07/178-1642570027-Figure2.jpg",
"caption": "Figure 2. Contamination and survival percentage of isolates the surface sterilization treatment.",
"featured": false
},
{
"figure": "https://jabet.bsmiab.org/media/article_images/2023/54/07/178-1642570027-Figure3.jpg",
"caption": "Figure 3. Efficiency of surface sterilization method on potato dextrose agar.",
"featured": false
},
{
"figure": "https://jabet.bsmiab.org/media/article_images/2023/54/07/178-1642570027-Figure4.jpg",
"caption": "Figure 4. Recovery percentage of endophytic fungi on different growth media.",
"featured": false
},
{
"figure": "https://jabet.bsmiab.org/media/article_images/2023/54/07/178-1642570027-Figure5.jpg",
"caption": "Figure 5: Colony morphology of endophytic fungal isolates on different media A) RBA, B) PDA, and C) WA.",
"featured": false
},
{
"figure": "https://jabet.bsmiab.org/media/article_images/2023/54/07/178-1642570027-Figure6.jpg",
"caption": "Figure 6. Antibacterial activity of isolated fungal endophytes on MHA (Muller Hinton Agar Medium) against (A) E. coli, (B) S. aureus, (C) P. aeruginosa and (D) B. cereus.",
"featured": false
},
{
"figure": "https://jabet.bsmiab.org/media/article_images/2023/54/07/178-1642570027-Figure7.jpg",
"caption": "Figure 7. The isolation pattern for endophytic fungi. Firstly, the whole plant washed with running tap water for 10-15 minutes in order to remove the dirt and debris attached to the surface. After washing, the plant parts were subjected to surface sterilization treatment, 70 % ethanol, 2-2.5 % sodium hypochlorite and 70 % ethanol. After surface sterilization, tissue fragments were placed onto the desired growth medium and incubated at 25±2°C for 7 to 15 days. After incubation, the growing hyphal regions were aseptically transferred to PDA to get pure colonies.",
"featured": false
}
],
"authors": [
{
"id": 286,
"affiliation": [
{
"affiliation": "Department of Microbiology, Kanya Gurukula Campus, Gurukula Kangari (deemed to be University), Haridwar-249407, India."
}
],
"first_name": "Himani",
"family_name": "Deepak",
"email": null,
"author_order": 1,
"ORCID": null,
"corresponding": false,
"co_first_author": false,
"co_author": false,
"corresponding_author_info": "",
"article": 78
},
{
"id": 287,
"affiliation": [
{
"affiliation": "Department of Microbiology, Kanya Gurukula Campus, Gurukula Kangari (deemed to be University), Haridwar-249407, India."
}
],
"first_name": "Verinder",
"family_name": "Virk",
"email": "virender.wahla@gkv.ac.in",
"author_order": 2,
"ORCID": null,
"corresponding": true,
"co_first_author": false,
"co_author": false,
"corresponding_author_info": "Verinder Virk, PhD ; Department of Microbiology, Kanya Gurukula Campus, Gurukula Kangari (deemed to be University), Haridwar-249407, India, email: virender.wahla@gkv.ac.in",
"article": 78
}
],
"views": 2807,
"downloads": 462,
"references": [
{
"id": 2189,
"serial_number": 1,
"pmc": null,
"reference": "Kumar A, Singh AK, Kaushik MS, Mishra SK, Raj P, Singh PK, Pandey KD. Interaction of turmeric (Curcuma longa L.) with beneficial microbes: a review. 3 Biotech. 2017; 7(6):1-8.",
"DOI": null,
"article": 78
},
{
"id": 2190,
"serial_number": 2,
"pmc": null,
"reference": "Hay, E., Lucariello, A., Contieri, M., Esposito, T., De Luca, A., Guerra, G., & Perna, A. Therapeutic effects of turmeric in several diseases: An overview. Chem Biol Interact. 2019; 310, 108729.",
"DOI": null,
"article": 78
},
{
"id": 2191,
"serial_number": 3,
"pmc": null,
"reference": "Hamidpour R, Hamidpour S, Hamidpour M, Sohraby M, Hamidpour R. Turmeric (Curcuma longa): from a variety of traditional medicinal applications to its novel roles as active antioxidant, anti-inflammatory, anti-cancer, and anti-diabetes. Int J Pharmacol Phytochem Ethnomed. 2015; 1(1): 37-45.",
"DOI": null,
"article": 78
},
{
"id": 2192,
"serial_number": 4,
"pmc": null,
"reference": "Kim H, Ban I, Choi Y, Yu S, Youn SJ, Baik MY, Lee H, Kim W. Puffing of turmeric (Curcuma longa L.) enhances its anti-inflammatory effects by upregulating macrophage oxidative phosphorylation. Antioxidants. 2020; 9(10):931.",
"DOI": null,
"article": 78
},
{
"id": 2193,
"serial_number": 5,
"pmc": null,
"reference": "Yadav RP, Tarun G. Versatility of turmeric: A review the golden spice of life. J. Pharmacogn. Phytochem. 2017; 6(1):41-6.",
"DOI": null,
"article": 78
},
{
"id": 2194,
"serial_number": 6,
"pmc": null,
"reference": "Azeez TB, Lunghar J. Antiinflammatory effects of turmeric (Curcuma longa) and ginger (Zingiber officinale). Inflammation and Natural Products. 2021; 1:127-146.",
"DOI": null,
"article": 78
},
{
"id": 2195,
"serial_number": 7,
"pmc": null,
"reference": "Passari AK, Mishra VK, Saikia R, Gupta VK, Singh BP. Isolation, abundance and phylogenetic affiliation of endophytic actinomycetes associated with medicinal plants and screening for their in vitro antimicrobial biosynthetic potential. Front. Microbiol. 2015; 7, 6:273.",
"DOI": null,
"article": 78
},
{
"id": 2196,
"serial_number": 8,
"pmc": null,
"reference": "Matsumoto A, Takahashi Y. Endophytic actinomycetes: promising source of novel bioactive compounds. J. Antibiot. 2017; 70(5):514-519.",
"DOI": null,
"article": 78
},
{
"id": 2197,
"serial_number": 9,
"pmc": null,
"reference": "Poveda J, Abril-Urias P, Escobar C. Biological control of plant-parasitic nematodes by filamentous fungi inducers of resistance: Trichoderma, mycorrhizal and endophytic fungi. Front. Microbiol. 2020; 25;11:992.",
"DOI": null,
"article": 78
},
{
"id": 2198,
"serial_number": 10,
"pmc": null,
"reference": "Anjum N, Chandra R. Endophytic bacteria: optimizaton of isolation procedure from various medicinal plants and their preliminary characterization. Asian J. Pharm. Clin. Res. 2015; 8(4):233-8.",
"DOI": null,
"article": 78
},
{
"id": 2199,
"serial_number": 11,
"pmc": null,
"reference": "Waheeda K, Shyam KV. Formulation of novel surface sterilization method and culture media for the isolation of endophytic actinomycetes from medicinal plants and its antibacterial activity. J. Plant. Pathol. Microbiol. 2017; 1:8(399):2.",
"DOI": null,
"article": 78
},
{
"id": 2200,
"serial_number": 12,
"pmc": null,
"reference": "Sahu PK, Tilgam J, Mishra S, Hamid S, Gupta A, Verma SK, & Kharwar RN. Surface sterilization for isolation of endophytes: Ensuring what (not) to grow. Journal of Basic Microbiology. 2022.",
"DOI": null,
"article": 78
},
{
"id": 2201,
"serial_number": 13,
"pmc": null,
"reference": "Ramalashmi K, Prasanna VK, Magesh K, Sanjana R, Siril JS, Ravibalan K. A potential surface sterilization technique and culture media for the isolation of endophytic bacteria from Acalypha indica and its antibacterial activity. J Med Plant Stud. 2018; 6:181-4.",
"DOI": null,
"article": 78
},
{
"id": 2202,
"serial_number": 14,
"pmc": null,
"reference": "Septiana E, Sukarno N, Simanjuntak P. Endophytic fungi associated with turmeric (Curcuma longa L.) can inhibit histamine-forming bacteria in fish. Hayati. J. Biosci. 2017; 1:24(1):46-52.",
"DOI": null,
"article": 78
},
{
"id": 2203,
"serial_number": 15,
"pmc": null,
"reference": "Strobel G, Daisy B. Bioprospecting for microbial endophytes and their natural products. Microbiol. Mol. Biol. Rev. 2003; 67(4):491-502.",
"DOI": null,
"article": 78
},
{
"id": 2204,
"serial_number": 16,
"pmc": null,
"reference": "Vinayarani G, Prakash HS. Fungal endophytes of turmeric (Curcuma longa L.) and their biocontrol potential against pathogens Pythium aphanidermatum and Rhizoctonia solani. World J. Microbiol. Biotechnol. 2018; 34(3):1-7.",
"DOI": null,
"article": 78
},
{
"id": 2205,
"serial_number": 17,
"pmc": null,
"reference": "Petrini O. Taxonomy of endophytic fungi of aerial plant tissues. Microbiology of the Phyllosphere. 1986.",
"DOI": null,
"article": 78
},
{
"id": 2206,
"serial_number": 18,
"pmc": null,
"reference": "Schulz B, Wanke U, Draeger S, Aust HJ. Endophytes from herbaceous plants and shrubs: effectiveness of surface sterilization methods. Mycol. Res. 1993; 1:97(12):1447-50.",
"DOI": null,
"article": 78
},
{
"id": 2207,
"serial_number": 19,
"pmc": null,
"reference": "Barnett HL, Hunter BB. Illustrated genera of imperfect fungi. Illustrated genera of imperfect fungi.. 1972(3rd ed).",
"DOI": null,
"article": 78
},
{
"id": 2208,
"serial_number": 20,
"pmc": null,
"reference": "Ellis MB. Demataceous Hyphomycetes; Commonwealth Mycological Institute: Kew, UK, 1976.",
"DOI": null,
"article": 78
},
{
"id": 2209,
"serial_number": 21,
"pmc": null,
"reference": "Forbes BA, Sahm DF, Weissfeld AS. 2016. Study Guide for Bailey and Scott’s Diagnostic Microbiology-E-Book. Elsevier Health Science.",
"DOI": null,
"article": 78
},
{
"id": 2210,
"serial_number": 22,
"pmc": null,
"reference": "Faddetta T, Abbate L, Alibrandi P, Arancio W, Siino D, Strati F, De Filippo C, Fatta Del Bosco S, Carimi F, Puglia AM, Cardinale M. The endophytic microbiota of Citrus limon is transmitted from seed to shoot highlighting differences of bacterial and fungal community structures. Sci Rep. 2021; 29;11(1):1-2.",
"DOI": null,
"article": 78
},
{
"id": 2211,
"serial_number": 23,
"pmc": null,
"reference": "Hatamzadeh S, Rahnama K, Nasrollahnejad S, Fotouhifar KB, Hemmati K, White JF, Taliei F. Isolation and identification of L-asparaginase-producing endophytic fungi from the Asteraceae family plant species of Iran. PeerJ. 2020; 14;8:e8309.",
"DOI": null,
"article": 78
},
{
"id": 2212,
"serial_number": 24,
"pmc": null,
"reference": "Mohammad Golam Dastogeer K, Oshita Y, Yasuda M, Kanasugi M, Matsuura E, Xu Q, Okazaki S. Host specificity of endophytic fungi from stem tissue of nature farming tomato (Solanum lycopersicum Mill.) in Japan. Agronomy. 2020; 10(7):1019.",
"DOI": null,
"article": 78
},
{
"id": 2213,
"serial_number": 25,
"pmc": null,
"reference": "ran HM, Nguyen DT, Mai NT, Do HT, Nguyen TK, Nguyen TK, Muller M, Nguyen HQ. Notes on Culturable Endophytic Microorganisms Isolated from 14 Medicinal Plants in Vietnam: A Diversity Analysis to Predict the Host-Microbe Correlations. Curr Microbiol. 2022; 79(5):1-0.",
"DOI": null,
"article": 78
},
{
"id": 2214,
"serial_number": 26,
"pmc": null,
"reference": "Archana H, Bose VG. Evaluation of phytoconstituents from selected medicinal plants and its synergistic antimicrobial activity. Chemosphere. 2022; 1;287:132276.",
"DOI": null,
"article": 78
},
{
"id": 2215,
"serial_number": 27,
"pmc": null,
"reference": "Sharaf MH, Abdelaziz AM, Kalaba MH, Radwan AA, Hashem AH. Antimicrobial, antioxidant, cytotoxic activities and phytochemical analysis of fungal endophytes isolated from ocimum basilicum. Appl Biochem Biotechnol. 2022; 194(3):1271-89.",
"DOI": null,
"article": 78
},
{
"id": 2216,
"serial_number": 28,
"pmc": null,
"reference": "An C, Ma S, Shi X, Xue W, Liu C, Ding H. Isolation, diversity, and antimicrobial activity of fungal endophytes from Rohdea chinensis (Baker) N. Tanaka (synonym Tupistra chinensis Baker) of Qinling Mountains, China. PeerJ. 2020; 17;8:e9342.",
"DOI": null,
"article": 78
},
{
"id": 2217,
"serial_number": 29,
"pmc": null,
"reference": "Kuo J, Chang CF, Chi WC. Isolation of endophytic fungi with antimicrobial activity from medicinal plant Zanthoxylum simulans Hance. Folia Microbiologica. 2021; 66(3):385-97.",
"DOI": null,
"article": 78
},
{
"id": 2218,
"serial_number": 30,
"pmc": null,
"reference": "Chen Q, Yu JJ, He J, Feng T, Liu JK. Isobenzofuranones and isocoumarins from kiwi endophytic fungus Paraphaeosphaeria sporulosa and their antibacterial activity against Pseudomonas syringae pv. actinidiae. Phytochemistry. 2022; 1;195:113050.",
"DOI": null,
"article": 78
},
{
"id": 2219,
"serial_number": 31,
"pmc": null,
"reference": "Du W, Yao Z, Li J, Sun C, Xia J, Wang B, Shi D, Ren L. Diversity and antimicrobial activity of endophytic fungi isolated from Securinega suffruticosa in the Yellow River Delta. PloS one. 2020; 10;15(3):e0229589.",
"DOI": null,
"article": 78
},
{
"id": 2220,
"serial_number": 32,
"pmc": null,
"reference": "Castro P, Parada R, Corrial C, Mendoza L, Cotoras M. Endophytic Fungi Isolated from Baccharis linearis and Echinopsis chiloensis with Antifungal Activity against Botrytis cinerea. J Fungi. 2022; 18;8(2):197.",
"DOI": null,
"article": 78
}
]
},
{
"id": 64,
"slug": "178-1646885559-human-immunodeficiency-virus-type-1-role-of-proteins-in-the-context-of-viral-life-cycle",
"featured": false,
"slider": false,
"issue": "Vol5 Issue2",
"type": "review_article",
"manuscript_id": "178-1646885559",
"recieved": "2022-02-26",
"revised": null,
"accepted": "2022-03-27",
"published": "2022-04-07",
"pdf_file": "https://jabet.bsmiab.org/media/pdf_file/2023/19/178-1646885559.pdf",
"title": "Human immunodeficiency virus type 1: Role of proteins in the context of viral life cycle",
"abstract": "<p>The Acquired Immunodeficiency Syndrome (AIDS) is a major global pandemic and of paramount public health concern. Over the years, antiretroviral therapy (ART) has emerged as the gold standard of AIDS treatment. However, drug resistance and toxicity, and drug accessibility and compliance issues have blunted its positive impacts. Thirty years into the AIDS pandemic, there is a critical need of the hour to identify and develop an effective treatment strategy that can be successfully implemented with high levels of coverage. The HIV-1 life cycle bestows numerous potential targets for therapeutic intervention, however, only a few have been exploited till date. HIV- 1 encodes fifteen viral proteins from just nine genes. The expression of structural polyproteins Gag, Pol, and Env enable the assembly of the virion, the regulatory proteins Rev and Tat regulate viral gene expression and the accessory proteins Vpu, Nef, Vpr, and Vif equip the virion to evade or counteract host immune defenses. In this review article, we highlight each structural, regulatory, and accessory protein’s role in the context of the HIV-1 life cycle. We also discuss anti-retroviral therapy, its advantages, and shortcomings. Finally, we provide insight into various unexploited and potential therapeutic targets in the life cycle of HIV</p>",
"journal_reference": "J Adv Biotechnol Exp Ther. 2022; 5(2): 307-319.",
"academic_editor": "Md Jamal Uddin, PhD; Ewha Womans University, Seoul, South Korea",
"cite_info": "Jha V, Rustagi K , et al. Human immunodeficiency virus type 1: Role of proteins in the\r\ncontext of viral life cycle. J Adv Biotechnol Exp Ther. 2022; 5(2): 307-319.",
"keywords": [
"Acquired Immunodeficiency Syndrome",
"Anti-retroviral therapy",
"Viral Life cycle",
"Viral proteins",
"Human immunodeficiency virus"
],
"DOI": "10.5455/jabet.2022.d117",
"sections": [
{
"section_number": 1,
"section_title": "INTRODUCTION",
"body": "<p>The current AIDS pandemic is a complex combination of diverse sub-epidemics within and between different countries of the world and can undoubtedly be termed a public-health crisis. The first known case of AIDs was reported in 1981. Since then, the Joint United Nations Program on HIV/AIDS (UNAIDS) has estimated that AIDS has been the cause of demise for more than 32 million people worldwide and an estimated 37.9 million people were living with AIDS by the end of 2018. The Human Immunodeficiency Virus (HIV) is the etiological agent of AIDS. Two types of HIV virus have been isolated and characterized from infected patients: HIV-1 and HIV-2. HIV-1 was discovered first. It is the most found strain of the virus and is more prevalent worldwide. Whereas HIV-2 is mainly restricted to Western Africa [<a href=\"#r-1\">1</a>]. The aim of this review article is to emphasize the role of each structural, regulatory, and accessory protein with respect to the HIV-1 life cycle leading to HIV infection. Further, we have discussed about the highly preferred treatment therapy for AIDS that is anti-retroviral therapy and its benefits as well as drawbacks. In addition to this, an attempt has been made to explore the possible therapeutic targets which can be exploited for drug and vaccine development.</p>"
},
{
"section_number": 2,
"section_title": "THE HUMAN IMMUNODEFICIENCY VIRUS",
"body": "<p><strong>Virion structure</strong><br />\r\nHIV-1 is a spherical retrovirus and has a diameter of ~ 100–120 nm. The virion has an outer envelope, which is a lipid bilayer and embedded in it are glycoproteins gp120 and gp41. At the centre of the virion lies a cone-shaped core, which is composed of the viral capsid protein (p24). Enclosed within the core is the genetic material comprising of two positive-sense single-stranded linear RNA molecules ((+) ssRNA) of length ~ 10kilobase (kb). Tightly bound to the RNA is nucleocapsid protein (p7). Besides (+) ssRNA, the core also encapsulates two molecules of the enzyme reverse transcriptase (p64), a protease (p10), and an integrase (p32). Between the inner viral capsid core and outer envelope lies a layer of the matrix protein (p17) [<a href=\"#r-2\">2</a>].</p>\r\n\r\n<p> </p>\r\n\r\n<p><strong>Tropism</strong><br />\r\nHIV-1, like other viruses, is an obligate intracellular parasite. Humans are the natural hosts of HIV-1. The virus can infect disparate cells of the immune system such as CD4+ T cells, dendritic cells, and macrophages. However, it predominantly infects and kills CD4+T cells. This leads to a depletion in the CD4+ T cell population, resulting in profound immunodeficiency, thus incapacitating the immune system, and impairing the patient’s ability to fight opportunistic infections. The main mechanism for CD4+ T cell depletion is apoptosis i.e., programmed cell death which can be induced by multiple pathways. This decrease in the number of CD4+ cells in a patient’s body indicates the development of HIV-1 infection [<a href=\"#r-3\">3</a>].</p>\r\n\r\n<p> </p>\r\n\r\n<p><strong>Genome organization</strong><br />\r\nThe HIV-1 genome has three fundamental defining open-reading frames (ORFs) (<a href=\"#figure1\">Figure 1</a>). The Gag gene is one of these three prime ORFs. It encodes the polyprotein Gag (group-specific antigen). Gag is named p55, based on its molecular weight of 55 kD. It is initially synthesized as a precursor protein, that during or shortly after virus budding, is cleaved by the viral protease (PR) into mainly three cleavage products – matrix protein (p17), capsid protein (p24), and nucleocapsid protein (p7) [<a href=\"#r-4\">4</a>].<br />\r\nThe second ORF in HIV-1, pol, encodes Gag-Pol (p160) polyprotein containing the precursor to the enzymes protease (PR), reverse transcriptase (RT), and integrase (IN). The third ORF, env, encodes the viral protein Env, a glycoprotein of 160 kD (aptly named gp160). After translation, gp160 is cleaved into the surface (SU) glycoprotein gp120 and the transmembrane (TM) glycoprotein gp41. Together they interact with the target receptor (CD4) and co-receptor (CXCR4 or CCR5) on host cells [<a href=\"#r-1\">1</a>].<br />\r\nIn addition to the retroviral ORFs gag, pol, and env, HIV-1 has six supplementary ORFs that encode two regulatory and four axillary proteins. The HIV-1 regulatory proteins Rev (regulator of virion expression) and Tat (trans activator of transcription) gene are expressed early in the virus’s life cycle. The replication of HIV-1 virion in host cells is intimately linked and completely reliant upon numerous cellular host factors. Conversely, host cells also harbour intrinsic resistance factors (also called restriction factors) that suppress viral replication [<a href=\"http://#r-5\">5</a>]. The array of axillary proteins encoded by HIV distinguishes it from other retroviruses. They’re called axillary because they don’t have any enzymatic or structural capabilities but aid the virion in evading and manipulating the host’s innate and adaptive immune responses. Vpu, Vif, Nef, and Vpr are the four axillary proteins encoded by HIV-1 [<a href=\"#r-6\">6</a>]. The host-HIV-1 interactome can help fully understand how HIV-1 gains control of the host and how the cell attempts to counteract infection by elucidating these critical interactions between the virion and the host protein.</p>\r\n\r\n<div id=\"figure1\">\r\n<figure class=\"image\"><img alt=\"\" height=\"157\" src=\"/media/article_images/2023/35/07/178-1646885559-Figure1.jpg\" width=\"500\" />\r\n<figcaption><strong>Figure 1. </strong>Organization of the HIV-1 genome.</figcaption>\r\n</figure>\r\n</div>"
},
{
"section_number": 3,
"section_title": "PROTEINS INVOLVED IN HIV-1 LIFE CYCLE",
"body": "<p>The HIV-1 life cycle can be arbitrarily divided into two distinct phases: the early stage, which refers to the steps where the virion binds and enters into the target cell, conversion of viral RNA to cDNA (reverse transcription) occurs, delivery of cDNA to the site of integration and integration of the viral cDNA into the cell genome takes place, and the late phase, which includes the expression of the HIV gene products and the assembly, release, and maturation of progeny virion [<a href=\"http://#r-7\">7</a>] (<a href=\"#figure2\">Figure 2</a>).</p>\r\n\r\n<div id=\"figure2\">\r\n<figure class=\"image\"><img alt=\"\" height=\"417\" src=\"/media/article_images/2023/35/07/178-1646885559-Figure2.jpg\" width=\"500\" />\r\n<figcaption><strong>Figure 2. </strong>Schematic overview of the HIV-1 life cycle (The viral proteins involved in each step are highlighted in red).</figcaption>\r\n</figure>\r\n\r\n<p> </p>\r\n</div>\r\n\r\n<p><strong>Proteins involved in binding and entry of the virus into the target cells</strong><br />\r\nThe envelope forms the outermost layer of the virion and is a lipid bilayer ∼4 nm thick, typically containing ∼300,000 lipids. It is derived from the host’s cell membrane. Identification and characterization of the array of proteins in enveloped viruses like HIV-1 crucial as these proteins often direct infection. These proteins are the only antigenic determinants on intact virion that are visible to the immune system and hence, are considered as primary targets for vaccine development [<a href=\"#r-8\">8-9</a>].<br />\r\nInterspersed and embedded in the HIV-1 viral envelope are virally encoded glycoproteins – the surface glycoprotein gp120 and the transmembrane glycoprotein gp41. The two are non-covalently linked to each other and form a single subunit of a trimeric “spike” on the surface of the virion. Projecting from the surface of each virion are 72 such glycoprotein spikes, each composed of gp120 and gp41 [<a href=\"#r-10\">10</a>]. When HIV-1 infects target cells, it employs its surface glycoproteins to adhere and fuse to the host cell membrane. HIV-1 entry is a multiphasic process that is initiated when gp120 selectively binds to the primary receptor CD4. This binding triggers a conformational change in gp120 and augments its affinity for a secondary receptor, or “co-receptor” either C-X-C chemokine receptor type 4 (CXCR4) or C-C chemokine receptor type 5 (CCR5) [<a href=\"#\">11</a>]. It was found that individuals possessing naturally occurring 32-base pair deletion in the CCR5 gene are highly resistant to infection by primary HIV-1 isolates which further confirmed the above-mentioned phenomenon. These individuals are seemingly healthy, suggesting the absence of a functional CCR5 will not have unexpected side-effects and is not associated with any significant immunological dysfunction [<a href=\"#r-12\">12</a>]. Thus, the seven-transmembrane G protein-coupled chemokine co-receptor CCR5 and CXCR4 are seen as a potential therapeutic target. Maraviroc belongs to a class of anti-retroviral drugs called CCR5 antagonists that exhibits potent anti-human immunodeficiency virus type 1 (HIV-1) activity as well as favorable pharmacological properties. Maraviroc selectively binds to CCR5 subsequently blocking the interaction of the surface (SU) glycoprotein gp120 with it. Thus, preventing the membrane fusion event which are required for viral entry. According to the previous studies, it was seen that Maraviroc does not affect CCR5 cell surface levels or associated intracellular signaling, indicating that it a functional antagonist of CCR5 [<a href=\"#r-13\">13</a>][<a href=\"#r-14\">14,15</a>]. Following gp120’s attachment to the coreceptor, subsequent conformational changes in both gp120 and gp41 cause a fusion of viral and cellular membranes, delivering the viral core into the target cell’s cytoplasm and allowing reverse transcription to begin [16]. Enfuvirtide is a synthetic peptide that blocks HIV-1 entry into host cells by interfering with virus-cell fusion by competitively binding to gp41 and blocking the formation of the post-fusion structure. It is the first and currently the only fusion inhibitor approved by the US Food and Drug Administration (FDA) which is used in combination with other antiretroviral agents [<a href=\"#r-17\">17</a>]. Despite the importance of the primary receptor CD4 during viral entry, it is well known that HIV-1 suppresses the homologous CD4 receptor’s cell surface expression. CD4 downregulation is thought to give the virus a selective replicative advantage in vivo. Increased CD4 expression on the cell surface has been shown to interfere with viral particle release and infectivity in studies. The presence of CD4 during the virus life cycle causes issues such as superinfection, early CD4 binding to nascent virus particles, and virus release inhibition. Thus, the removal of cell-surface CD4 is required for optimal virus production by HIV-1 [<a href=\"#r-18\">18</a>]. Negative factor (Nef) is 27–35 kD myristoylated protein. Myristoylation is the covalent attachment of myristic acid to the N terminus glycine residue. Nef is highly expressed in the early stages of the viral replication cycle. Nef mediates CD4 down-regulation by inducing endocytosis of CD4 followed by its degradation through the endo-lysosomal pathway [<a href=\"#r-19\">19</a>].</p>\r\n\r\n<p> </p>\r\n\r\n<p><strong>Proteins involved in </strong><strong>uncoating and reverse transcription</strong><br />\r\nAfter the fusion of the viral membrane and that of the target cell, the capsid protein disassembles, and the viral RNA enters the cytoplasm. This is followed by reverse transcription, i.e., synthesis of linear double-stranded cDNA from an RNA template and is catalyzed by the 64kD enzyme reverse transcriptase. It is an asymmetric heterodimer consisting of two subunits – the larger p66 subunit and the smaller p51 subunit. Reverse transcription is a hallmark of the retroviral replication cycle [<a href=\"#lr-20\">20</a>]. Virus populations have extensive genetic heterogeneity due to the mutation-prone nature of viral replication and are referred to as quasi-species. The human immunodeficiency virus is one of the most polymorphic viruses known and is an important and prominent example of a viral quasi-species. Patients infected with HIV-1 harbor a highly diverse virus population with many different mutants. Spontaneous Mutations are generated since reverse transcriptase (RT) lacks proofreading mechanisms and thus has low fidelity. It is this high-level genetic diversity that allows HIV-1 to escape the immune system, and rapidly evolve drug resistance, making it difficult to come up with effective vaccination strategies and drug therapy [<a href=\"#r-21\">21</a>]. The viral protein R (Vpr) is a small (14 kD) accessory protein, that is well conserved in HIV-1. Vpr is multifunctional and plays various roles at multiple stages of the HIV-1 viral life cycle. It modulates the in vivo mutation rate of HIV-1 by influencing the accuracy of the reverse transcription, thus playing a key role in the regulation of HIV-1[<a href=\"#r-22\">22</a>].</p>\r\n\r\n<p> </p>\r\n\r\n<p><strong>Proteins involved in the viral </strong><strong>integration</strong><br />\r\nThe cDNA interacts with viral and cellular proteins and is translocated into the nucleus as a nucleoprotein pre-integration complex (PIC). The PIC is a large complex consisting of cDNA, integrase, reverse transcriptase, MA protein, CA protein, and Vpr protein. Due to its large size, it cannot passively diffuse across the nuclear envelope. Vpr expression is said to induce transient bulges in the nuclear envelope, which sometimes burst, creating a channel between the nucleus and the cytoplasm, thus facilitating the nuclear import of the pre-integration complex into the nucleus[<a href=\"#r-22\">22</a>]. The cDNA is irreversibly integrated into host chromatin by the 32 kD enzyme integrase. Integration can essentially occur at any location in the genome, however certain regions of chromatin are preferred. This integrated viral DNA is known as proviral DNA. Blocking integration is of unique importance, as once integrated, identification and destruction of the hidden provirus is nearly impossible. Raltegravir is the first approved integrase inhibitor used for treatment of AIDs and has rapid, potent and sustained effects. Integration occurs in two steps, namely 3′ end processing, and DNA strand transfer. Raltegravir interferes with the strand transfer reaction, and this prevents the incorporation of linear HIV-1 cDNA into the host cell’s genome and disrupts the viral life cycle of HIV-1 [<a href=\"#r-23\">23-24</a>].</p>\r\n\r\n<p> </p>\r\n\r\n<p><strong>Proteins involved in gene expression</strong><br />\r\nThe proviral DNA, like a cellular gene, is transcribed by the host RNA polymerase II (RNAPII). Both ends of the proviral DNA are flanked by a repeat sequence known as the long terminal repeat (LTR). LTR is the control centre for gene expression, as it contains multiple upstream DNA regulatory elements that serve as binding sites and interact with a myriad of cellular transcription initiation factors. The 5′ LTR region codes for the promotor for transcription of the viral genes [<a href=\"#r-25\">25</a>]. Tat (transactivator of transcription) is a 14-kD nuclear transcription factor encoded by the tat gene in HIV-1. Tat is an RNA binding protein that enhances transcription by recognizing and binding to a cis-acting RNA sequence called TAR element (transactivator response element), present within the extended terminal repeat region at the 5′ end of the nascent viral mRNA transcript [<a href=\"#r-26\">26-27</a>].<br />\r\nNascent Viral RNAs undergo processing in the nucleus, just like cellular mRNAs, that include the addition of a 5′ methylguanine ‘cap’ and a 3′ polyA tail. HIV-1 primary transcripts fall into 3 classes according to their degree of splicing: (i) 9.2 kb unspliced transcripts, that encodes for the Gag and Pol polyproteins or can be packaged into virions to serve as genomic RNA; (ii) 4 kb singly spliced transcripts coding for the viral proteins Env, Vpu, Vif and Vpr; (iii) 2 kb multiply spliced transcripts that express Tat, Rev and Nef [<a href=\"#lr-28\">28</a>]. Unlike cellular mRNAs that are usually spliced to completion before being exported to the cytoplasm, a significant fraction of retroviral transcripts remains unspliced but are still exported to the cytoplasm. Rev is a small (16kD) trans-acting regulatory protein that shuttles between the nucleus and the cytoplasm. It binds to the Rev response element (RRE), that is present on unspliced and singly spliced viral RNAs transcripts and exports these RNAs from the nucleus to the cytoplasm [<a href=\"#r-29\">29-30</a>]. The HIV-1 mRNA encodes three structural polyproteins Gag, Pol, and Env. Two of these polyprotein precursors Gag and Pol, as mentioned before, are derived from the same 9.2 kb unspliced transcript. The gag gene encodes matrix proteins (MA), capsid protein (CA), and nucleocapsid protein (NC) in the 5′ to 3′ direction of the reading frame (NC). Protein p6, spacer peptide 1 (SP1) between CA and NC, and spacer peptide 2 (SP2) between NC and p6 are likewise found in HIV-1 Gag. HIV-1 protein synthesis is also entirely dependent on the translation machinery of the host cell and takes place on cellular ribosomes. About the gag coding region, the pol coding region of the mRNA now partially overlaps and is in the 1 reading frame. As a result, when ribosomes translating gag reach the start of the pol coding area, they must slip back one nucleotide to exit the gag reading frame. A Gag-Pol fusion protein is produced due to a single ribosomal frameshift. In general, Gag is produced by 95% of translating ribosomes, while a Gag-Pol fusion protein is produced by 5%. The precursor proteins are not generated with similar stoichiometry, despite the fact that they are derived from the same mRNA [<a href=\"#r-31\">31</a>].</p>\r\n\r\n<p> </p>\r\n\r\n<p><strong>Proteins involved in the assembly and budding of </strong><strong>nascent virions from the infected cells</strong><br />\r\nOne significant way of understanding the molecular mechanisms underlying the assembly of HIV-1 virion is by studying assembly in a defined system in vitro. The expression of Gag has been found to be is central to HIV-1 assembly, as in the absence of other viral components, it alone can spontaneously assemble into spherical immature virus-like particles (VLPs) in vitro, which cannot be morphologically distinguished via an electron microscope from authentic immature (non-infectious) virus [<a href=\"#r-32\">32</a>].<br />\r\nUnderstanding the mechanism of virus assembly and release has been hampered by the resolution limitations of traditional microscopy. The immature virus-like particles are roughly spherical, with a diameter of 100–150 nm, and contain 5000 rod-shaped Gag molecules tightly packed side-by-side in a radial fashion within the immature particles, with the N-terminal MA domain associated with the membrane and the C-terminal portion of Gag oriented toward the particle’s centre, according to high-resolution cryogenic electron microscopy analyses [<a href=\"#\">33]</a>. Gag can multimerize and produce virus-like particles on its own, but to make infectious virions, it must interact with various viral and host components during the assembly process [<a href=\"#r-33\">33</a>]. Gag is a multi-domain viral protein, as previously stated. Each domain of Gag is involved in the assembly and release process, and it is made up of three independently folded conserved structural domains. HIV-1 Gag takes part in Gag-membrane, Gag-Gag, and Gag-RNA interactions. The Gag-membrane contact is mediated by Gag’s N-terminal MA domain, which directs Gag to the host cell’s plasma membrane, where it binds Gag to the lipid bilayer’s inner leaflet, which is the primary site of Gag multimerization and particle formation. The CA domain of the Gag polyprotein is required for Gag-Gag interactions. Also, CA domain along with the NC domain, homo oligomerizes to facilitate Gag multimerization and particle assembly. The Gag-RNA interaction is promoted by a particular interaction between Gag’s NC domain and viral genome sequences. The NC domain binds to viral genomic RNA, causing two copies of the viral genomic RNA to be packaged into each virus particle. The viral RNA genome transmits all genetic information to new host cells, including the instructions needed to produce new virions, and is thus critical for virion infectivity [<a href=\"#r-34\">34-35</a>].<br />\r\nIn recent years, significant progress has been made in understanding the structure and cell biology of Gag, revealing a plethora of prospective Gag-related therapeutic targets. Targeting gag gene products successfully blocks HIV-1 replication, providing a promising method for new classes of medicines to supplement existing HIV-1 therapy options [<a href=\"#r-36\">36</a>]. Gag and Gag-Pol are targeted and trafficked to the assembly site, which in most cases is the plasma membrane, by the 17 kD matrix (MA) domain. It also plays an essential role in the incorporation of the viral Env glycoproteins spikes during virus assembly. The N-terminal attachment of a myristic acid moiety is required for the MA domain’s membrane-targeting activity. We know this because a mutation in the N-terminal Gly residue, which is the site of myristic acid attachment, prevents Gag from binding to the membrane and prevents virus assembly. Gag molecules must first recognize a location in the plasma membrane where they can oligomerize into higher order multimers in order to start particle assembly [<a href=\"#r-37\">37</a>]. Gag is found in specific PM microdomains called lipid rafts, which are dense and ordered groups of tightly packed saturated lipids stabilized by cholesterol, according to studies. Lipid rafts have a distinct molecular makeup than the surrounding membrane [<a href=\"#lr-38\">38</a>]. In the past, it was thought that HIV-1 assembly and effective particle release took place at the plasma membrane of all host cells. Several results and recently proposed models, however, suggest that HIV-1 assembly in primary macrophages is triggered by internal sequestration of Gag in late endosomal membranes. Later secretory pathways based on endosomes carry the formed virion to the plasma membrane. This is believed to control virion release in terms of time and space [<a href=\"#r-36\">36-37</a>].<br />\r\nProtease (PR) is a dimeric virus-encoded proteolytic enzyme belonging to the family of aspartic proteases. During or shortly after budding PR performs a series of 12 sequential, highly specific, perfectly timed cleavage reactions on the Gag polyprotein precursor, producing the mature matrix protein p17 (MA), capsid protein p24 (CA), nucleocapsid protein p7 (NC), and protein p6 [<a href=\"#r-39\">39</a>]. While the MA protein remains associated with the inner face of the virion membrane, the CA protein condenses and forms a characteristic fullerene shaped cone around the viral RNA. This rearrangement is known as virion maturation, and it produces a morphological transition from an immature to an infectious virion [<a href=\"#lr-40\">40</a>]. Due to its sensitive and essential function, HIV-1 protease has been widely exploited as a drug target and it exhibits a broad substrate recognition. The HIV-1 capsid is a conical protein shell made up of a hexameric lattice of the CA protein that repeats itself. In both the early and late stages of the viral replication cycle, the capsid is crucial. The capsid core is released into the cytoplasm shortly after the viral and host cell membranes fuse, where it disassembles via a process known as uncoating. Capsid stability is required for efficient reverse transcription and infectivity, according to site-directed mutagenesis investigations of HIV-1 variants. Capsid assembly and maturation are necessary to produce infectious virus particles throughout the late stages of the HIV-1 life cycle. The HIV-1 CA protein is composed of two individually folded domains: a 150 amino acid N-terminal domain (CANTD) and an 80 amino acid C-terminal domain, according to structural analyses (CACTD). A flexible linker connects the CANTD to the CACTD. The CACTD is orientated towards the interior of the HIV-1 capsid core, whereas the CANTD is positioned on the outside surface [<a href=\"#r-41\">41</a>][<a href=\"#r-42\">42</a>]. The capsid protein, which is a structural component of HIV-1, is responsible for the shape of the immature Gag and the mature viral core, which has a conical form. The discovery of multiple capsid inhibitors in recent years has emphasized the viral capsid’s importance as a promising target for therapeutic development. CAP-1 and CAP-2 were the first small compounds to be identified as HIV-1 capsid inhibitors. CAP-1 has been proven to inhibit HIV-1 replication by up to 95% while CAP-2 is lethal to cells [<a href=\"#r-43\">43</a>]. CA is one of the most conserved proteins among HIV-1 subtypes, and mutations are not well tolerated. CA is a very appealing target for inhibitor development because of these properties [<a href=\"#r-44\">44</a>].<br />\r\nThe HIV-1 nucleocapsid (NC) proteins are small, basic, highly conserved, and multifunctional nucleic acid binding proteins. The nucleocapsid protein, is a highly conserved zinc finger protein. It plays a central role in virus replication, mainly by interacting with nucleic acids. About 2000 NC molecules bind to the viral RNA through electrostatic interactions between their basic residues and the phosphodiester backbone of RNA. Thus, NC coats the viral RNA and protects it from degradation by RNAases. NC also promotes the initiation and the strand transfer reactions, during reverse transcription. This is because NC acts as a nucleic acid chaperone and enables the rearrangement of the nucleic acid structure into most thermodynamically stable conformations by catalyzing the breakage and reformation of base pairs[45][46]. Novel therapeutic compounds for the treatment of AIDs must contend with the obstacle of drug resistance. Because they are mutationally intolerant and essential for both acute infection and virion assembly, the HIV-1 nucleocapsid protein is a particularly desirable antiviral target. The fact that point mutations of the NC protein result in non-infectious viruses is another convincing reason to explore NC as a promising therapeutic target [<a href=\"#r-47\">47</a>].<br />\r\nThe targeting of discrete steps in the HIV-1 replication cycle, such as Gag trafficking to the site of virus assembly, Gag binding to cellular membranes, Gag monomer interactions leading to multimerisation, and budding and release of nascent virions from the infected cell, provides a better strategy for new classes of drugs to complement existing HIV-1 treatment options [<a href=\"#r-48\">48</a>]. Virion infectivity factor (Vif) is a phosphorylated protein with a size of 23 kD. The host apolipoprotein B mRNA-editing enzyme-catalytic polypeptide-like 3G (APOBEC3G; A3G) is encapsulated by budding virion in Virion lacking a functioning Vif gene. APOBEC3G is a DNA-editing enzyme that catalyses the conversion of cytosine (dC) to uracil (dU) in single-stranded DNA during reverse transcription, limiting HIV-1 replication and conferring intrinsic immunity to the host. HIV-1 averts the potent antiviral effects of the intrinsic resistance factor APOBEC3G by encoding Vif at relatively high levels late in the viral replication cycle. Vif forms a complex with APOBEC3G, thus preventing its packaging into assembling virions. This interaction between Vif and APOBEC3G is an attractive therapeutic target [<a href=\"#r-41\">41-42</a>].<br />\r\nViral protein U (Vpu) is the smallest (16 kD) of all HIV-1 proteins, having 81 amino acids and consisting of a single transmembrane domain. It is an accessory protein that is expressed by HIV-1 but not by HIV-2. NMR spectroscopy shows that it consists of two major domains: a short N-terminal hydrophobic transmembrane anchor domain (TMD), and a longer cytoplasmic domain (CD) [<a href=\"#r-43\">43</a>]. One of the chief functions of Vpu is to aid in the release of progeny virus from infected target cells. The host restriction factor, bone marrow stromal cell antigen 2 (BST-2) is an interferon-induced transmembrane protein that tethers enveloped viruses such as HIV-1 to the cell surface, thus inhibiting their release [49]. Vpu relieves this restriction imposed by BST-2 by removing it from sites of virion assembly and budding at the plasma membrane and thus facilitates the virion release from infected cells. Since there isn’t any Vpu targeting drug currently available that has cleared clinical trials further than phase two, Vpu is a potential therapeutic target [<a href=\"#r-43\">43</a>].</p>"
},
{
"section_number": 4,
"section_title": "UPDATES ON THE TREATMENT OF HIV",
"body": "<p>AIDS was once thought of as “a very big threat” as it was feared to result in a “medical apocalypse” and was hence termed as a “curse upon the human race”. Ever since the HIV-1 virus was first discovered, tremendous progress has been made. Today anti-retroviral therapy has emerged as the cornerstone of HIV-1 treatment. It consists of using a cocktail or a combination of anti-retroviral drugs each of which targets and inhibits a step of the HIV-1 life cycle. ART maximally suppresses viral replication and reduces the plasma HIV-1 viral load (VL) i.e., the number of HIV-1 RNA copies per milliliter of blood, to levels that most clinical assays cannot detect (<50 RNA copies/mL) [<a href=\"#r-50\">50</a>].<br />\r\nART is however not curative and cannot eradicate HIV-1 infection completely, as viral reservoirs remain in the form of silent HIV-1 DNA integrated in the host genome of long-lived resting memory CD4 +T cells and are thus recognized by the immune system or eradicated by drugs. ART can, however, stop the progression of AIDS in patients. The availability and rapid scale-up of anti-retroviral therapy have transformed AIDs from an inevitably fatal disease to a chronic and controllable condition. Even though a significant decline in the death of patients due to AIDS is seen since the use of ART, global efforts have not corroborated to be ample, and the global prevalence of HIV has expanded since its discovery as the virus continues to spread with an alarming and increasing speed [<a href=\"#r-51\">51</a>].<br />\r\nDrug resistance is a significant barrier that often restricts the efficacy of antiretroviral drugs that are already accessible. When drug levels aren’t high enough to stop viral reproduction, drug resistance develops. For the treatment of AIDS, there are now 25 FDA-approved anti-retroviral medications available, which can be divided into five categories. A mutation that provides resistance to one medicine now frequently confers resistance to other drugs in the same class. As a result, the establishment of drug resistance limits the number of drugs that can be used [<a href=\"#r-47\">47</a>].<br />\r\nHIV-1 reverse transcriptase (RT), which converts single-stranded viral RNA into corresponding double-stranded proviral DNA, was the focus of early efforts to stop HIV-1 replication. Because RT is required for retrovirus replication but not found in HIV-1-susceptible host cells, it seemed an ideal target for selective therapeutic action. Anti-RT medications are divided into two categories: nucleoside RT inhibitors (NRTIs) and non-nucleoside RT inhibitors (NNRTIs) [<a href=\"#r-52\">52</a>]. In addition to FDA-approved protease inhibitors (PIs) such as tipranavir, the sole FDA-approved fusion inhibitor for the treatment of AIDS is enfuvirtide. Among the FDA-approved integrase inhibitors are Raltegravir (RAL), Elvitegravir (EVG), and Dolutegravir (DTG). A medication regimen known as Highly Active Anti-Retroviral Therapy (HAART) containing a combination of NRTIs, NNRTIs, PIs, and entry inhibitors is used to treat HIV. In HIV patients, HAART has considerably reduced morbidity and mortality rates. Currently, increased emphasis is placed on including two, three, or even more medications that target the HIV life cycle [<a href=\"#r-53\">53</a>].<br />\r\nA primary goal of current National Institute of Allergy and Infectious Diseases (NIAID) -funded HIV therapy research is to produce long-acting treatments that, unlike current antiretrovirals, may be given less often. Long-acting medicines, broadly neutralizing antibodies, and therapeutic vaccinations are the three categories of agents being investigated. The efficacy of two investigational long-acting HIV drugs, rilpivirine LA and cabotegravir LA, among people who have had trouble adhering to standard antiretroviral therapy was evaluated by NIAID. Another study included a combination of monthly cabotegravir LA injections and monthly infusions of VRC01LS, a broadly neutralizing antibody discovered by the NIAID, can keep HIV suppressed in people who have previously been treated with antiretroviral therapy [<a href=\"#lr-54\">54</a>]. HIV infections can be treated in three ways by broadly neutralizing antibodies: By attaching directly to the virus, it is prevented from entering a cell and its eradication is accelerated. Through attaching to an HIV-infected cell, immune-system components that assist cell death are recruited. Lastly, by means of creating a compound with a crucial piece of HIV, it may stimulate immune cells in a similar way to a vaccine, so preparing the immune system for future encounters with the virus. A therapeutic vaccination, unlike one designed to prevent HIV infection, would be administered to persons who are already infected with the virus. Such a vaccine would train the immune system to be ready for any future outbreak of HIV, obviating the need for additional treatment and maybe avoiding the requirement for booster shots. Such a strategy could lead to long-term viral remission, or treatment or vaccination that results in HIV levels that are undetectable for lengthy periods of time without the need for antiretroviral therapy [<a href=\"#r-55\">55</a>].</p>"
},
{
"section_number": 5,
"section_title": "CONCLUSION",
"body": "<p>This review article accentuates the life cycle of HIV-1 and the key role played by various viral proteins at different stages. One prime attribute of the virus, responsible for its evolutionary success is its ‘deceptive simplicity’, i.e., even though HIV-1 has a small genome, consisting of just 9 genes that encode for only 15 mature proteins, the virus is difficult to target. ART is unfolding to abate the drug burden but also exhibits detrimental side effects. Moreover, ART solely cannot cure or exterminate HIV. Subsequently, insightful expansion to novel therapies and trailblazing paradigms should be exploited. It is requisite to recognize other factors that are imperative for viral replication in the host cell. Meticulous probing of complexities cognate to HIV infection, role of immune cells and molecular alterations during the infection will assist in treatment. This would also aid in impeding the phenomenon of resistance developed by HIV. It is also crucial to determine the viral target cell and investigate the target cell dependent variations in viral replication cycle.<br />\r\nDespite advancement, many people living with HIV remain undiagnosed due to lack of awareness and prevention. Vanquishing this obstacle by diagnosing and treating the infection at a primary stage would assist in mitigating the proliferation of the virus. Therefore, exigency of collaborative scientific and social measures cannot be left unnoticed. Congruous variations in treatment regimens can aid patients subjugate the prospective impediments that come along with the disease. Factors like pervasiveness of psychiatric disorders, socioeconomic status, meagre health literacy and social stigma are also reckoned as radical hurdles in treatment of this infection. Mental health plays a very crucial role in combating any illness, consequently, expedient counselling regarding treatment obedience and psychological consolation should be promulgated in patients and the society.</p>"
},
{
"section_number": 6,
"section_title": "ACKNOWLEDGEMENT",
"body": "<p>None.</p>"
},
{
"section_number": 7,
"section_title": "AUTHOR CONTRIBUTIONS",
"body": "<p>VJ and KR conceptualized this manuscript. SD, RP, MR, and NS aligned the literature, VJ, KG, KR and VD wrote the manuscript. NK, and SD prepared the figures. NS, MR, and KG did proof reading and corrections. All authors contributed to the revision and approved the final manuscript.</p>"
},
{
"section_number": 8,
"section_title": "CONFLICTS OF INTEREST",
"body": "<p>There is no conflict of interest among the authors.</p>"
}
],
"figures": [
{
"figure": "https://jabet.bsmiab.org/media/article_images/2023/35/07/178-1646885559-Figure1.jpg",
"caption": "Figure 1. Organization of the HIV-1 genome.",
"featured": false
},
{
"figure": "https://jabet.bsmiab.org/media/article_images/2023/35/07/178-1646885559-Figure2.jpg",
"caption": "Figure 2. Schematic overview of the HIV-1 life cycle (The viral proteins involved in each step are highlighted in red).",
"featured": false
}
],
"authors": [
{
"id": 218,
"affiliation": [
{
"affiliation": "National Facility for Biopharmaceutical, Guru Nanak Khalsa College, Nathelal Parekh Margh, Mumbai, Maharashtra 400019, India"
}
],
"first_name": "Vikas",
"family_name": "Jha",
"email": "vikasjjha7@gmail.com",
"author_order": 1,
"ORCID": null,
"corresponding": true,
"co_first_author": false,
"co_author": false,
"corresponding_author_info": "Vikas Jha, National Facility for Biopharmaceuticals, Guru Nanak\r\nKhalsa college, Nathelal Parekh Margh, Mumbai, Maharashtra 400019, India,\r\ne-mail: vikasjjha7@gmail.com",
"article": 64
},
{
"id": 219,
"affiliation": [
{
"affiliation": "Department of Biotechnology, University of Glasgow, Glasgow G12 8QQ, United Kingdom"
}
],
"first_name": "Kush",
"family_name": "Rustagi",
"email": null,
"author_order": 2,
"ORCID": null,
"corresponding": false,
"co_first_author": false,
"co_author": false,
"corresponding_author_info": "",
"article": 64
},
{
"id": 220,
"affiliation": [
{
"affiliation": "Department of Biochemistry and Molecular biology, Faculty of Biology and Chemistry, University of Bremen, Bibliothekstraße 1, 28359 Bremen, Germany"
}
],
"first_name": "Kunal",
"family_name": "Gharat",
"email": null,
"author_order": 3,
"ORCID": null,
"corresponding": false,
"co_first_author": false,
"co_author": false,
"corresponding_author_info": "",
"article": 64
},
{
"id": 221,
"affiliation": [
{
"affiliation": "School of Biology and Environmental Science, University College Dublin, Belfield, Dublin 4, Ireland"
}
],
"first_name": "Neetu",
"family_name": "Sonawane",
"email": null,
"author_order": 4,
"ORCID": null,
"corresponding": false,
"co_first_author": false,
"co_author": false,
"corresponding_author_info": "",
"article": 64
},
{
"id": 222,
"affiliation": [
{
"affiliation": "School of Biology and Environmental Science, University College Dublin, Belfield, Dublin 4, Ireland"
}
],
"first_name": "Meet",
"family_name": "Rathod",
"email": null,
"author_order": 5,
"ORCID": null,
"corresponding": false,
"co_first_author": false,
"co_author": false,
"corresponding_author_info": "",
"article": 64
},
{
"id": 223,
"affiliation": [
{
"affiliation": "Department of Biotechnology, Kishinchand Chellaram College Mumbai, Maharashtra 400020, India"
}
],
"first_name": "Reetikesh",
"family_name": "Patel",
"email": null,
"author_order": 6,
"ORCID": null,
"corresponding": false,
"co_first_author": false,
"co_author": false,
"corresponding_author_info": "",
"article": 64
},
{
"id": 224,
"affiliation": [
{
"affiliation": "Department of Biotechnology, Kishinchand Chellaram College Mumbai, Maharashtra 400020, India"
}
],
"first_name": "Sakshi",
"family_name": "Devkar",
"email": null,
"author_order": 7,
"ORCID": null,
"corresponding": false,
"co_first_author": false,
"co_author": false,
"corresponding_author_info": "",
"article": 64
},
{
"id": 225,
"affiliation": [
{
"affiliation": "National Facility for Biopharmaceutical, Guru Nanak Khalsa College, Nathelal Parekh Margh, Mumbai, Maharashtra 400019, India"
}
],
"first_name": "Vrushali",
"family_name": "Damapurkar",
"email": null,
"author_order": 8,
"ORCID": null,
"corresponding": false,
"co_first_author": false,
"co_author": false,
"corresponding_author_info": "",
"article": 64
},
{
"id": 226,
"affiliation": [
{
"affiliation": "National Facility for Biopharmaceutical, Guru Nanak Khalsa College, Nathelal Parekh Margh, Mumbai, Maharashtra 400019, India"
}
],
"first_name": "Navdeep",
"family_name": "Kaur",
"email": null,
"author_order": 9,
"ORCID": null,
"corresponding": false,
"co_first_author": false,
"co_author": false,
"corresponding_author_info": "",
"article": 64
}
],
"views": 1341,
"downloads": 131,
"references": [
{
"id": 1782,
"serial_number": 1,
"pmc": null,
"reference": "Seitz R. Human Immunodeficiency Virus (HIV). Transfus Med Hemotherapy 2016;43:203–22. https://doi.org/10.1159/000445852.",
"DOI": null,
"article": 64
},
{
"id": 1783,
"serial_number": 2,
"pmc": null,
"reference": "McLaren PJ, Fellay J. HIV-1 and human genetic variation. Nat Rev Genet 2021;22:645–57. https://doi.org/10.1038/s41576-021-00378-0.",
"DOI": null,
"article": 64
},
{
"id": 1784,
"serial_number": 3,
"pmc": null,
"reference": "Vijayan KV, Karthigeyan KP, Tripathi SP, Hanna LE. Pathophysiology of CD4+ T-Cell depletion in HIV-1 and HIV-2 infections. Front Immunol 2017;8:1–8. https://doi.org/10.3389/fimmu.2017.00580.",
"DOI": null,
"article": 64
},
{
"id": 1785,
"serial_number": 4,
"pmc": null,
"reference": "Klingler J, Anton H, Réal E, Zeiger M, Moog C, Mély Y, et al. How HIV-1 gag manipulates its host cell proteins: A focus on interactors of the nucleocapsid domain. Viruses 2020;12. https://doi.org/10.3390/v12080888.",
"DOI": null,
"article": 64
},
{
"id": 1786,
"serial_number": 5,
"pmc": null,
"reference": "Colomer-Lluch M, Ruiz A, Moris A, Prado JG. Restriction Factors: From Intrinsic Viral Restriction to Shaping Cellular Immunity Against HIV-1. Front Immunol 2018;9:1–18. https://doi.org/10.3389/fimmu.2018.02876.",
"DOI": null,
"article": 64
},
{
"id": 1787,
"serial_number": 6,
"pmc": null,
"reference": "Hernandez L. Accessory Regulatory Proteins of HIV-1 and Host Restriction Factors Interactions. Biomed J Sci Tech Res 2020;31:24308–12. https://doi.org/10.26717/bjstr.2020.31.005120.",
"DOI": null,
"article": 64
},
{
"id": 1788,
"serial_number": 7,
"pmc": null,
"reference": "Mailler E, Bernacchi S, Marquet R, Paillart JC, Vivet-Boudou V, Smyth RP. The life-cycle of the HIV-1 gag–RNA complex. Viruses 2016;8:1–19. https://doi.org/10.3390/v8090248.",
"DOI": null,
"article": 64
},
{
"id": 1789,
"serial_number": 8,
"pmc": null,
"reference": "Xiao T, Cai Y, Chen B. Hiv-1 entry and membrane fusion inhibitors. Viruses 2021;13:1–19. https://doi.org/10.3390/v13050735.",
"DOI": null,
"article": 64
},
{
"id": 1790,
"serial_number": 9,
"pmc": null,
"reference": "Burnie J, Guzzo C. The incorporation of host proteins into the external HIV-1 envelope. Viruses 2019;11:1–25. https://doi.org/10.3390/v11010085.",
"DOI": null,
"article": 64
},
{
"id": 1791,
"serial_number": 10,
"pmc": null,
"reference": "Kumar R, Ozorowski G, Kumar V, Holden LG, Shrivastava T, Patil S, et al. Characterization of a stable HIV-1 B/C recombinant, soluble, and trimeric envelope glycoprotein (Env) highly resistant to CD4-induced conformational changes. J Biol Chem 2017;292:15849–58. https://doi.org/10.1074/jbc.M117.803056.",
"DOI": null,
"article": 64
},
{
"id": 1792,
"serial_number": 11,
"pmc": null,
"reference": "Shaik MM, Peng H, Lu J, Rits-Volloch S, Xu C, Liao M, et al. Structural basis of coreceptor recognition by HIV-1 envelope spike. Nature 2019;565:318–23. https://doi.org/10.1038/s41586-018-0804-9.",
"DOI": null,
"article": 64
},
{
"id": 1793,
"serial_number": 12,
"pmc": null,
"reference": "Hütter G, Neumann M, Nowak D, Klein S, Klüter H, Hofmann WK. The effect of the CCR5-delta32 deletion on global gene expression considering immune response and inflammation. J Inflamm 2011;8:1–8. https://doi.org/10.1186/1476-9255-8-29.",
"DOI": null,
"article": 64
},
{
"id": 1794,
"serial_number": 13,
"pmc": null,
"reference": "Wilen CB, Tilton JC, Doms RW. HIV: Cell binding and entry. Cold Spring Harb Perspect Med 2012;2. https://doi.org/10.1101/cshperspect.a006866.",
"DOI": null,
"article": 64
},
{
"id": 1795,
"serial_number": 14,
"pmc": null,
"reference": "Sayana S, Khanlou H. Maraviroc: a new CCR5 antagonist. Http://DxDoiOrg/101586/14787210719 2014;7:9–19. https://doi.org/10.1586/14787210.7.1.9.",
"DOI": null,
"article": 64
},
{
"id": 1796,
"serial_number": 15,
"pmc": null,
"reference": "Lin H-Y, Ho Y, Liu H-L. Structure-Based Pharmacophore Modeling to Discover Novel CCR5 Inhibitors for HIV-1/Cancers Therapy. J Biomed Sci Eng 2019;12:10–30. https://doi.org/10.4236/jbise.2019.121002.",
"DOI": null,
"article": 64
},
{
"id": 1797,
"serial_number": 16,
"pmc": null,
"reference": "El-Zohairy MA, Zlotos DP, Berger MR, Adwan HH, Mandour YM. Discovery of Novel CCR5 Ligands as Anticolorectal Cancer Agents by Sequential Virtual Screening. ACS Omega 2021;6:10921–35. https://doi.org/10.1021/acsomega.1c00681.",
"DOI": null,
"article": 64
},
{
"id": 1798,
"serial_number": 17,
"pmc": null,
"reference": "Lai YT. Small molecule hiv-1 attachment inhibitors: Discovery, mode of action and structural basis of inhibition. Viruses 2021;13:1–12. https://doi.org/10.3390/v13050843.",
"DOI": null,
"article": 64
},
{
"id": 1799,
"serial_number": 18,
"pmc": null,
"reference": "Liu Q, Zhang P, Lusso P. Quaternary interaction of the hiv-1 envelope trimer with cd4 and neutralizing antibodies. Viruses 2021;13. https://doi.org/10.3390/v13071405.",
"DOI": null,
"article": 64
},
{
"id": 1800,
"serial_number": 19,
"pmc": null,
"reference": "Kwon Y, Kaake RM, Echeverria I, Suarez M, Karimian Shamsabadi M, Stoneham C, et al. Structural basis of CD4 downregulation by HIV-1 Nef. Nat Struct Mol Biol 2020;27:822–8. https://doi.org/10.1038/s41594-020-0463-z.",
"DOI": null,
"article": 64
},
{
"id": 1801,
"serial_number": 20,
"pmc": null,
"reference": "Ha B, Larsen KP, Zhang J, Fu Z, Montabana E, Jackson LN, et al. High-resolution view of HIV-1 reverse transcriptase initiation complexes and inhibition by NNRTI drugs. Nat Commun 2021;12:1–11. https://doi.org/10.1038/s41467-021-22628-9.",
"DOI": null,
"article": 64
},
{
"id": 1802,
"serial_number": 21,
"pmc": null,
"reference": "Cuevas JM, Geller R, Garijo R, López-Aldeguer J, Sanjuán R. Extremely High Mutation Rate of HIV-1 In Vivo. PLoS Biol 2015;13:1–19. https://doi.org/10.1371/journal.pbio.1002251.",
"DOI": null,
"article": 64
},
{
"id": 1803,
"serial_number": 22,
"pmc": null,
"reference": "Byeon IJL, Calero G, Wu Y, Byeon CH, Jung J, DeLucia M, et al. Structure of HIV-1 Vpr in complex with the human nucleotide excision repair protein hHR23A. Nat Commun 2021;12. https://doi.org/10.1038/s41467-021-27009-w.",
"DOI": null,
"article": 64
},
{
"id": 1804,
"serial_number": 23,
"pmc": null,
"reference": "Anker M, Corales RB. Raltegravir (MK-0518): A novel integrase inhibitor for the treatment of HIV infection. Expert Opin Investig Drugs 2008;17:97–103. https://doi.org/10.1517/13543784.17.1.97.",
"DOI": null,
"article": 64
},
{
"id": 1805,
"serial_number": 24,
"pmc": null,
"reference": "Normale E, Cachan S De. R Altegravir : M Olecular B Asis of I Ts M Echanism of a Ction 2009;14:5–16.",
"DOI": null,
"article": 64
},
{
"id": 1806,
"serial_number": 25,
"pmc": null,
"reference": "Ne E, Palstra RJ, Mahmoudi T. Transcription: Insights From the HIV-1 Promoter. Int Rev Cell Mol Biol 2018;335:191–243. https://doi.org/10.1016/bs.ircmb.2017.07.011.",
"DOI": null,
"article": 64
},
{
"id": 1807,
"serial_number": 26,
"pmc": null,
"reference": "Ensoli B, Moretti S, Borsetti A, Maggiorella MT, Buttò S, Picconi O, et al. New insights into pathogenesis point to HIV-1 Tat as a key vaccine target. Arch Virol 2021;166:2955–74. https://doi.org/10.1007/s00705-021-05158-z.",
"DOI": null,
"article": 64
},
{
"id": 1808,
"serial_number": 27,
"pmc": null,
"reference": "Kamori D, Ueno T. HIV-1 tat and viral latency: What we can learn from naturally occurring sequence variations. Front Microbiol 2017;8:1–7. https://doi.org/10.3389/fmicb.2017.00080.",
"DOI": null,
"article": 64
},
{
"id": 1809,
"serial_number": 28,
"pmc": null,
"reference": "Leblanc J, Weil J, Beemon K. Posttranscriptional regulation of retroviral gene expression: Primary RNA transcripts play three roles as pre-mRNA, mRNA, and genomic RNA. Wiley Interdiscip Rev RNA 2013;4:567–80. https://doi.org/10.1002/wrna.1179.",
"DOI": null,
"article": 64
},
{
"id": 1810,
"serial_number": 29,
"pmc": null,
"reference": "Blissenbach M, Grewe B, Hoffmann B, Brandt S, Überla K. Nuclear RNA Export and Packaging Functions of HIV-1 Rev Revisited. J Virol 2010;84:6598–604. https://doi.org/10.1128/jvi.02264-09.",
"DOI": null,
"article": 64
},
{
"id": 1811,
"serial_number": 30,
"pmc": null,
"reference": "Pai S, Mudgal J, Kamath BV, Pai KSR. An insight on promising strategies hoping to cure HIV-1 infection by targeting Rev protein—short review. Pharmacol Reports 2021;73:1265–72. https://doi.org/10.1007/s43440-021-00257-9.",
"DOI": null,
"article": 64
},
{
"id": 1812,
"serial_number": 31,
"pmc": null,
"reference": "Hung M, Patel P, Davis S, Green SR. Importance of Ribosomal Frameshifting for Human Immunodeficiency Virus Type 1 Particle Assembly and Replication. J Virol 1998;72:4819–24. https://doi.org/10.1128/jvi.72.6.4819-4824.1998.",
"DOI": null,
"article": 64
},
{
"id": 1813,
"serial_number": 32,
"pmc": null,
"reference": "Scarlata S, Carter C. Role of HIV-1 Gag domains in viral assembly. Biochim Biophys Acta – Biomembr 2003;1614:62–72. https://doi.org/10.1016/S0005-2736(03)00163-9.",
"DOI": null,
"article": 64
},
{
"id": 1814,
"serial_number": 33,
"pmc": null,
"reference": "de Marco A, Müller B, Glass B, Riches JD, Kräusslich HG, Briggs JAG. Structural analysis of HIV-1 maturation using cryo- electron tomography. PLoS Pathog 2010;6. https://doi.org/10.1371/journal.ppat.1001215.",
"DOI": null,
"article": 64
},
{
"id": 1815,
"serial_number": 34,
"pmc": null,
"reference": "Dilley KA, Nikolaitchik OA, Galli A, Burdick RC, Levine L, Li K, et al. Interactions between HIV-1 Gag and Viral RNA Genome Enhance Virion Assembly. J Virol 2017;91. https://doi.org/10.1128/jvi.02319-16.",
"DOI": null,
"article": 64
},
{
"id": 1816,
"serial_number": 35,
"pmc": null,
"reference": "Sundquist WI, Kra H. HIV-1 Assembly, Budding, and Maturation 2012:1–24.",
"DOI": null,
"article": 64
},
{
"id": 1817,
"serial_number": 36,
"pmc": null,
"reference": "Welsch S, Keppler OT, Habermann A, Allespach I, Krijnse-Locker J, Kräusslich HG. HIV-1 buds predominantly at the plasma membrane of primary human macrophages. PLoS Pathog 2007;3. https://doi.org/10.1371/journal.ppat.0030036.",
"DOI": null,
"article": 64
},
{
"id": 1818,
"serial_number": 37,
"pmc": null,
"reference": "Pelchen-Matthews A, Kramer B, Marsh M. Infectious HIV-1 assembles in late endosomes in primary macrophages. J Cell Biol 2003;162:443–55. https://doi.org/10.1083/jcb.200304008.",
"DOI": null,
"article": 64
},
{
"id": 1819,
"serial_number": 38,
"pmc": null,
"reference": "Yamasaki. 基因的改变NIH Public Access. Bone 2014;23:1–7. https://doi.org/10.1016/j.virusres.2009.04.007.Lipids.",
"DOI": null,
"article": 64
},
{
"id": 1820,
"serial_number": 39,
"pmc": null,
"reference": "Yang H, Nkeze J, Zhao RY. Effects of HIV-1 protease on cellular functions and their potential applications in antiretroviral therapy. Cell Biosci 2012;2:1–8. https://doi.org/10.1186/2045-3701-2-32.",
"DOI": null,
"article": 64
},
{
"id": 1821,
"serial_number": 40,
"pmc": null,
"reference": "Sakuragi JI. Morphogenesis of the infectious HIV-1 virion. Front Microbiol 2011;2:1–5. https://doi.org/10.3389/fmicb.2011.00242.",
"DOI": null,
"article": 64
},
{
"id": 1822,
"serial_number": 41,
"pmc": null,
"reference": "Goila-Gaur R, Strebel K. HIV-1 Vif, APOBEC, and intrinsic immunity. Retrovirology 2008;5:1–16. https://doi.org/10.1186/1742-4690-5-51.",
"DOI": null,
"article": 64
},
{
"id": 1823,
"serial_number": 42,
"pmc": null,
"reference": "Britan-Rosich E, Nowarski R, Kotler M. Multifaceted counter-APOBEC3G mechanisms employed by HIV-1 Vif. J Mol Biol 2011;410:1065–76. https://doi.org/10.1016/J.JMB.2011.03.058.",
"DOI": null,
"article": 64
},
{
"id": 1824,
"serial_number": 43,
"pmc": null,
"reference": "Ruiz A, Guatelli JC, Stephens EB. The Vpu protein: new concepts in virus release and CD4 down-modulation. Curr HIV Res 2010;8:240–52. https://doi.org/10.2174/157016210791111124.",
"DOI": null,
"article": 64
},
{
"id": 1825,
"serial_number": 44,
"pmc": null,
"reference": "Carnes SK, Sheehan JH, Aiken C. Inhibitors of the HIV-1 capsid, a target of opportunity. Curr Opin HIV AIDS 2018;13:359–65. https://doi.org/10.1097/COH.0000000000000472.",
"DOI": null,
"article": 64
},
{
"id": 1826,
"serial_number": 45,
"pmc": null,
"reference": "Krishnamoorthy G, Roques B, Darlix JL, Mély Y. DNA condensation by the nucleocapsid protein of HIV-1: A mechnism ensuring DNA protection. Nucleic Acids Res 2003;31:5425–32. https://doi.org/10.1093/nar/gkg738.",
"DOI": null,
"article": 64
},
{
"id": 1827,
"serial_number": 46,
"pmc": null,
"reference": "Levin JG, Mitra M, Mascarenhas A, Musier-Forsyth K. Role of HIV-1 nucleocapsid protein in HIV-1 reverse transcription. RNA Biol 2010;7:754–74. https://doi.org/10.4161/rna.7.6.14115.",
"DOI": null,
"article": 64
},
{
"id": 1828,
"serial_number": 47,
"pmc": null,
"reference": "Arts EJ, Hazuda DJ. HIV-1 antiretroviral drug therapy. Cold Spring Harb Perspect Med 2012;2. https://doi.org/10.1101/cshperspect.a007161.",
"DOI": null,
"article": 64
},
{
"id": 1829,
"serial_number": 48,
"pmc": null,
"reference": "Waheed AA, Freed EO. HIV type 1 Gag as a target for antiviral therapy. AIDS Res Hum Retroviruses 2012;28:54–75. https://doi.org/10.1089/aid.2011.0230.",
"DOI": null,
"article": 64
},
{
"id": 1830,
"serial_number": 49,
"pmc": null,
"reference": "Evans DT, Serra-Moreno R, Singh RK, Guatelli JC. BST-2/tetherin: a new component of the innate immune response to enveloped viruses. Trends Microbiol 2010;18:388–96. https://doi.org/10.1016/J.TIM.2010.06.010.",
"DOI": null,
"article": 64
},
{
"id": 1831,
"serial_number": 50,
"pmc": null,
"reference": "Deeks SG, Archin N, Cannon P, Collins S, Jones RB, de Jong MAWP, et al. Research priorities for an HIV cure: International AIDS Society Global Scientific Strategy 2021. Nat Med 2021;27:2085–98. https://doi.org/10.1038/s41591-021-01590-5.",
"DOI": null,
"article": 64
},
{
"id": 1832,
"serial_number": 51,
"pmc": null,
"reference": "Henrich TJ, Hatano H, Bacon O, Hogan LE, Rutishauser R, Hill A, et al. HIV-1 persistence following extre277277mely early initiation of antiretroviral therapy (ART) during acute HIV-1 infection: An observational study. PLoS Med 2017;14:1–22. https://doi.org/10.1371/journal.pmed.1002417.",
"DOI": null,
"article": 64
},
{
"id": 1833,
"serial_number": 52,
"pmc": null,
"reference": "De Clercq E, Li G. Approved antiviral drugs over the past 50 years. Clin Microbiol Rev 2016;29:695–747. https://doi.org/10.1128/CMR.00102-15.",
"DOI": null,
"article": 64
},
{
"id": 1834,
"serial_number": 53,
"pmc": null,
"reference": "Singh, AnuradhaSingh, VishalSingh RK. Recent Advances in Treatment of HIV/AIDS Infection and its Social Implication. Res Gate 2020.",
"DOI": null,
"article": 64
},
{
"id": 1835,
"serial_number": 54,
"pmc": null,
"reference": "Antiretroviral Drug Discovery and Development | NIH: National Institute of Allergy and Infectious Diseases n.d. https://www.niaid.nih.gov/diseases-conditions/antiretroviral-drug-development (accessed March 25, 2022).",
"DOI": null,
"article": 64
},
{
"id": 1836,
"serial_number": 55,
"pmc": null,
"reference": "Future Directions for HIV Treatment Research | NIH: National Institute of Allergy and Infectious Diseases n.d. https://www.niaid.nih.gov/diseases-conditions/future-hiv-treatment (accessed March 25, 2022).",
"DOI": null,
"article": 64
}
]
},
{
"id": 59,
"slug": "178-1641574027-hptlc-fingerprinting-analysis-of-phytoconstituents-from-bixa-orellana-and-beta-vulgaris-plant-pigment",
"featured": false,
"slider": false,
"issue": "Vol5 Issue2",
"type": "original_article",
"manuscript_id": "178-1641574027",
"recieved": "2022-01-08",
"revised": null,
"accepted": "2022-03-10",
"published": "2022-04-05",
"pdf_file": "https://jabet.bsmiab.org/media/pdf_file/2023/36/178-1641574027.pdf",
"title": "HPTLC fingerprinting analysis of phytoconstituents from Bixa orellana and Beta vulgaris plant pigment",
"abstract": "<p>Pigments are a type of coloring component which are utilized by humans to enhance colors in their lives. Using synthetic pigments for the purpose of coloring food, clothes, fruit juices, paints are accepted worldwide previously, but due to hazardous impact of synthetic colors on environment, and on human health made to go for alternative sources of the pigments which are safe to use. Isolation of natural pigment is another preference that will increase the supply of pigment from natural sources while minimizing environmental and health risks. Thus, there is a growing necessity for biocolor derived from natural sources that can substitute synthetic colors. Natural colorants are commonly found from plants, animals, and microorganisms. Plant pigments have several benefits, so it seems much of prominence for pigment production. <em>Bixa orellana</em> and <em>Beta vulgaris</em> were isolated for yellow, orange, and red color pigments from natural ecological source. Pigment extraction from plants requires extract preparation and then isolation of pigments using different solvents. Extracted pigments were analyzed by preliminary screening techniques such as phytochemical assay and various confirmation tests. We found positive results for flavonoid, tannin, carbohydrate, protein, saponin and alkaloid using phytochemical assays. HPTLC fingerprinting was done for each extract and found positive result for alkaloid and phenolic compounds. Thus, it was aimed to develop the extraction analytical methods for determination of <em>Bixa Orellana</em> and <em>Beta Vulgaris</em> spp. by HPTLC fingerprint approach.</p>",
"journal_reference": "J Adv Biotechnol Exp Ther. 2022; 5(2): 292-306.",
"academic_editor": "Md. Masudur Rahman, PhD; Sylhet Agricultural University, Bangladesh",
"cite_info": "Patel M, Patel P. HPTLC fingerprinting analysis of phytoconstituents from Bixa orellana and Beta vulgaris plant pigment. J Adv Biotechnol Exp Ther. 2022; 5(2): 292-306.",
"keywords": [
"HPTLC Fingerprinting analysis",
"Plant metabolites",
"Natural extract",
"Bixa orellana",
"Beta vulgaris"
],
"DOI": "10.5455/jabet.2022.d116",
"sections": [
{
"section_number": 1,
"section_title": "INTRODUCTION",
"body": "<p>Plants play a significant part in the survival of life on Earth. Natural colorant production is increasing all over the world. Plant pigments are unique chemicals found in plants that absorb different wavelengths of light and give them a colorful appearance. It play an essential role in photosynthesis, plant growth and development [<a href=\"#r-1\">1</a>]. Plant pigments are metabolic byproducts that give plants their characteristic colors referred to as biochromes [<a href=\"#r-2\">2</a>]. Each pigment category is made up of a group of compounds with their own name, chemical structure, chemical properties, and color.<br />\r\n<em>Bixa orellana L.</em> (family Bixaceae) is a neotropical plant that is known in Mexico as achiote [<a href=\"#r-3\">3</a>]. The predominant orange-red colored component of natural achiote pigments is bixin, which is known as annatto [<a href=\"#r-4\">4</a>]. The aim of this research was to determine the bioactive elements of Bixa orellana through qualitative pharmacognostic and phytochemical analyses of the seeds, as well as to determine the plant part/organ with the highest concentration of phytoconstituents [<a href=\"#r-5\">5</a>].<br />\r\nPlant-derived pigments such as betalains have become popular for use as natural colorants in the food industry [<a href=\"#r-6\">6</a>]. <em>Beta vulgaris</em> contains a number of bioactive compounds that can reveal health-promoting effects, including betalains, ascorbic acid, flavonoids, polyphenols, saponins and nitrate [<a href=\"#r-7\">7</a>]. Several in vitro investigations have revealed that betalain pigments protect cellular components from oxidative damage [<a href=\"#r-8\">8</a>]. Extraction is required for the preparation of specific pigments as well as for gaining natural colorant extracts. Phytochemical screening revealed the presence of tannins, saponins, flavonoid, alkaloid, and phenolic component in plant. A comprehensive assortment of phytoconstituents in different extracts through HPTLC fingerprinting profiles displayed the existence of alkaloids, flavonoids and phenolics compounds.</p>"
},
{
"section_number": 2,
"section_title": "MATERIALS AND METHODS",
"body": "<p>The plant material for the proposed study such as <em>Bixa orellana</em> was collected from serenity botanical garden and <em>Beta vulgaris</em> was collected from local market. Dr. Hitesh solanki, Professor at Department of Botany, Bioinformatics and climate change impact management, University school of sciences, Gujarat University, Ahmedabad, Gujarat has authenticated the plants gathered. The plant authentication number of Bixa<em> orellana </em>and <em>Beta vulgaris </em>were found GU/BOT/B/O4 and GU/BOT/A/V12 respectively.</p>\r\n\r\n<p> </p>\r\n\r\n<p><strong>Processing of the plant</strong><br />\r\n<em>Washing</em><br />\r\nTo remove the clinging undesirable particles, the gathered healthy leaves were rinsed with water.</p>\r\n\r\n<p> </p>\r\n\r\n<p><em>Drying of plant material</em><br />\r\nBecause it lowers the moisture content of fresh materials, drying is a crucial step of dried material preparation for subsequent processing. However, drying conditions have been proven to have a considerable impact on sensory quality, bioactive component stability and activity. The plant material was dried in the shade for 7-15 days.</p>\r\n\r\n<p> </p>\r\n\r\n<p><em>Grinding</em><br />\r\nGrinding to get a homogeneous sample and to increase the surface contact of the sample with the solvent solution.</p>\r\n\r\n<p> </p>\r\n\r\n<p><em>Storage</em><br />\r\nPlant powders are stored at lower temperatures.</p>\r\n\r\n<p> </p>\r\n\r\n<p><strong>Physicochemical parameters</strong><br />\r\nThe numerous physicochemical characteristics are established in accordance with The Unani Pharmacopoeia of India. Odor, taste, color, moisture content, total ash value and extraction yield were all included.</p>\r\n\r\n<p> </p>\r\n\r\n<p><strong>Determination of moisture content</strong><br />\r\n1.5 gm powdered leaves were measured into a weighted plane & slim Porcelain dish. It was dehydrated in the oven at temperatures ranging from 100o to 105oC. Cooling in desiccators and observing weight loss is commonly measured as ‘moisture’ [<a href=\"#r-9\">9</a>].</p>\r\n\r\n<p> </p>\r\n\r\n<p><strong>Determination of total ash content</strong><br />\r\nWeigh about 2 grams of the air-dried material in a formerly burned and tarred silica crucible. Spread the material out evenly and progressively raise the temperature to 500 – 600°C until it is white, showing the carbon absence.<br />\r\nLet the remains to cool for 30 minutes in a desiccator before weighing with no time interval. Using air-dried material standards, percentages of ‘total ash’ were calculated [<a href=\"#r-10\">10</a>].<br />\r\nTotal ash value of the sample =100(Z-x)/y %<br />\r\nX= ‘weight of empty dish’<br />\r\nY= ‘weight of the drug taken’<br />\r\nZ= ‘weight of the dish + ash (after complete incineration)’</p>\r\n\r\n<p> </p>\r\n\r\n<p><strong>Extraction process</strong><br />\r\nThe dehydrated plant material of both plant species was grind using mortar and pestle to obtain fine powder and then it was passed through 1 mm sieve. To obtain crude extracts, 10 gram fine powders of both plant materials were soaked in 100 ml of various solvents such as methanol, acetone, chloroform, dichloromethane, ethanol and water separately for 5 to 7 days [<a href=\"#r-11\">11</a>]. The plant material was filtered and the remaining solid was extracted to remove all the remaining liquid. The obtained liquid was purified by filtration. The solvent was extracted using rotatory vacuum evaporator under reduced pressure. The dried extracts were placed in an airtight container and kept at 4°C until further examination [<a href=\"#r-12\">12</a>]. The yields of weighted extracts were kept in small bottles at refrigerator (4<sup>o</sup>C) (<a href=\"#figure1\">Figure 1</a>). Yield percentages were calculated using the following formula:<br />\r\nExtract yield % = weight of dried extract /weight of dried leave × 100</p>\r\n\r\n<div id=\"figure1\">\r\n<figure class=\"image\"><img alt=\"\" height=\"212\" src=\"/media/article_images/2023/55/07/178-1641574027-Figure1.jpg\" width=\"500\" />\r\n<figcaption><strong>Figure 1.</strong> Extraction of (A) <em>Bixa Orellana, </em>and (B) <em>Beta vulgaris.</em></figcaption>\r\n</figure>\r\n\r\n<p> </p>\r\n</div>\r\n\r\n<p><strong>Preliminary screening for extracted pigment by using chemical method</strong><br />\r\nTo examine the numerous chemical groups found in extracts, qualitative preliminary phytochemical experiments were performed (Table 1). Using recognized techniques, the presence of primary metabolites such as proteins, carbohydrates, fixed oils and fats was determined [<a href=\"#r-13\">13</a>]. Secondary metabolites in <em>Bixa orellana</em> and <em>Beta vulgaris</em> leaf extracts included alkaloids, flavonoids, saponins, polyphenols, tannins, terpenoids and glycosides [<a href=\"#r-14\">14</a>].</p>\r\n\r\n<p> </p>\r\n\r\n<p><strong>HPTLC fingerprinting analysis</strong><br />\r\nHPTLC studies were carried out using the standard method described by Wagner <em>et al</em>. 10ul of sample were loaded in Silica gel TLC plate [<a href=\"#r-15\">15</a>]. The samples loaded plate was kept in TLC twin trough developing chamber (after being saturated with solvent vapor) with respective mobile phases, namely toluene- acetone-formic acid (4.5 : 4.5 : 1) for flavonoids and Ethyl acetate-methanol-water(10:1.35:1) for alkaloid [<a href=\"#r-16\">16</a>]<strong>.</strong> The plate was developed up to 90mm. The developed plate was dried by hot air to evaporate solvents from the plate. The plate was kept in photo documentation chamber and the images were captured under visible light, UV 254 nm and UV 366 nm. The peak table, peak display and peak densitogram were noted [<a href=\"#r-17\">17</a>]</p>\r\n\r\n<div id=\"Table-1\">\r\n<p><a href=\"https://jabet.bsmiab.org/table/178-1641574027-table1/\">Table-1</a><strong>Table 1. </strong>Qualitative phytochemical screening of selected plant extract.</p>\r\n</div>"
},
{
"section_number": 3,
"section_title": "RESULTS",
"body": "<p><strong>Collection of plant material</strong><br />\r\nThe first phase in this research was to gather and treat plants such as <em>Bixa orellana </em>and <em>Beta vulgaris.</em> following that, several physicochemical features of plant powder should be noted. The following <a href=\"#Table-2\">Table 2</a> shows the observed outcome:</p>\r\n\r\n<div id=\"Table-2\">\r\n<p><a href=\"https://jabet.bsmiab.org/table/178-1641574027-table2/\">Table-2</a><strong>Table 2. </strong>Moisture content and Ash value of <em>Bixa orellana</em> and <em>Beta vulgaris.</em></p>\r\n\r\n<p> </p>\r\n</div>\r\n\r\n<p><strong>Extraction of natural colorant</strong><br />\r\n<a href=\"#Table-3\">Table 3</a> displays the extraction yields as well as the physical properties of plant extracts. <em>Bixa Orellana</em> extraction yields ranged from 12.34 % to 17.8 % and <em>Beta vulgaris</em> extraction yields range from 22.78 % to 30.47 % in various solvent systems. The yields of extracts varied greatly depending on the extraction solvent and plant material utilized. Extraction yields achieved in Methanol, Acetone, Chloroform, Dichloromethane, Aqueous methanol, Aqueous ethanol, Aqueous acetone, and Methanol solvent systems of 17.81 %, 13.71 %, 12.34 %, 13.47 %, 30.47 %, 28.69 %, 27.71 % and 22.78 %, respectively.<br />\r\nThe color of extract from the solvents Methanol, Acetone, Chloroform, Dichloromethane were discovered to be Orange and the sense of touch was found to be sticky. While the extract from Aqueous methanol, Aqueous ethanol, Aqueous acetone, and Methanol were intense red in color and sticky to the sense of touch.</p>\r\n\r\n<div id=\"Table-3\">\r\n<p><a href=\"https://jabet.bsmiab.org/table/178-1641574027-table3/\">Table-3</a><strong>Table 3. </strong>Physical characteristics and % yield of extract: <em>Bixa orellana </em>and <em>Beta vulgaris.</em></p>\r\n\r\n<p> </p>\r\n</div>\r\n\r\n<p><strong>Preliminary screening for extracted pigment by using chemical method</strong><br />\r\nThe phytochemicals found in plant samples are the focus of natural product biological activity. A small amount of the dry extract was used for qualitative phytochemical screening. The presence of significant phenolic compounds, saponins, tannin, Flavonoid and other substances has been identified in the plants. (<a href=\"#Table-4\">Table 4</a>).</p>\r\n\r\n<div id=\"Table-4\">\r\n<p><a href=\"https://jabet.bsmiab.org/table/178-1641574027-table4/\">Table-4</a><strong>Table 4. </strong>Preliminary tests for <em>Bixa orellana</em> and <em>Beta vulgaris</em> extract.</p>\r\n\r\n<p> </p>\r\n</div>\r\n\r\n<p><strong>HPTLC fingerprinting of extracted pigments</strong><br />\r\n<em>Alkaloid profile</em><br />\r\nHPTLC fingerprint profile, chromatogram and densitogram for Alkaloid is presented in <a href=\"#figure2\">figure 2</a>, <a href=\"#figure3\">3</a>, and <a href=\"#figure4\">4</a>, respectively. A variety of extracts like methanol extract, acetone extract, chloroform extract, dichloromethane extract, aqueous methanol extract, aqueous ethanol extract, aqueous acetone extract and methanol extract of <em>Bixa orellana </em>and <em>Beta vulgaris</em> were used for HPTLC Alkaloids profile that represented the presence of bands with Rf values ranged from 0.03 to 0.93, 0.09 to 0.92, 0.04 to 0.94, 0.03 to 0.75, 0.03 to 0.92, 0.09 to 0.91, 0.04 to 0.83, 0.09 to 0.90, respectively.</p>\r\n\r\n<div id=\"figure2\">\r\n<figure class=\"image\"><img alt=\"\" height=\"236\" src=\"/media/article_images/2023/55/07/178-1641574027-Figure2.jpg\" width=\"500\" />\r\n<figcaption><strong>Figure 2. </strong>Chromatograms of plant extract in HPTLC analysis. Alkaloid profile of (1. BVAE- Aqueous ethanol extract of <em>Beta vulgaris</em>, 2. BVAA- Aqueous acetone extract of<em> Beta vulgaris</em>, 3. BVM- Methanol extract of<em> Beta vulgaris</em>, 4. BVAM- Aqueous methanol extract of <em>Beta vulgaris</em>, 5. BOD- Dichloromethane extract of <em>Bixa orellana</em>, 6. BOM- Methanol extract of <em>Bixa orellana</em>, 7. BOA- Acetone extract of<em> Bixa orellana</em>, 8. BOC- Chloroform extract of<em> Bixa orellana</em>).</figcaption>\r\n</figure>\r\n</div>\r\n\r\n<div id=\"figure3\">\r\n<figure class=\"image\"><img alt=\"\" height=\"570\" src=\"/media/article_images/2023/55/07/178-1641574027-Figure3.jpg\" width=\"500\" />\r\n<figcaption><strong>Figure 3. </strong>HPTLC peak densitogram of alkaloid profile (at 366 nm) of <em>Beta vulgaris</em> and <em>Bixa orellana</em> plant extract (A. BVAE- Aqueous ethanol extract of <em>Beta vulgaris</em>, B. BVAA- Aqueous acetone extract of<em> Beta vulgaris</em>, C. BVM- Methanol extract of<em> Beta vulgaris</em>, D. BVAM- Aqueous methanol extract of <em>Beta vulgaris</em>, E. BOD- Dichloromethane extract of <em>Bixa orellana</em>, F. BOM- Methanol extract of <em>Bixa orellana</em>, G. BOA- Acetone extract of<em> Bixa orellana</em>, H. BOC- Chloroform extract of<em> Bixa orellana</em>).</figcaption>\r\n</figure>\r\n</div>\r\n\r\n<div id=\"figure4\">\r\n<figure class=\"image\"><img alt=\"\" height=\"577\" src=\"/media/article_images/2023/55/07/178-1641574027-Figure4.jpg\" width=\"500\" />\r\n<figcaption><strong>Figure 4. </strong>HPTLC peak densitogram of alkaloid profile (at 254 nm) of <em>Beta vulgaris</em> and <em>Bixa orellana</em> plant extract (A. BVAE- Aqueous ethanol extract of <em>Beta vulgaris</em>, B. BVAA- Aqueous acetone extract of<em> Beta vulgaris</em>, C. BVM- Methanol extract of<em> Beta vulgaris</em>, D. BVAM- Aqueous methanol extract of <em>Beta vulgaris</em>, E. BOD- Dichloromethane extract of <em>Bixa orellana</em>, F. BOM- Methanol extract of<em> Bixa orellana</em>, G. BOA- Acetone extract of<em> Bixa orellana</em>, H. BOC- Chloroform extract of<em> Bixa orellana</em>).</figcaption>\r\n</figure>\r\n</div>\r\n\r\n<div id=\"Table-5\">\r\n<p><a href=\"https://jabet.bsmiab.org/table/178-1641574027-table5/\">Table-5</a><strong>Table 5. </strong>Peak table with retention factor (Rf) values of alkaloid compounds of <em>Bixa orellana</em> extract. </p>\r\n</div>\r\n\r\n<div id=\"Table-6\">\r\n<p><a href=\"https://jabet.bsmiab.org/table/178-1641574027-table6/\">Table-6</a><strong>Table 6. </strong>Peak table with retention factor (Rf) values of alkaloid compounds of <em>Beta vulgaris</em> extract.</p>\r\n\r\n<p> </p>\r\n</div>\r\n\r\n<p><strong>Phenolic profile</strong><br />\r\nHPTLC fingerprint profile, chromatogram and densitogram for Phenolic compounds is presented in <a href=\"#figure5\">figure 5</a>, <a href=\"#figure6\">6</a> and <a href=\"#figure7\">7</a>, respectively. A variety of extracts like Methanol extract, Acetone extract, Chloroform extract, Dichloromethane extract, Aqueous methanol extract, Aqueous ethanol extract, Aqueous acetone extract and Methanol extract of <em>Bixa orellana </em>and <em>Beta vulgaris</em> were used for HPTLC Phenolics profile that represented the presence of bands with Rf values ranged from 0.04 to 0.83, 0.05 to 0.43, 0.05 to 0.76, 0.05 to 0.72, 0.16 to 1.01, 0.13 to 1.04, 0.05 to 1.01 and 0.13 to 1.04, respectively.</p>\r\n\r\n<p> </p>\r\n\r\n<p><strong>Chromatograms of plant extract for phenolic profile (<em>Beta vulgaris</em> and <em>Bixa orellana</em>) in HPTLC analysis</strong><br />\r\n </p>\r\n\r\n<div id=\"figure5\">\r\n<figure class=\"image\"><img alt=\"\" height=\"231\" src=\"/media/article_images/2023/55/07/178-1641574027-Figure5.jpg\" width=\"500\" />\r\n<figcaption><strong>Figure 5.</strong> Chromatograms of plant extract in HPTLC analysis. Phenolic profile of (1. BVAE- Aqueous ethanol extract of <em>Beta vulgaris</em>, 2. BVAA- Aqueous acetone extract of<em> Beta vulgaris</em>, 3. BVM- Methanol extract of<em> Beta vulgaris</em>, 4. BVAM- Aqueous methanol extract of <em>Beta vulgaris</em>, 5. BOD- Dichloromethane extract of <em>Bixa orellana</em>, 6. BOM- Methanol extract of <em>Bixa orellana</em>, 7. BOA- Acetone extract of<em> Bixa orellana</em>, 8. BOC- Chloroform extract of<em> Bixa orellana</em>).</figcaption>\r\n</figure>\r\n</div>\r\n\r\n<div id=\"figure6\">\r\n<figure class=\"image\"><img alt=\"\" height=\"579\" src=\"/media/article_images/2023/55/07/178-1641574027-Figure6.jpg\" width=\"500\" />\r\n<figcaption><strong>Figure 6. </strong>HPTLC peak densitogram of Phenolic profile (at 366 nm) of <em>Beta vulgaris</em> and <em>Bixa orellana</em> plant extract (A. BVAE- Aqueous ethanol extract of <em>Beta vulgaris</em>, B. BVAA- Aqueous acetone extract of<em> Beta vulgaris</em>, C. BVM- Methanol extract of<em> Beta vulgaris</em>, D. BVAM- Aqueous methanol extract of <em>Beta vulgaris</em>, E. BOD- Dichloromethane extract of <em>Bixa orellana</em>, F. BOM- Methanol extract of <em>Bixa orellana</em>, G. BOA- Acetone extract of<em> Bixa orellana</em>, H. BOC- Chloroform extract of<em> Bixa orellana</em>).</figcaption>\r\n</figure>\r\n</div>\r\n\r\n<div id=\"figure7\">\r\n<figure class=\"image\"><img alt=\"\" height=\"537\" src=\"/media/article_images/2023/55/07/178-1641574027-Figure7.jpg\" width=\"500\" />\r\n<figcaption><strong>Figure 7. </strong>HPTLC peak densitogram of phenolic profile (at 254 nm) of <em>Beta vulgaris</em> and <em>Bixa orellana</em> plant extract (A. BVAE- Aqueous ethanol extract of <em>Beta vulgaris</em>, B. BVAA- Aqueous acetone extract of<em> Beta vulgaris</em>, C. BVM- Methanol extract of<em> Beta vulgaris</em>, D. BVAM- Aqueous methanol extract of <em>Beta vulgaris</em>, E. BOD- Dichloromethane extract of <em>Bixa orellana</em>, F. BOM- Methanol extract of <em>Bixa orellana</em>, G. BOA- Acetone extract of<em> Bixa orellana</em>, H. BOC- Chloroform extract of<em> Bixa orellana</em>).</figcaption>\r\n</figure>\r\n</div>\r\n\r\n<div id=\"Table-7\">\r\n<p><a href=\"https://jabet.bsmiab.org/table/178-1641574027-table7/\">Table-7</a><strong>Table 7.</strong> Peak table with retention factor (Rf) values of phenolic compounds of <em>Bixa orellana</em> extract.</p>\r\n</div>\r\n\r\n<div id=\"Table-8\">\r\n<p><a href=\"https://jabet.bsmiab.org/table/178-1641574027-table8/\">Table-8</a><strong>Table 8. </strong>Peak table with retention factor (Rf) values of phenolic compounds of <em>Beta vulgaris</em> extract.</p>\r\n</div>"
},
{
"section_number": 4,
"section_title": "DISCUSSION",
"body": "<p>The purpose of this study was to evaluate the HPTLC fingerprinting analysis of extracted pigments from plants for usage in a variety of industries. The extraction yield of chloroform extract of <em>Bixa orellana</em> was the lowest at 12.34 %. Methanol extract had the highest extraction yield of 17.81 %. The extraction yield of chloroform extract of <em>Beta vulgaris</em> was the lowest at 22.78 %. Aqueous methanol extract had the highest extraction yield of 30.47 %. Physicochemical properties of Plant extract such as colour and feeling of touch were observed.<br />\r\nThe phytochemical screening of different extracts of plant samples of <em>Bixa orellana and beta vulgaris </em> revealed the presence of some secondary metabolites such as alkaloids, phenolics, flavonoids, steroids, and terpenoids.<br />\r\nHPTLC can be used as a phytochemical marker and is more effective in the field of plant taxonomy for secondary metabolite identification. Alkaloids are amino acids like lysine, ornithine, phenyl alanine, tyrosine, tryptophan, and histidine that are present in plants and responsible for detection and analytical analysis of phytoconstituents or pigments. The HPTLC results determined the presence of 16 different types of alkaloids bands and validated 11 different Rf values ranged from 0.03 to 0.93 (<a href=\"#Table-5\">Table 5</a> and <a href=\"#Table-6\">6</a>). The alkaloid band with 𝑅𝑓 value 0.22 confirmed the presence of Colchicine, 0.31 confirmed the Strychnine, 0.09 confirmed the nicotine and 0.41 confirmed the Chelidonine in the BVAE, BOD, BOM, BVAA extract, respectively.<br />\r\nThe HPTLC results determined the presence of 16 different types of phenolics bands and validated 21 different Rf values ranged from 0.05 to 1.04 (<a href=\"#Table-7\">Table 7</a> and <a href=\"#Table-8\">8</a>). The phenolic band with 𝑅𝑓 value 0.75 confirmed the presence of quercetin in the BVAA, BVAM and BVAE extract.</p>"
},
{
"section_number": 5,
"section_title": "CONCLUSION",
"body": "<p>Considering the need for alternative synthetic pigment in food products, pharmaceutical science, and cosmeceutical application, it was thought interesting to analyze the natural plant extracts. This survey suggests that all the extracts derived from the <em>Beta vulgaris</em> and <em>Bixa orellana</em> plants include numerous phytochemicals such as phenol, tannin, flavonoid, saponin and others. The more phytochemicals were identified in the methanolic extract due to higher polarity of the solvent. Natural pigments have a lower stability than synthetic colorants, which poses certain issues in terms of color loss during food processing, storage, and marketing. HPTLC fingerprinting confirmed the presence of some flavonoid and alkaloid compound in different extract of selected plants which might be responsible for stability properties for plant pigment.</p>"
},
{
"section_number": 6,
"section_title": "ACKNOWLEDGEMENT",
"body": "<p>Authors are thankful for the contribution of colleagues and institution. Authors would like to acknowledge Ms. Kruti Dave for her continuous support.</p>"
},
{
"section_number": 7,
"section_title": "AUTHOR CONTRIBUTIONS",
"body": "<p>PP; Conceived and designed the experiments. PP and MP; analyzed the data and drafted the manuscripts. PP and MP; reviewed and corrected the manuscripts. All authors read and approved the final version of the article.</p>"
},
{
"section_number": 8,
"section_title": "CONFLICTS OF INTEREST",
"body": "<p>There is no conflict of interest among the authors.</p>"
}
],
"figures": [
{
"figure": "https://jabet.bsmiab.org/media/article_images/2023/55/07/178-1641574027-Figure1.jpg",
"caption": "Figure 1. Extraction of (A) Bixa Orellana, and (B) Beta vulgaris.",
"featured": false
},
{
"figure": "https://jabet.bsmiab.org/media/article_images/2023/55/07/178-1641574027-Figure2.jpg",
"caption": "Figure 2. Chromatograms of plant extract in HPTLC analysis. Alkaloid profile of (1. BVAE- Aqueous ethanol extract of Beta vulgaris, 2. BVAA- Aqueous acetone extract of Beta vulgaris, 3. BVM- Methanol extract of Beta vulgaris, 4. BVAM- Aqueous methanol extract of Beta vulgaris, 5. BOD- Dichloromethane extract of Bixa orellana, 6. BOM- Methanol extract of Bixa orellana, 7. BOA- Acetone extract of Bixa orellana, 8. BOC- Chloroform extract of Bixa orellana).",
"featured": false
},
{
"figure": "https://jabet.bsmiab.org/media/article_images/2023/55/07/178-1641574027-Figure3.jpg",
"caption": "Figure 3. HPTLC peak densitogram of alkaloid profile (at 366 nm) of Beta vulgaris and Bixa orellana plant extract (A. BVAE- Aqueous ethanol extract of Beta vulgaris, B. BVAA- Aqueous acetone extract of Beta vulgaris, C. BVM- Methanol extract of Beta vulgaris, D. BVAM- Aqueous methanol extract of Beta vulgaris, E. BOD- Dichloromethane extract of Bixa orellana, F. BOM- Methanol extract of Bixa orellana, G. BOA- Acetone extract of Bixa orellana, H. BOC- Chloroform extract of Bixa orellana).",
"featured": false
},
{
"figure": "https://jabet.bsmiab.org/media/article_images/2023/55/07/178-1641574027-Figure4.jpg",
"caption": "Figure 4. HPTLC peak densitogram of alkaloid profile (at 254 nm) of Beta vulgaris and Bixa orellana plant extract (A. BVAE- Aqueous ethanol extract of Beta vulgaris, B. BVAA- Aqueous acetone extract of Beta vulgaris, C. BVM- Methanol extract of Beta vulgaris, D. BVAM- Aqueous methanol extract of Beta vulgaris, E. BOD- Dichloromethane extract of Bixa orellana, F. BOM- Methanol extract of Bixa orellana, G. BOA- Acetone extract of Bixa orellana, H. BOC- Chloroform extract of Bixa orellana).",
"featured": false
},
{
"figure": "https://jabet.bsmiab.org/media/article_images/2023/55/07/178-1641574027-Figure5.jpg",
"caption": "Figure 5. Chromatograms of plant extract in HPTLC analysis. Phenolic profile of (1. BVAE- Aqueous ethanol extract of Beta vulgaris, 2. BVAA- Aqueous acetone extract of Beta vulgaris, 3. BVM- Methanol extract of Beta vulgaris, 4. BVAM- Aqueous methanol extract of Beta vulgaris, 5. BOD- Dichloromethane extract of Bixa orellana, 6. BOM- Methanol extract of Bixa orellana, 7. BOA- Acetone extract of Bixa orellana, 8. BOC- Chloroform extract of Bixa orellana).",
"featured": false
},
{
"figure": "https://jabet.bsmiab.org/media/article_images/2023/55/07/178-1641574027-Figure6.jpg",
"caption": "Figure 6. HPTLC peak densitogram of Phenolic profile (at 366 nm) of Beta vulgaris and Bixa orellana plant extract (A. BVAE- Aqueous ethanol extract of Beta vulgaris, B. BVAA- Aqueous acetone extract of Beta vulgaris, C. BVM- Methanol extract of Beta vulgaris, D. BVAM- Aqueous methanol extract of Beta vulgaris, E. BOD- Dichloromethane extract of Bixa orellana, F. BOM- Methanol extract of Bixa orellana, G. BOA- Acetone extract of Bixa orellana, H. BOC- Chloroform extract of Bixa orellana).",
"featured": false
},
{
"figure": "https://jabet.bsmiab.org/media/article_images/2023/55/07/178-1641574027-Figure7.jpg",
"caption": "Figure 7. HPTLC peak densitogram of phenolic profile (at 254 nm) of Beta vulgaris and Bixa orellana plant extract (A. BVAE- Aqueous ethanol extract of Beta vulgaris, B. BVAA- Aqueous acetone extract of Beta vulgaris, C. BVM- Methanol extract of Beta vulgaris, D. BVAM- Aqueous methanol extract of Beta vulgaris, E. BOD- Dichloromethane extract of Bixa orellana, F. BOM- Methanol extract of Bixa orellana, G. BOA- Acetone extract of Bixa orellana, H. BOC- Chloroform extract of Bixa orellana).",
"featured": false
}
],
"authors": [
{
"id": 216,
"affiliation": [
{
"affiliation": "Department of Biotechnology, Mehsana Urban Institute of Sciences, Ganpat University, Mehsana, Gujarat, India"
}
],
"first_name": "Mrunali",
"family_name": "Patel",
"email": null,
"author_order": 1,
"ORCID": null,
"corresponding": false,
"co_first_author": false,
"co_author": false,
"corresponding_author_info": "",
"article": 59
},
{
"id": 217,
"affiliation": [
{
"affiliation": "Department of Biotechnology, Mehsana Urban Institute of Sciences, Ganpat University, Mehsana, Gujarat, India"
}
],
"first_name": "Priti",
"family_name": "Patel",
"email": "priti.patel@ganpatuniversity.ac.in",
"author_order": 2,
"ORCID": null,
"corresponding": true,
"co_first_author": false,
"co_author": false,
"corresponding_author_info": "Priti Patel, PhD; Department of Biotechnology, Mehsana Urban Institute of\r\nSciences, Ganpat University, Mehsana, Gujarat, India, email: priti.patel@ganpatuniversity.ac.in",
"article": 59
}
],
"views": 768,
"downloads": 124,
"references": [
{
"id": 1765,
"serial_number": 1,
"pmc": null,
"reference": "Carvalho RF, Takaki M, Azevedo RA. Plant pigments: the many faces of light perception. Acta Physiologiae Plantarum. 2011; 33(2): 241-248.",
"DOI": null,
"article": 59
},
{
"id": 1766,
"serial_number": 2,
"pmc": null,
"reference": "Tanaka Y. Plant pigments for coloration: anthocyanins, betalains and carotenoids. Plant J. 2008; 54:733-749.",
"DOI": null,
"article": 59
},
{
"id": 1767,
"serial_number": 3,
"pmc": null,
"reference": "Carvalho JL, Moreira PA, Dequigiovanni G, Clement CR, Veasey EA. The domestication of Annatto (Bixa orellana) from Bixa urucurana in Amazonia. 2015; doi: 10.1007/s12231-015-9304-0.",
"DOI": null,
"article": 59
},
{
"id": 1768,
"serial_number": 4,
"pmc": null,
"reference": "De-Oliveira AC, Silva IB, Manhaes-Rocha DA, Paumgartten FJ. Induction of liver monooxygenases by annatto and bixin in female rats. Brazilian Journal of Medical and Biological Research. 2003 Jan;36(1):113-118.",
"DOI": null,
"article": 59
},
{
"id": 1769,
"serial_number": 5,
"pmc": null,
"reference": "Conrad OA, Dike IP, Agbara U. In vivo antioxidant assessment of two antimalarial plants–Allamamda cathartica and Bixa orellana. Asian Pacific journal of tropical biomedicine. 2013; 1;3(5):388-94.",
"DOI": null,
"article": 59
},
{
"id": 1770,
"serial_number": 6,
"pmc": null,
"reference": "Gengatharan A, Dykes GA, Choo WS. Betalains: Natural plant pigments with potential application in functional foods. LWT-Food Science and Technology. 2015 Dec 1;64(2):645-9.",
"DOI": null,
"article": 59
},
{
"id": 1771,
"serial_number": 7,
"pmc": null,
"reference": "Clifford T, Howatson G, West DJ, Stevenson EJ. The potential benefits of red beetroot supplementation in health and disease. Nutrients. 2015 Apr;7(4):2801-22.",
"DOI": null,
"article": 59
},
{
"id": 1772,
"serial_number": 8,
"pmc": null,
"reference": "Kanner J, Harel S, Granit R. Betalains a new class of dietary cationized antioxidants. Journal of Agricultural and Food chemistry. 2001 Nov 19;49(11):5178-5185.",
"DOI": null,
"article": 59
},
{
"id": 1773,
"serial_number": 9,
"pmc": null,
"reference": "Thiex N. Evaluation of analytical methods for the determination of moisture, crude protein, crude fat, and crude fiber in distillers dried grains with solubles. Journal of AOAC international. 2009 Jan 1;92(1):61-73.",
"DOI": null,
"article": 59
},
{
"id": 1774,
"serial_number": 10,
"pmc": null,
"reference": "Motegaonkar Manorama B, Salunke Shridar D. The ash and iron content of common vegetable grown in Latur District, India. Research Journal of Recent Sciences. 2012; 2277:2502.",
"DOI": null,
"article": 59
},
{
"id": 1775,
"serial_number": 11,
"pmc": null,
"reference": "Patel M, Dave K. and Patel P. “A review on different extraction method of plants : innovation from ancient to modern technology. International journal of biology, pharmacy and allied sciences. 2021; vol. 10(12): 511-527.",
"DOI": null,
"article": 59
},
{
"id": 1776,
"serial_number": 12,
"pmc": null,
"reference": "Wang L, Curtis L. Weller, Recent advances in extraction of nutraceuticals from plants. Trends in Food Science & Technology. 2006;17:300-312.",
"DOI": null,
"article": 59
},
{
"id": 1777,
"serial_number": 13,
"pmc": null,
"reference": "Doss A. Preliminary phytochemical screening of some Indian medicinal plants. Ancient science of life. 2009; 29(2):12.",
"DOI": null,
"article": 59
},
{
"id": 1778,
"serial_number": 14,
"pmc": null,
"reference": "Poongothai A. Qualitative and quantitative phytochemical analysis of lantana camara leaf extract. 2019; 6(12): 603–607.",
"DOI": null,
"article": 59
},
{
"id": 1779,
"serial_number": 15,
"pmc": null,
"reference": "Dave K, Patel P, and Patel R. HPTLC Fingerprint Profile and Antifungal activity of selected botanical extract against Fusarium oxysporum for management of cumin wilt disease. 2021; 10: 54–68.",
"DOI": null,
"article": 59
},
{
"id": 1780,
"serial_number": 16,
"pmc": null,
"reference": "Cortés N, Mora C, Muñoz K, Díaz J, Serna R, Castro D, Osorio E. Microscopical descriptions and chemical analysis by HPTLC of Taraxacum officinale in comparison to Hypochaeris radicata: a solution for mis-identification. Revista Brasileira de Farmacognosia. 2014; 24:381-388.",
"DOI": null,
"article": 59
},
{
"id": 1781,
"serial_number": 17,
"pmc": null,
"reference": "Senguttuvan J, Subramaniam P. HPTLC Fingerprints of Various Secondary Metabolites in the Traditional Medicinal Herb Hypochaeris radicata L. Journal of Botany. 2016; 14.",
"DOI": null,
"article": 59
}
]
}
]
}
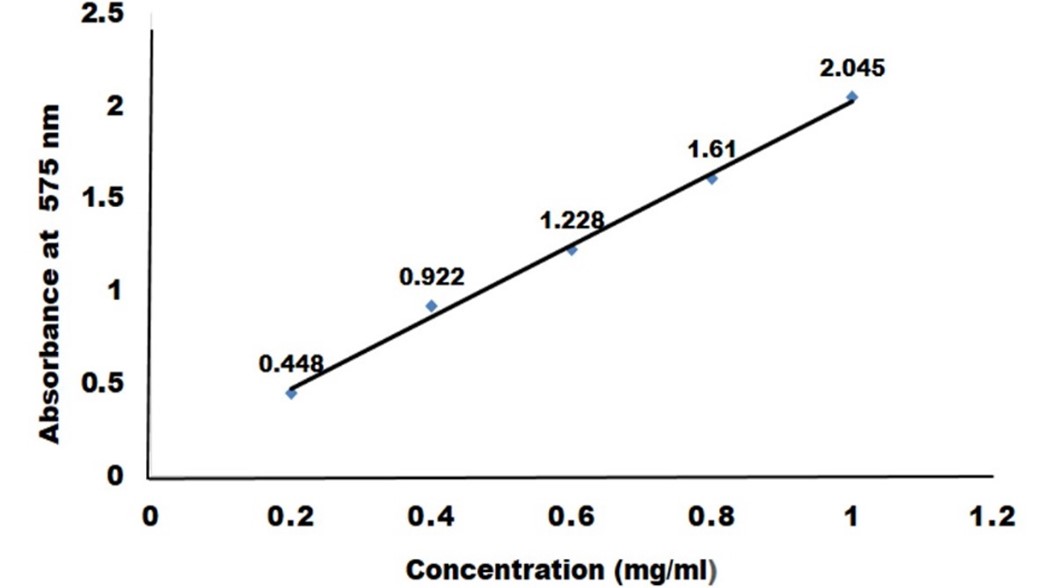
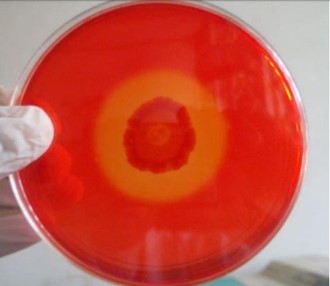
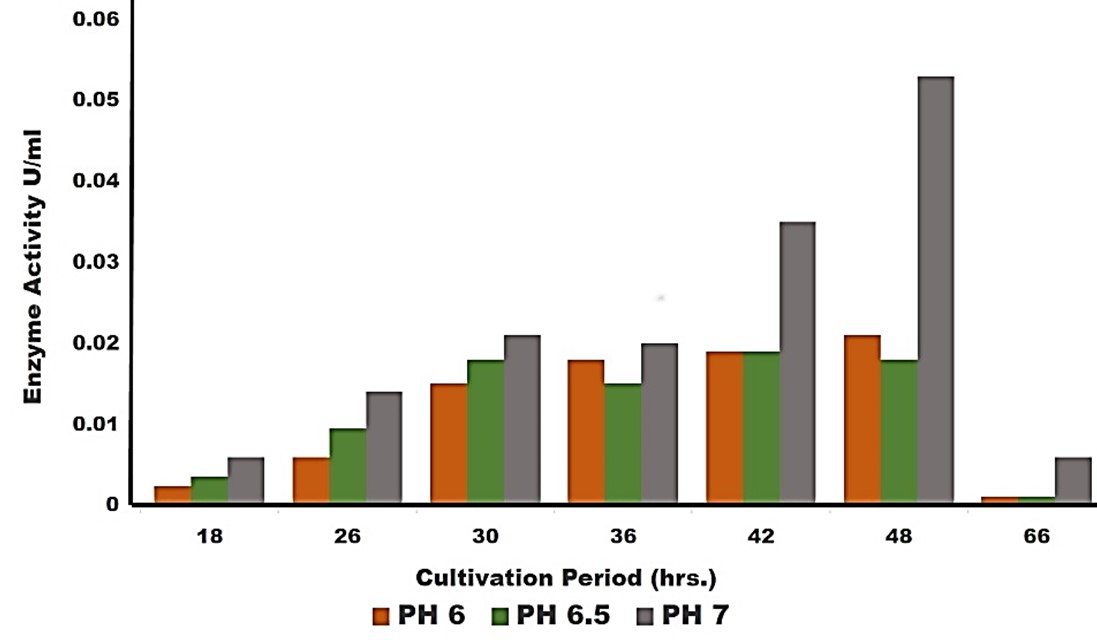
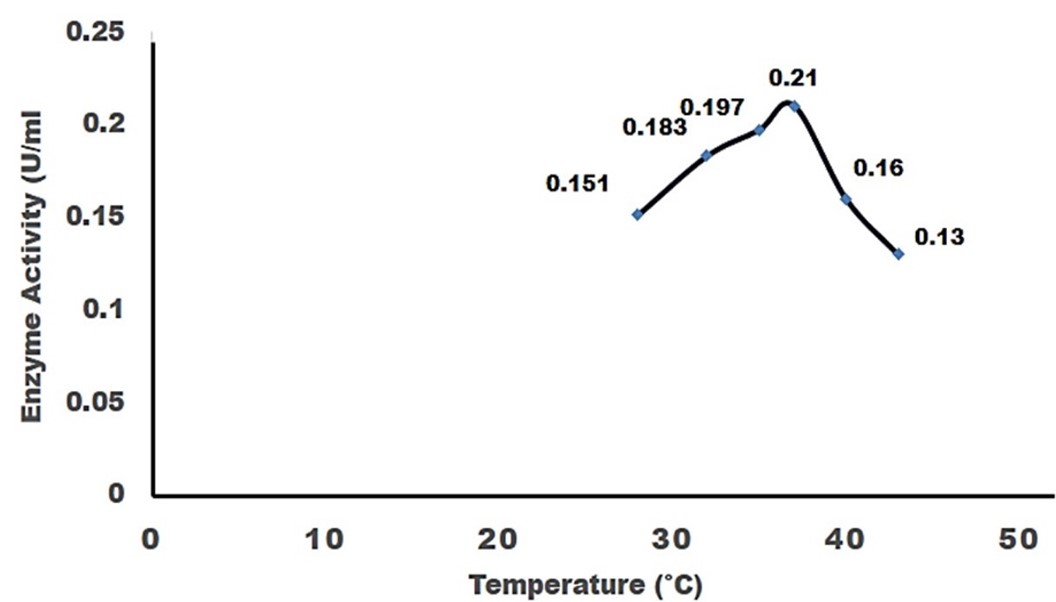
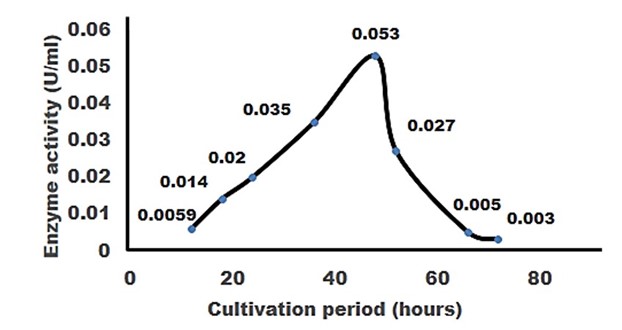
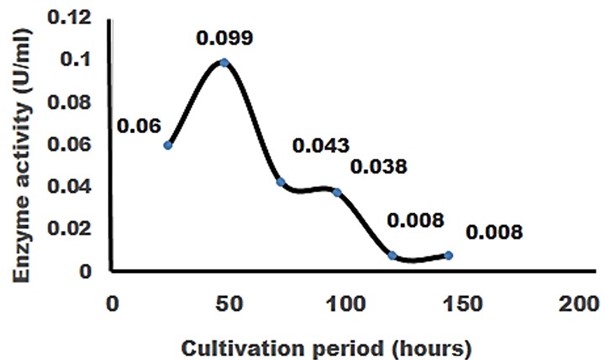
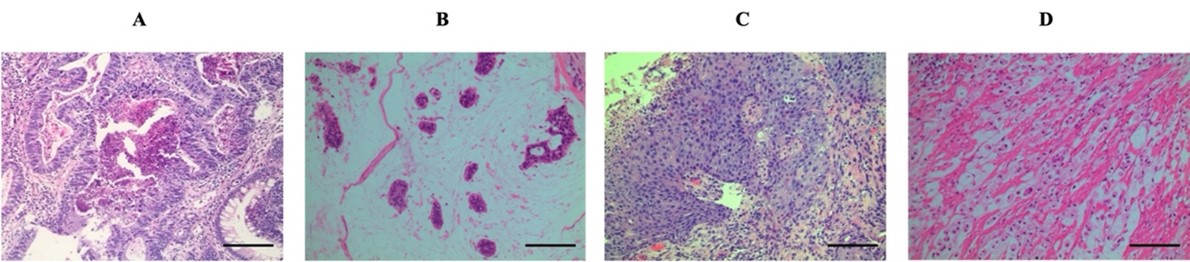
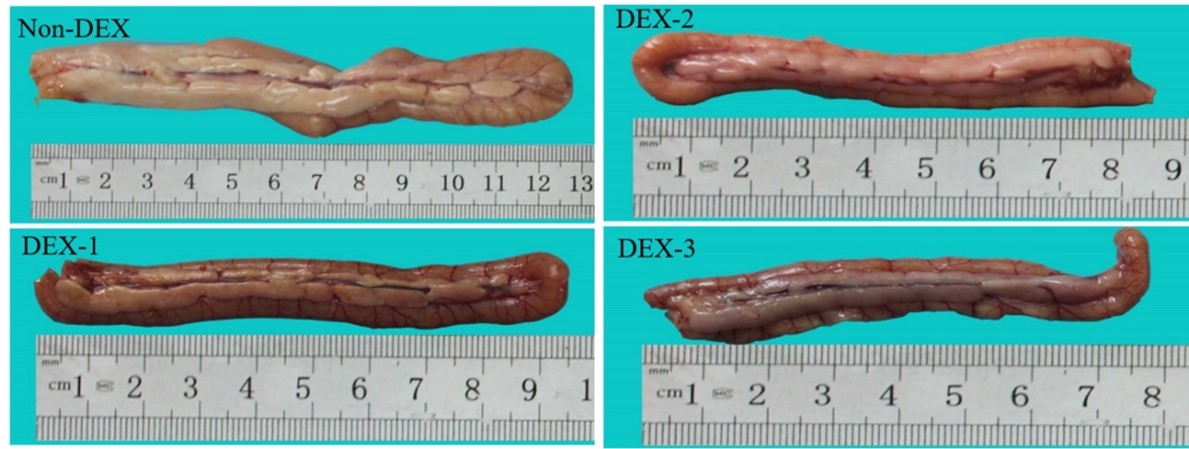
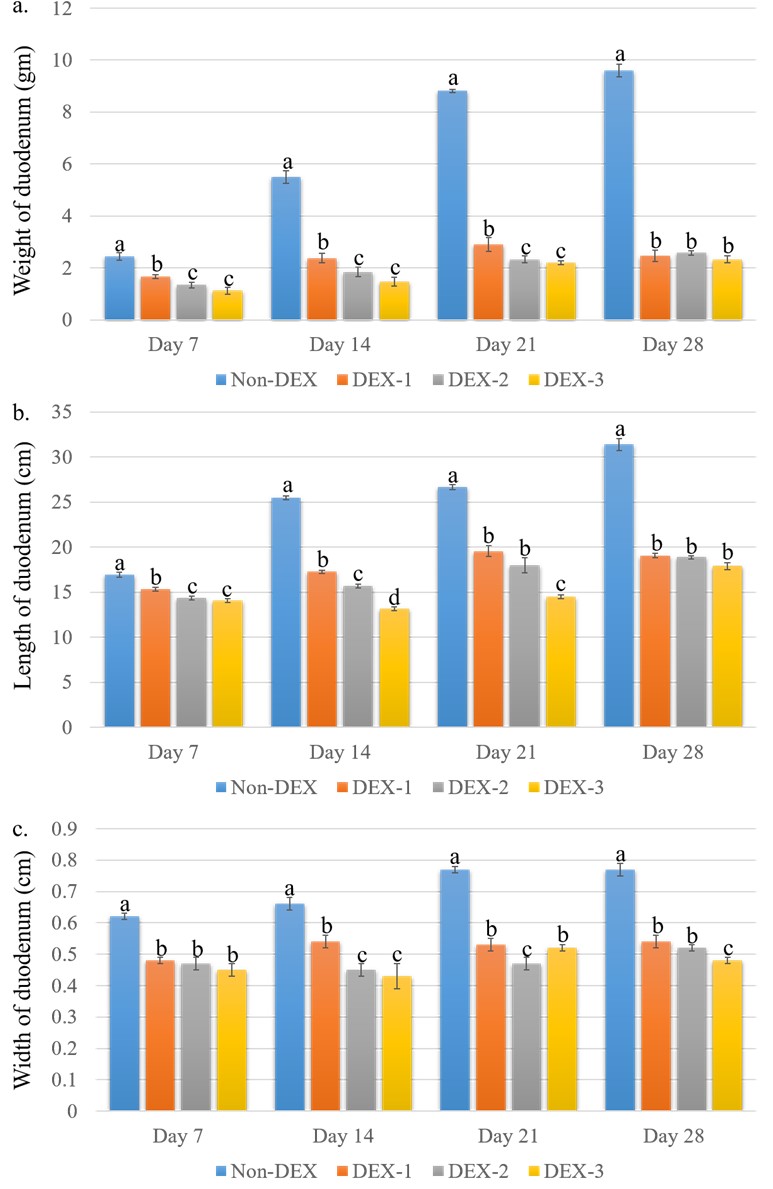
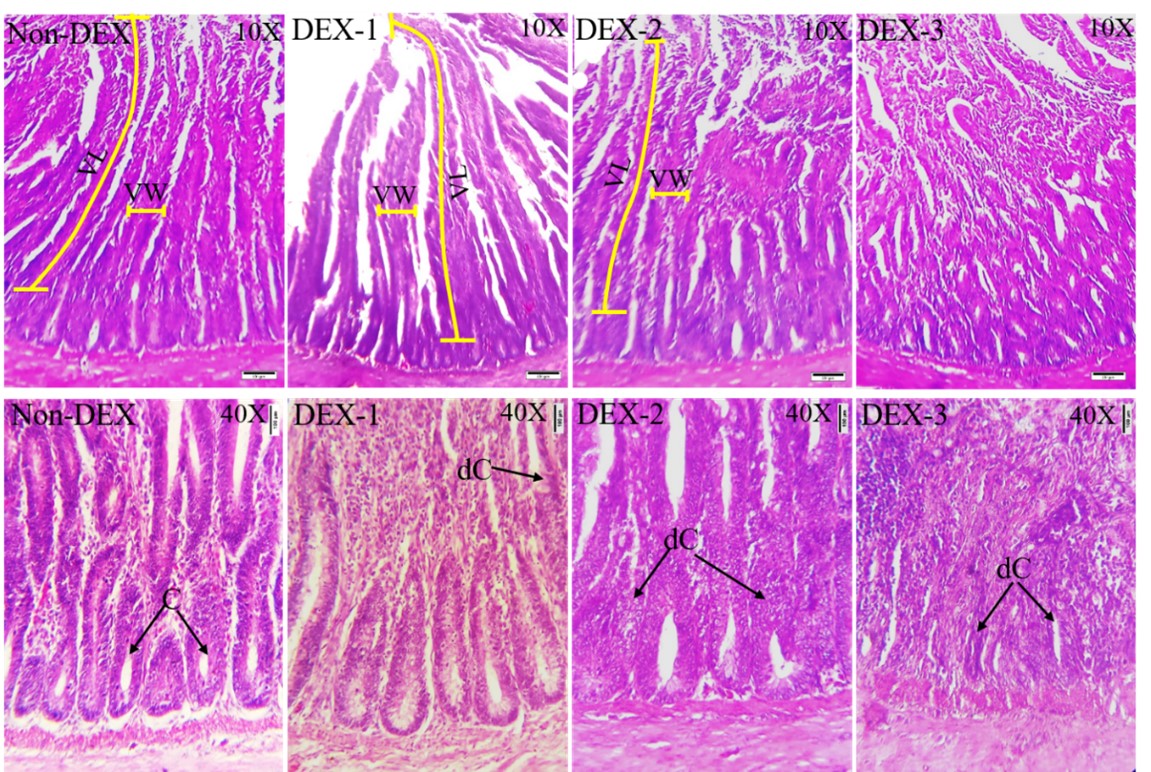
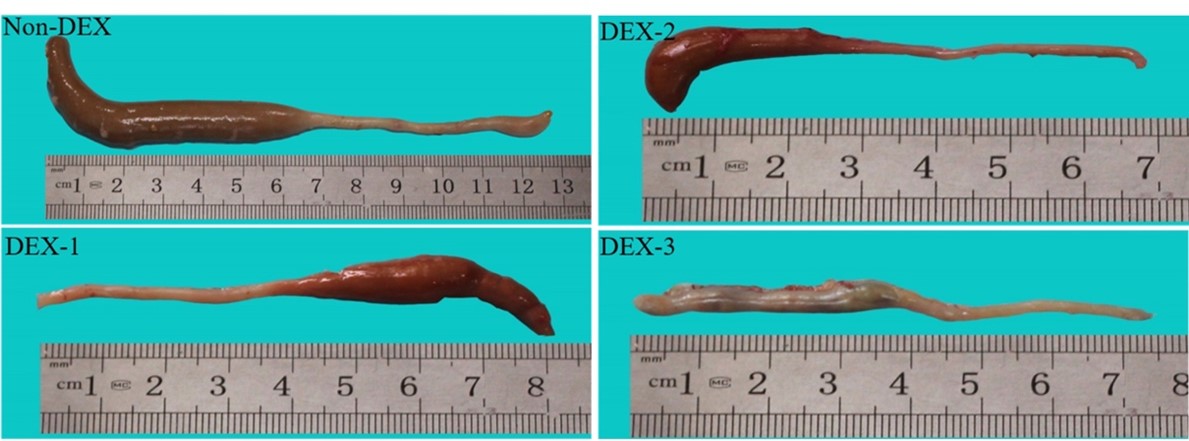
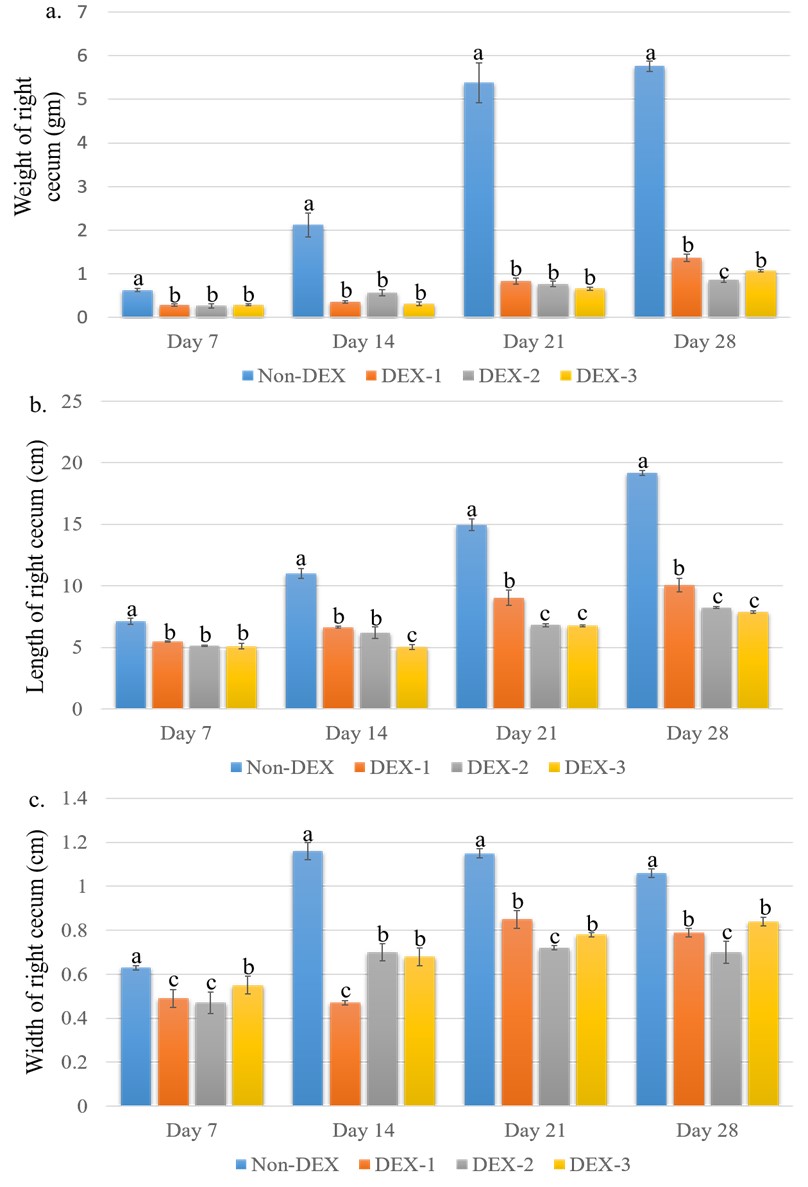
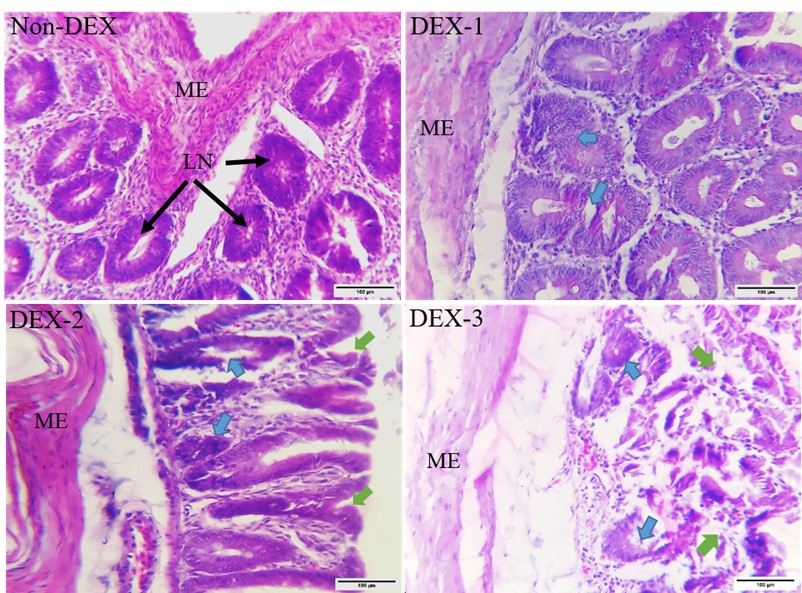
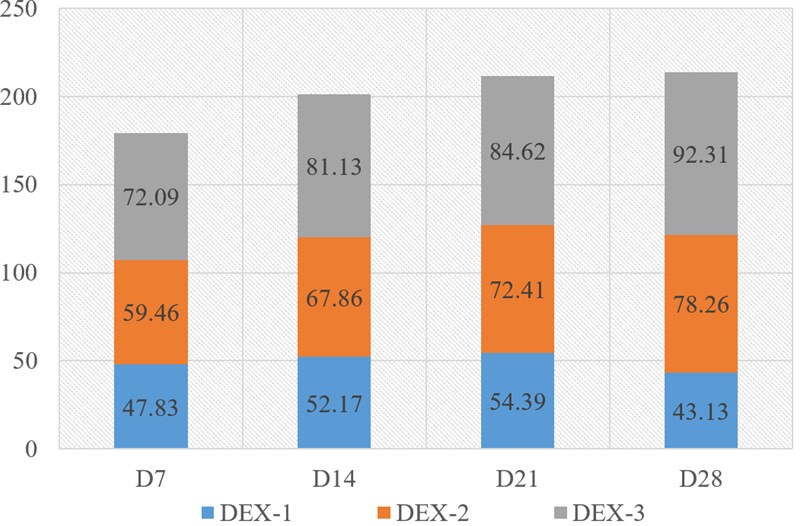
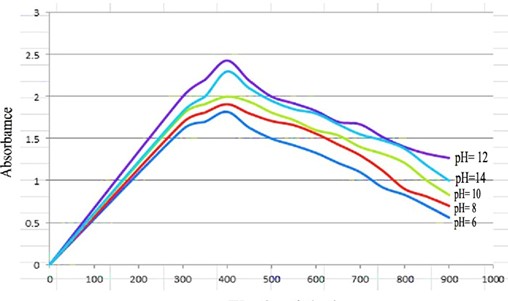
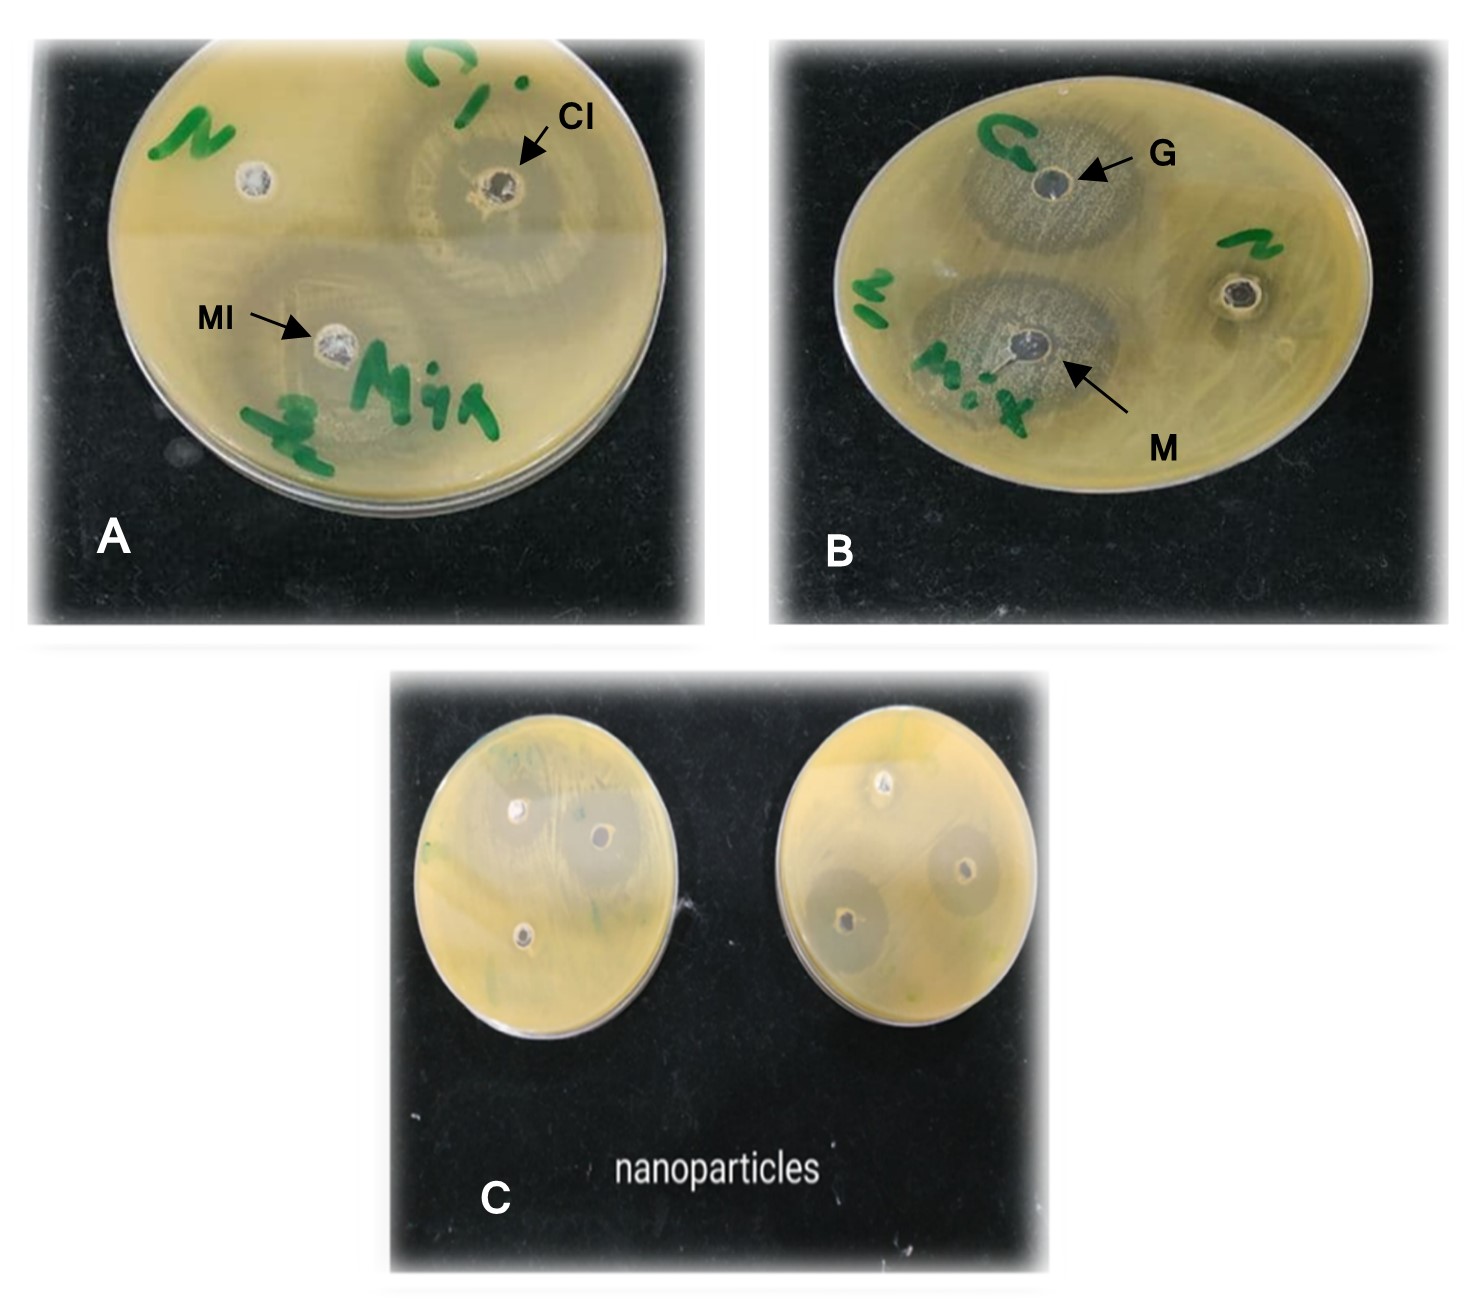
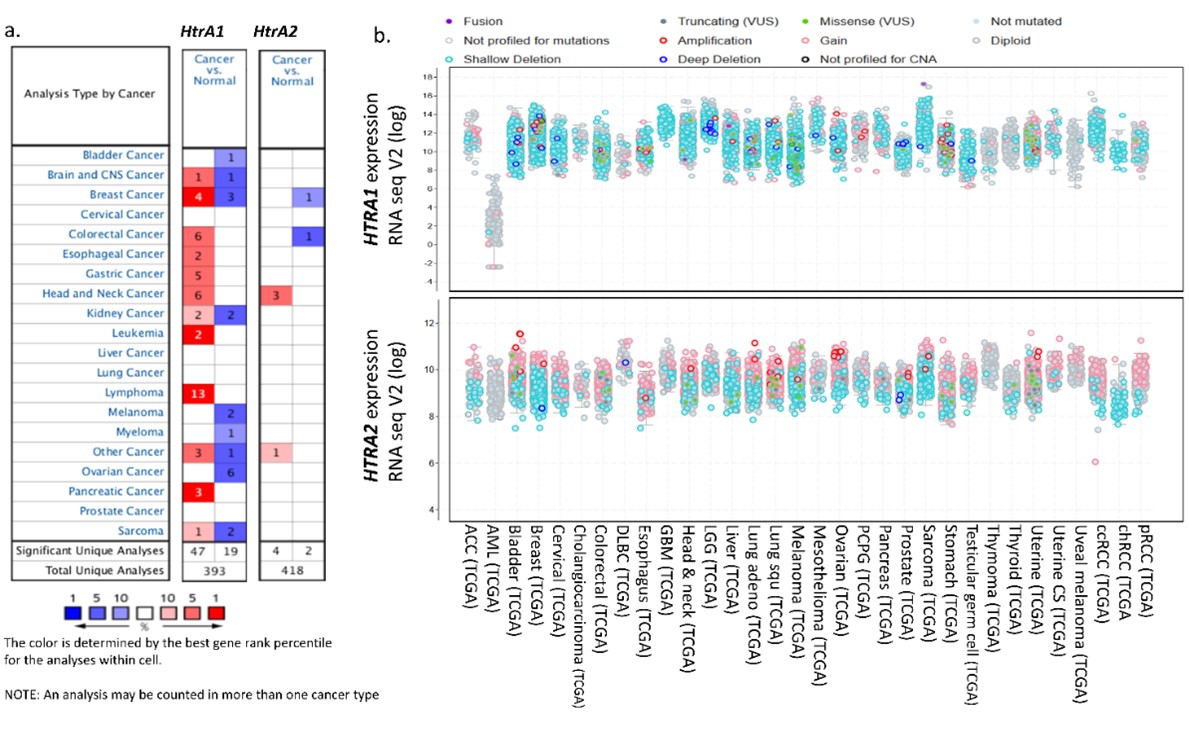
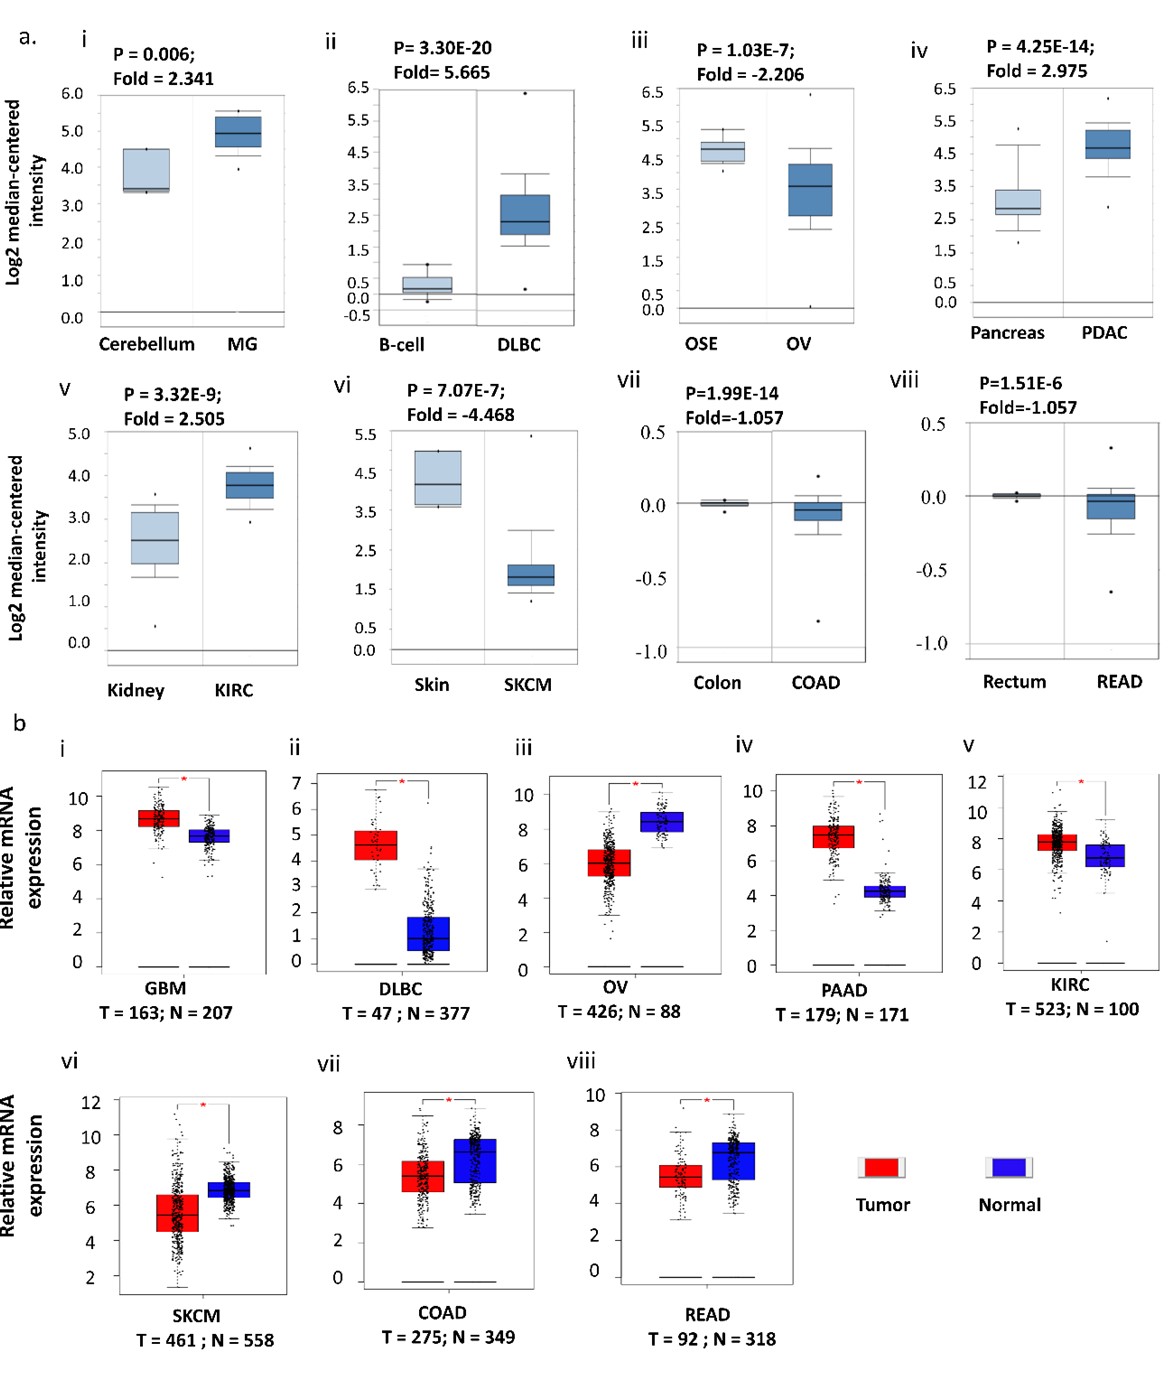
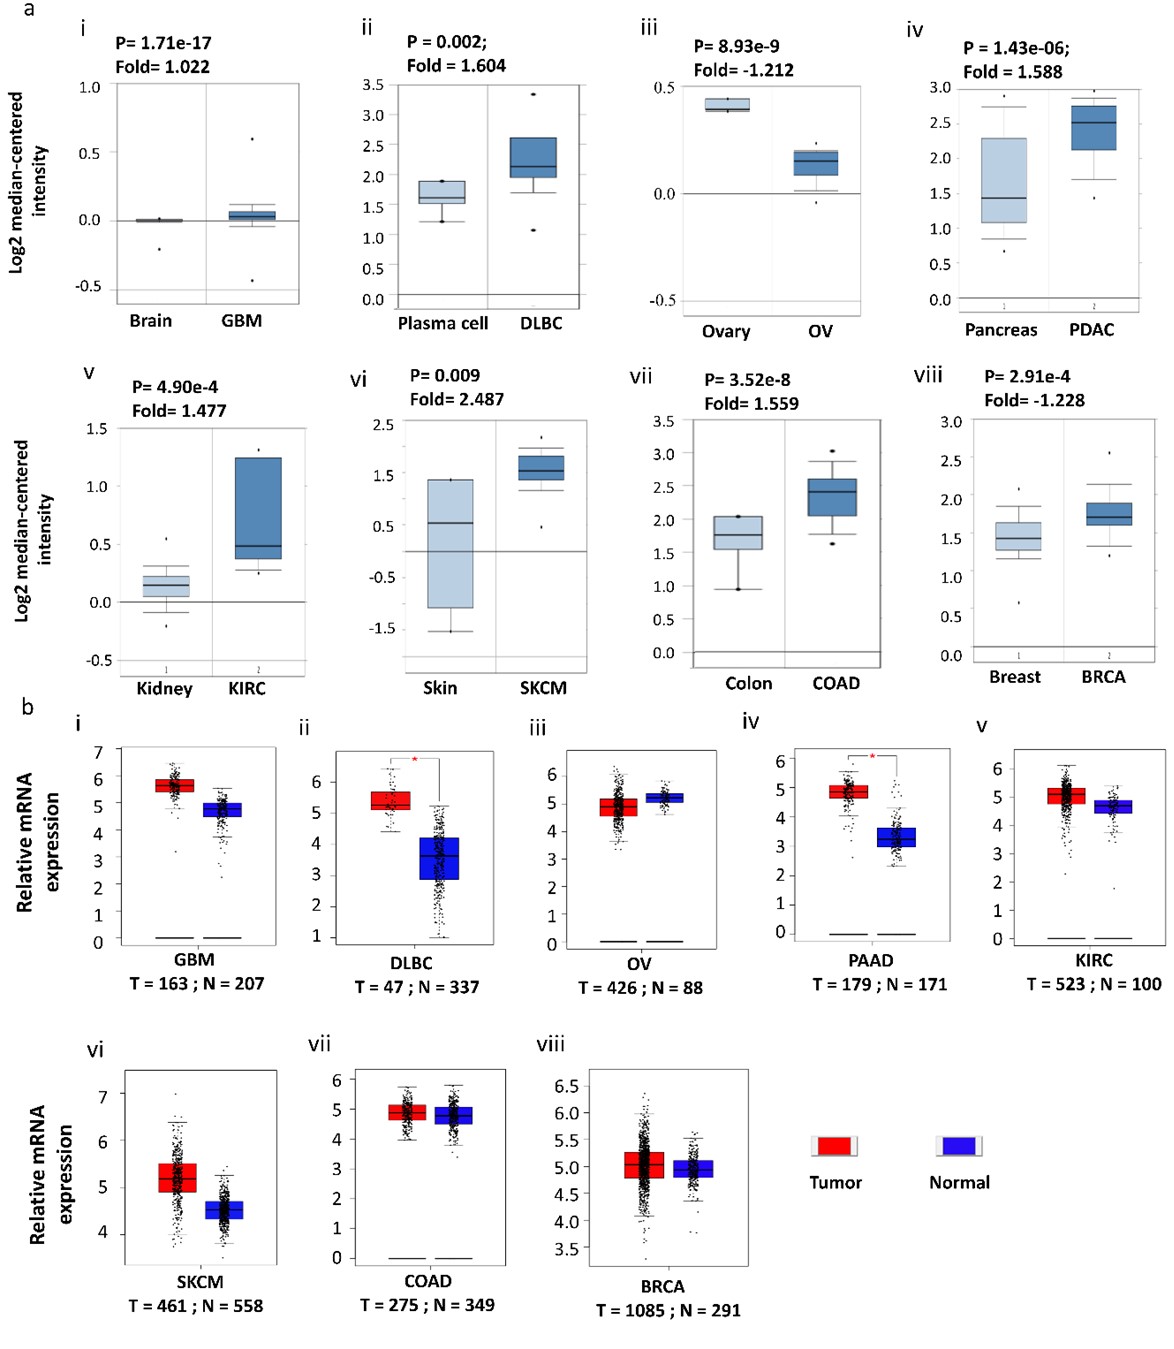
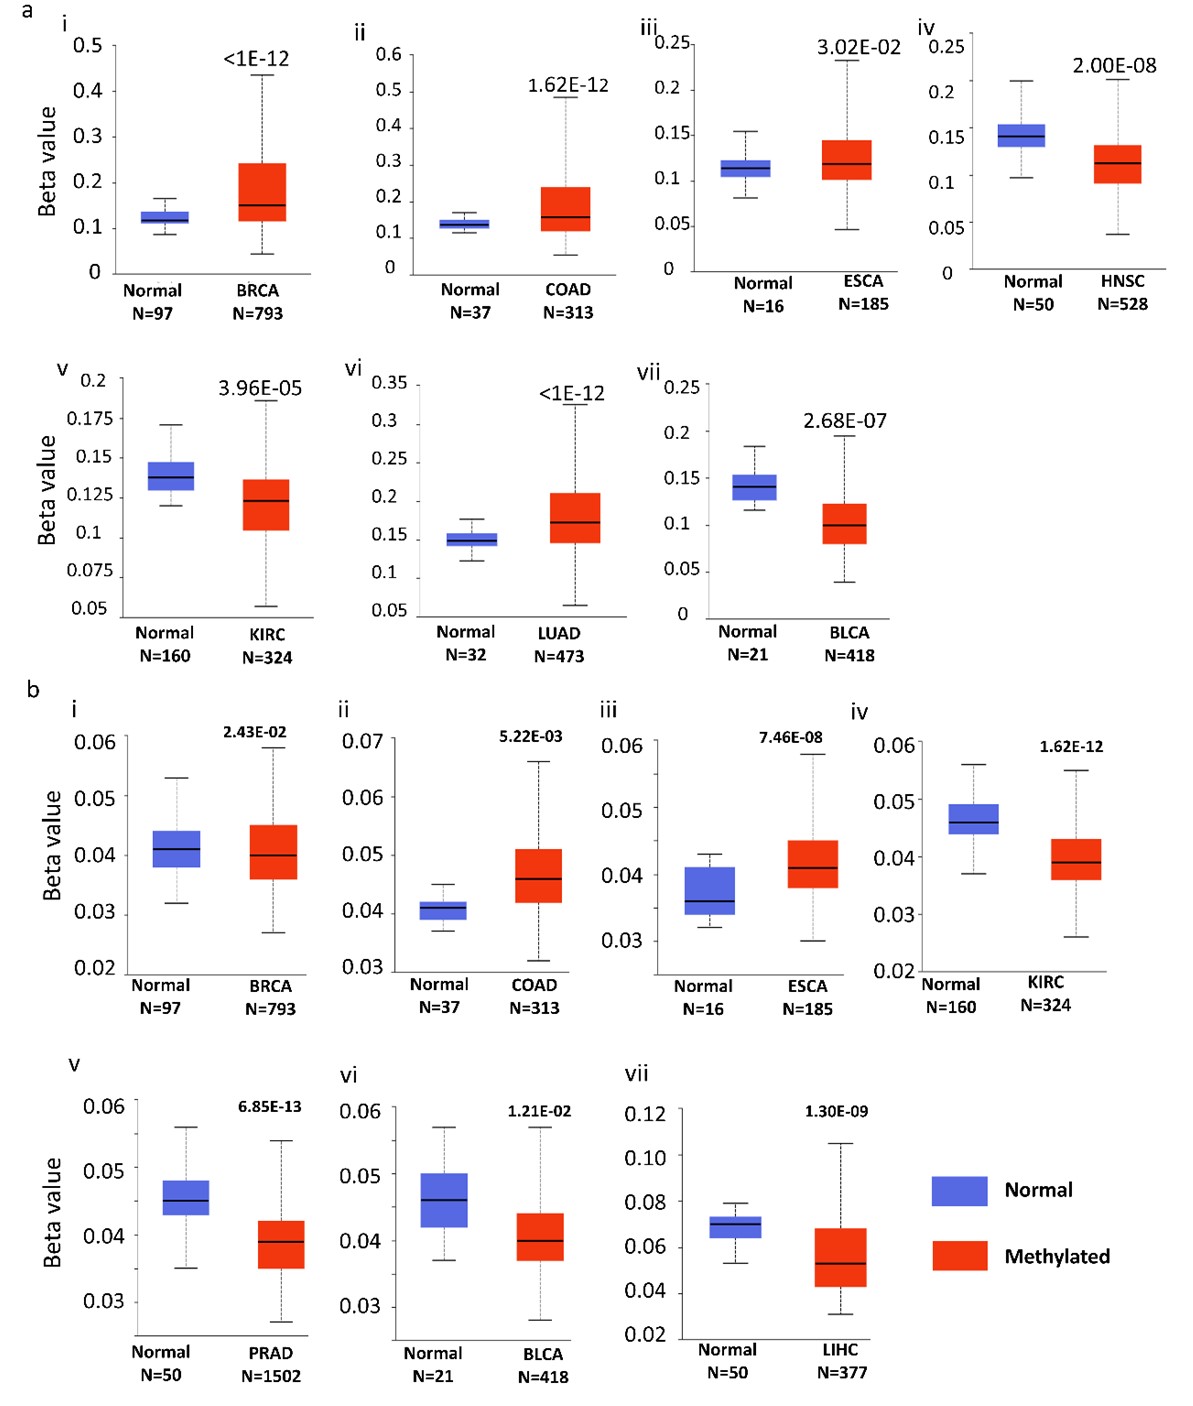
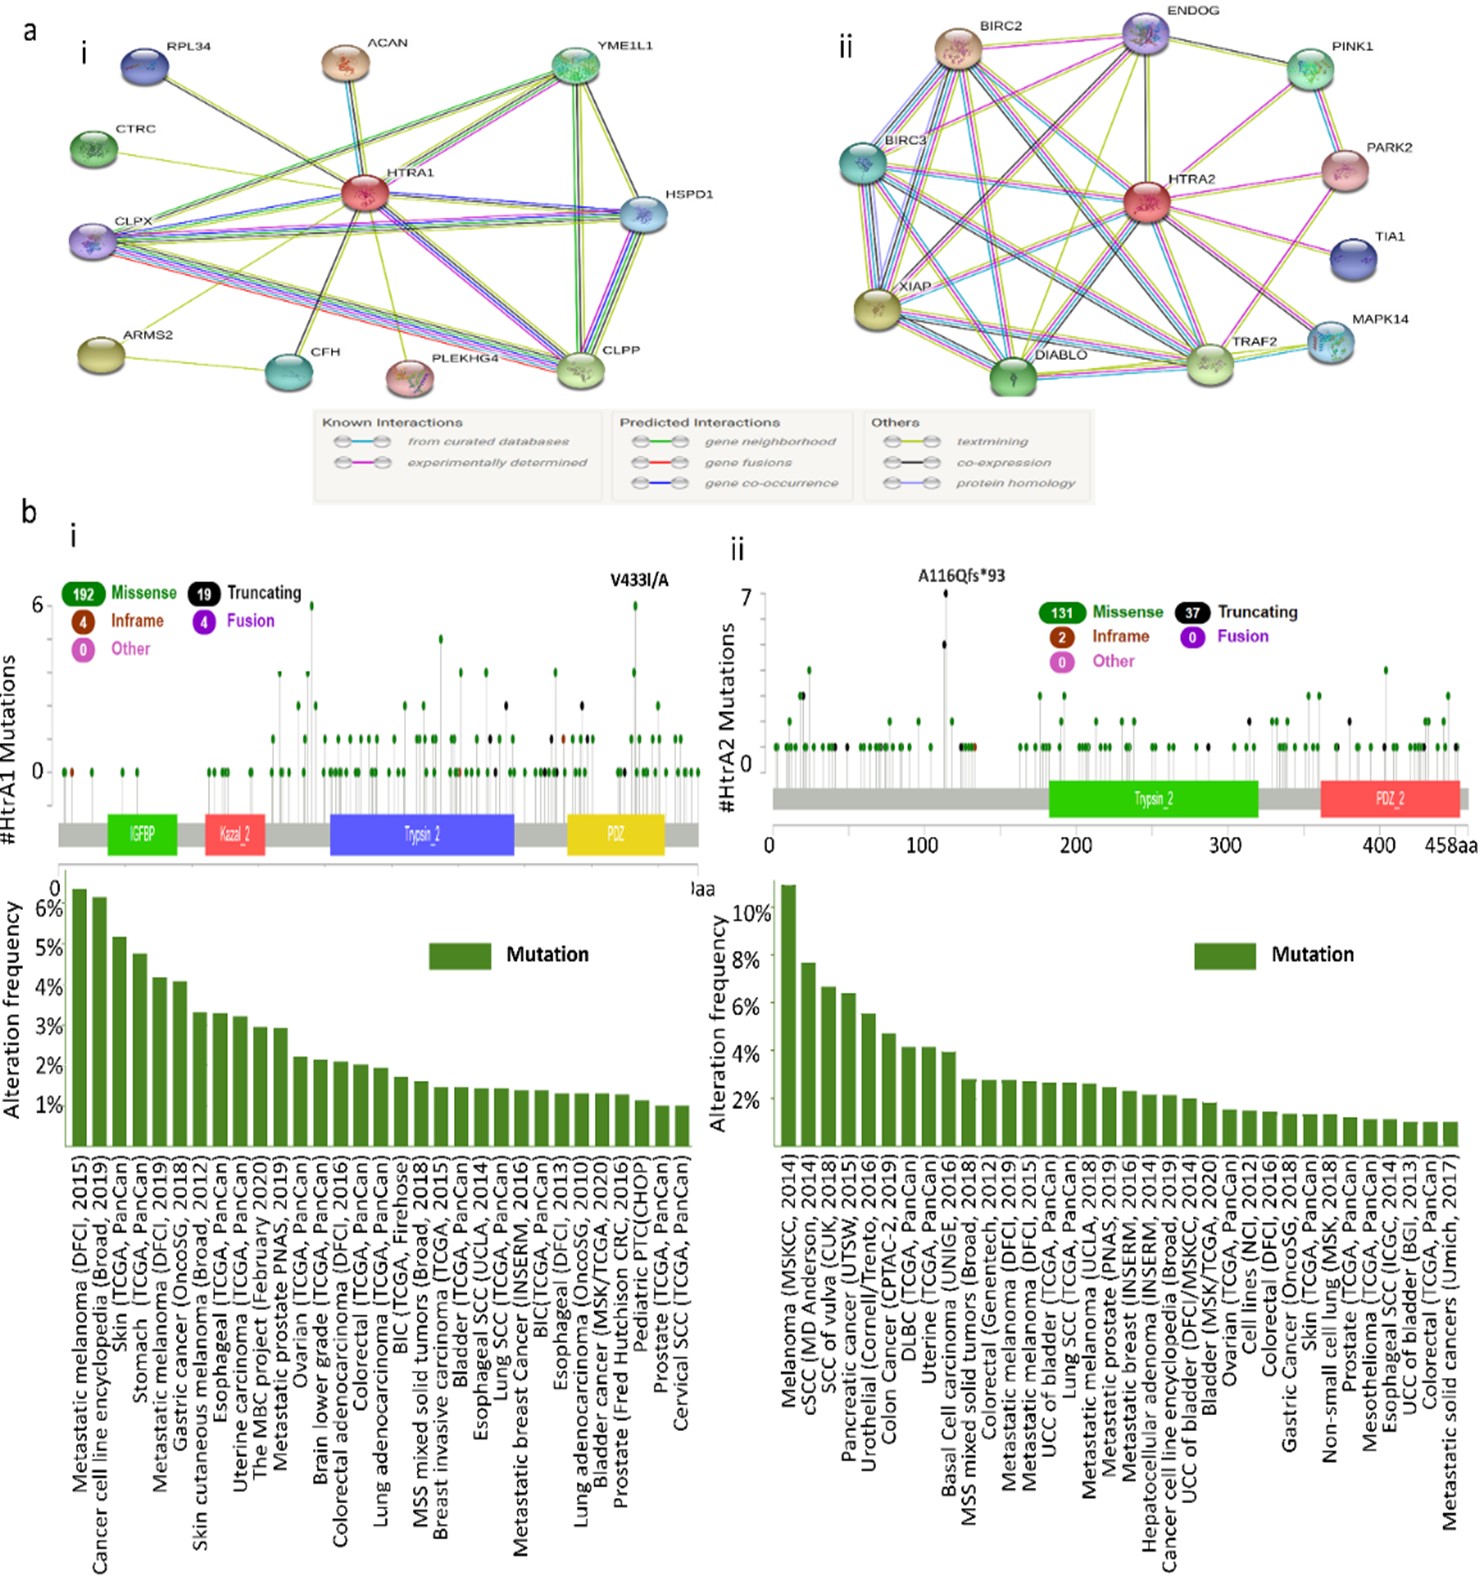
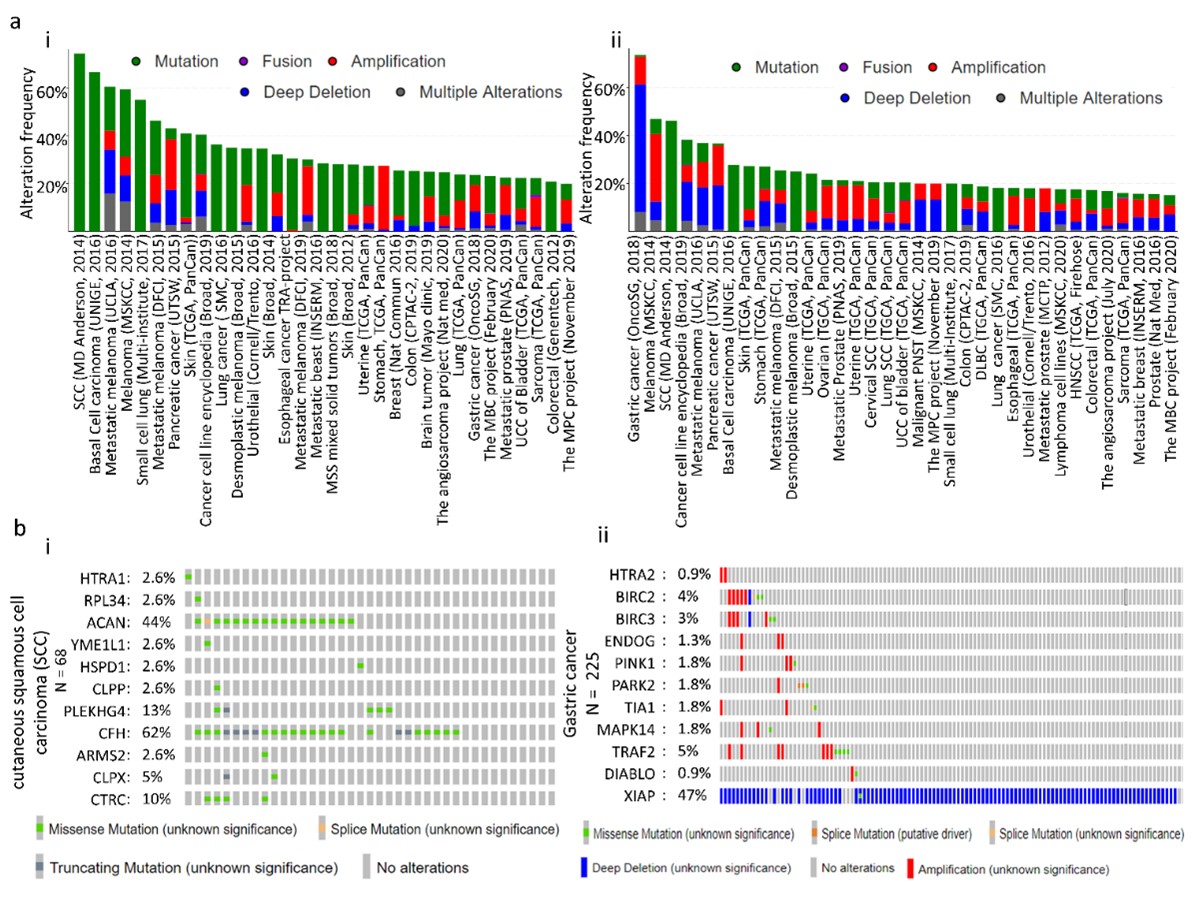
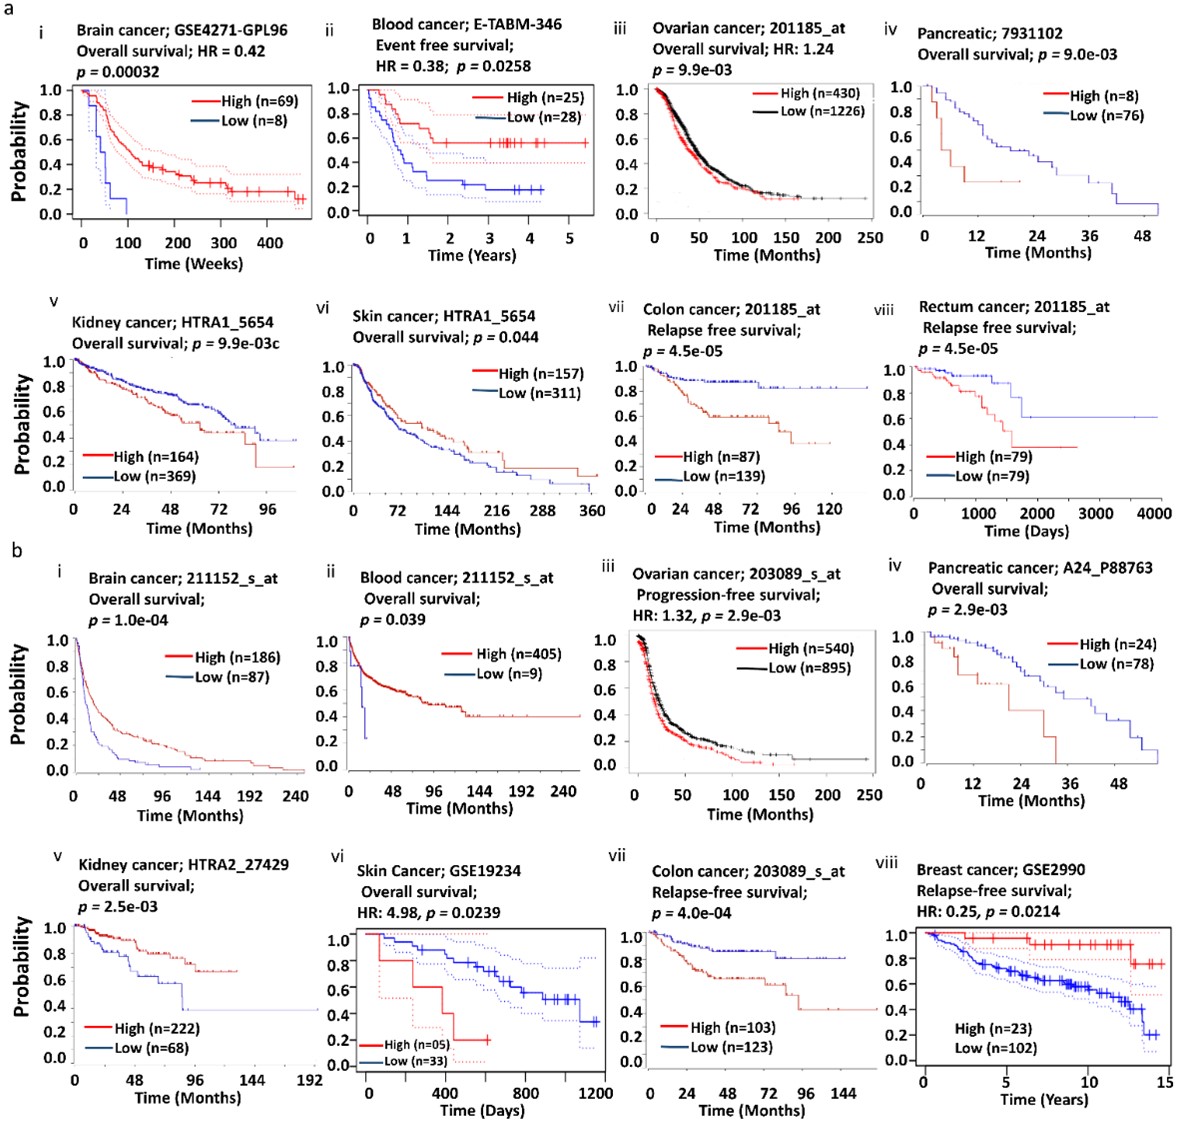
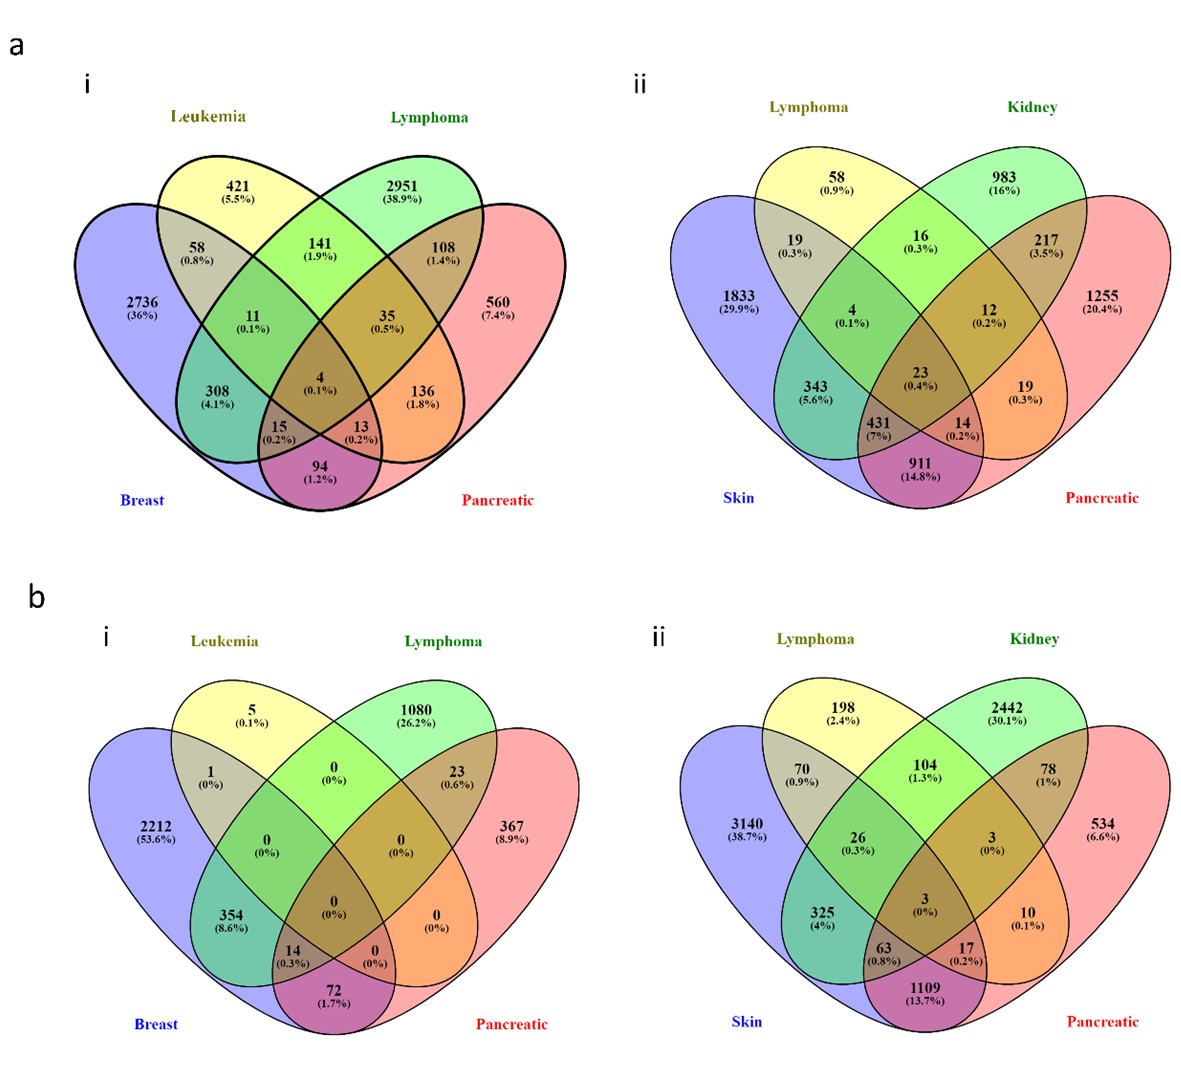
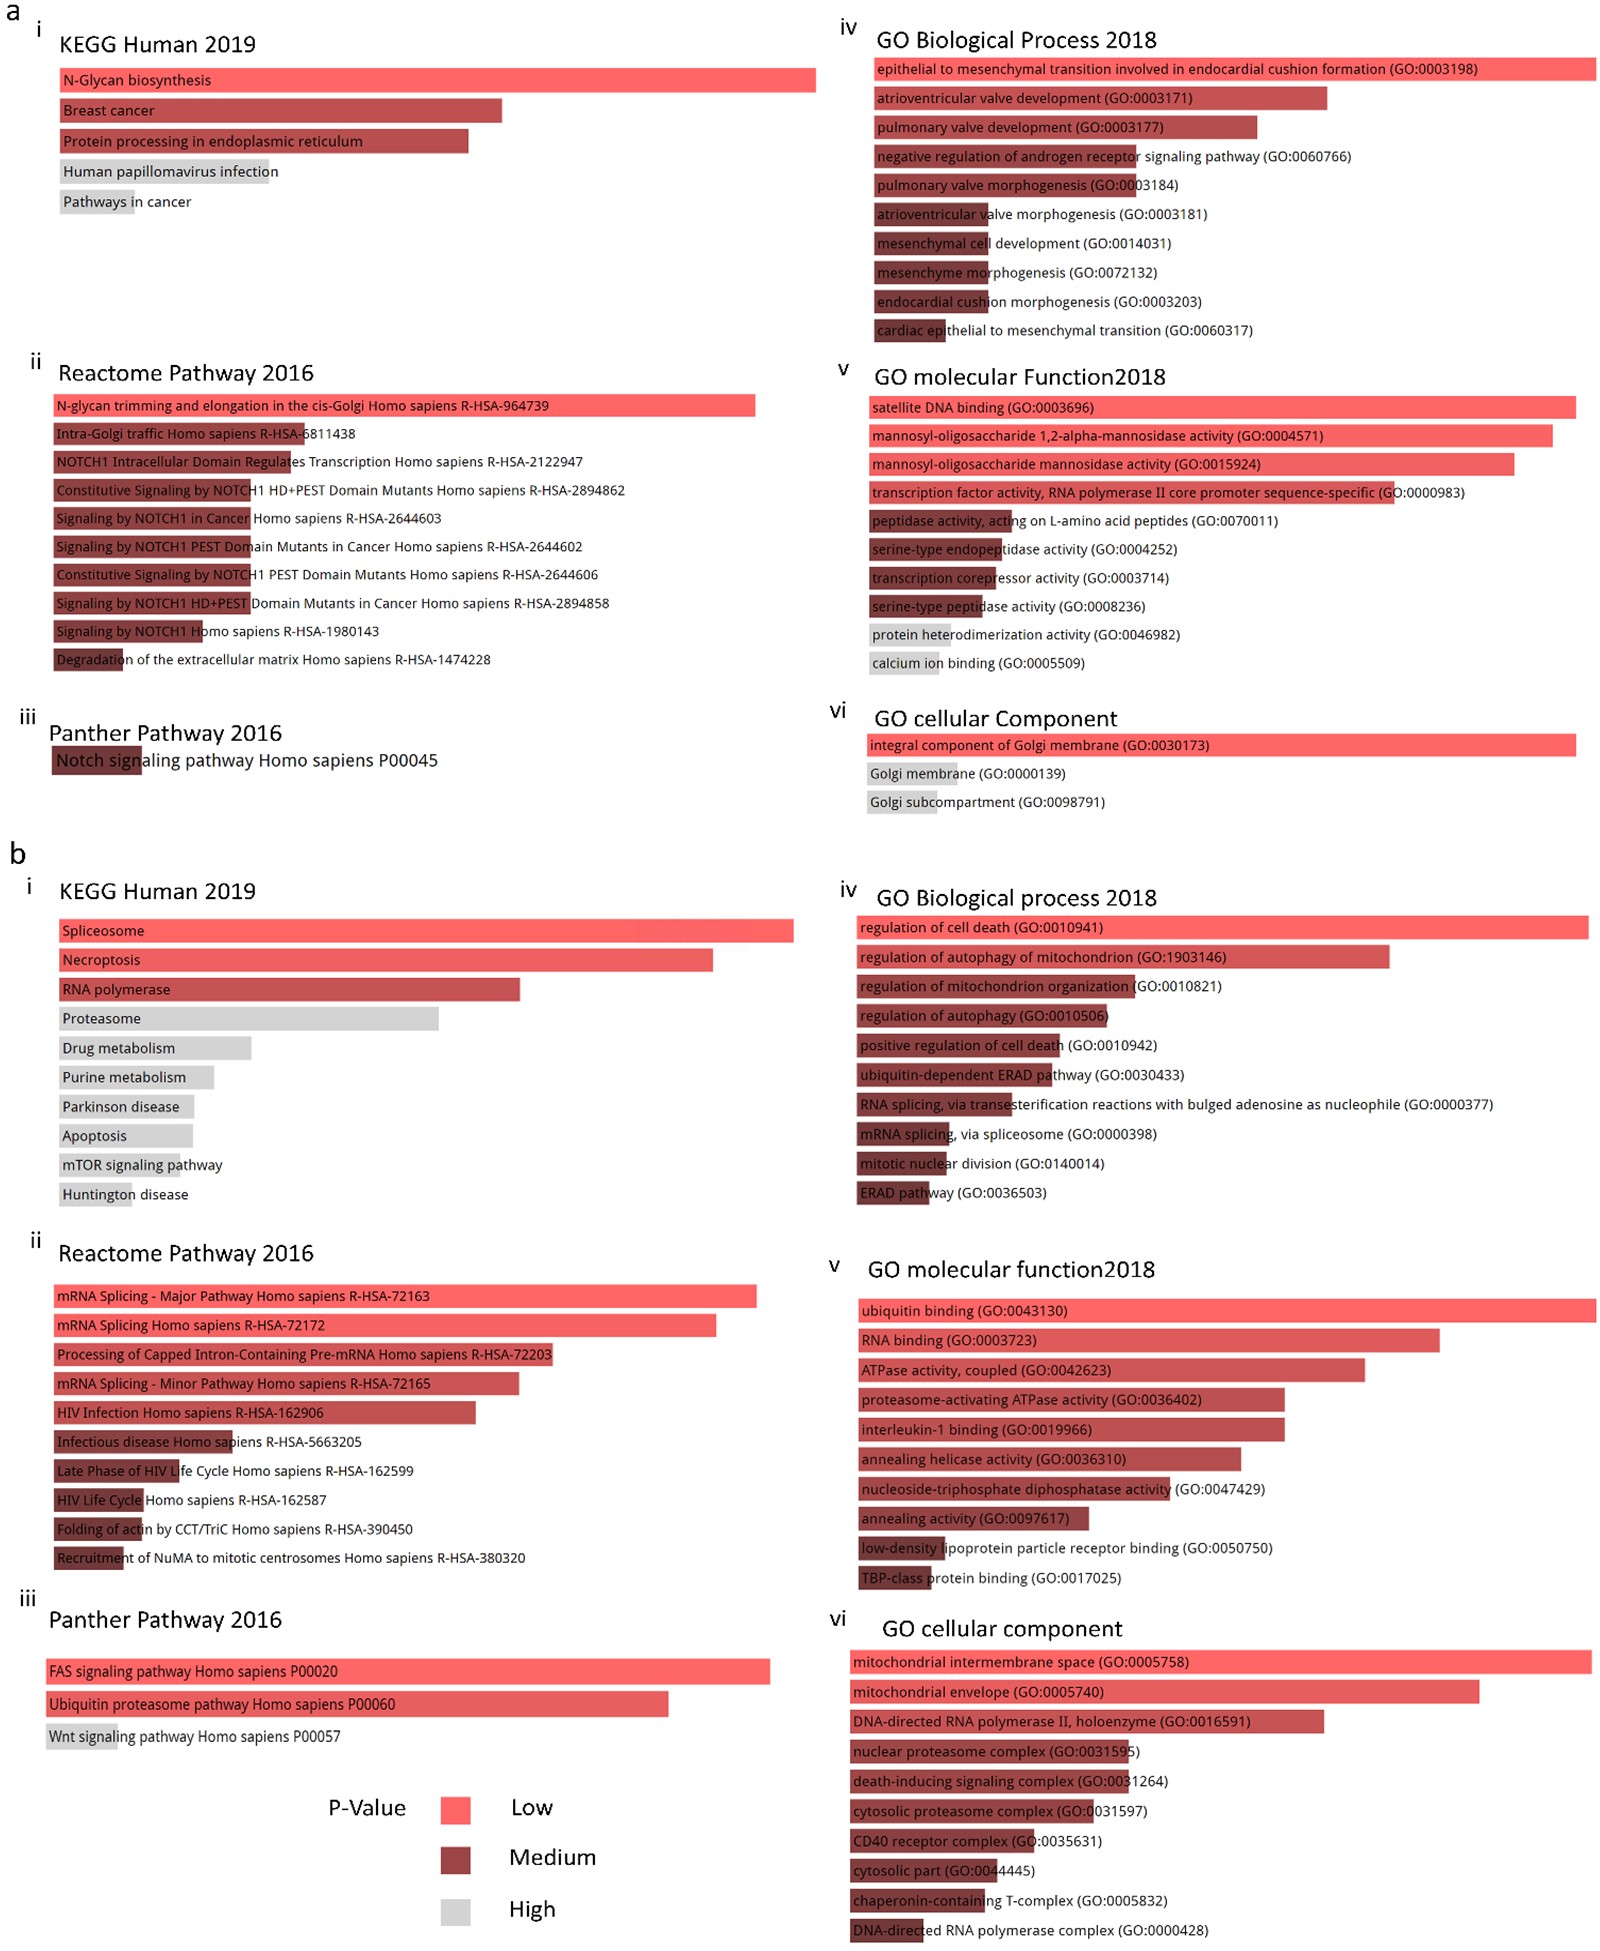
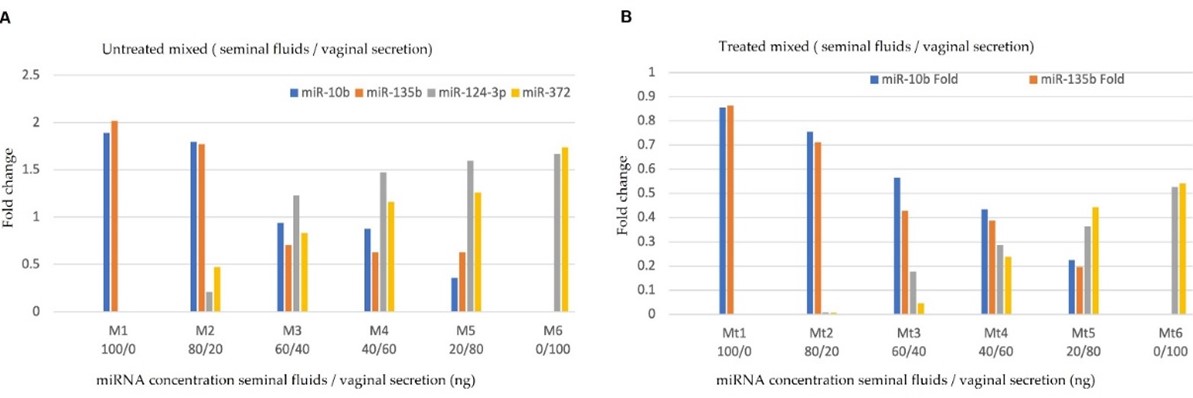
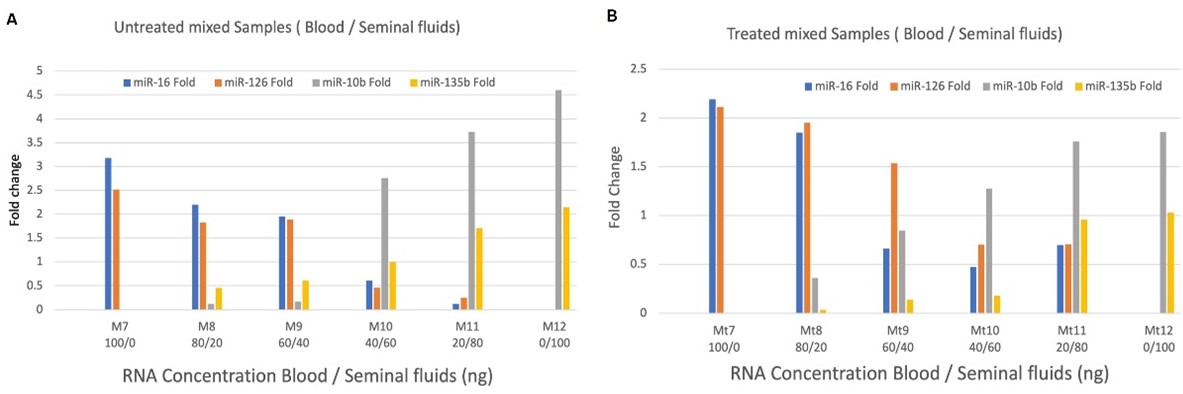
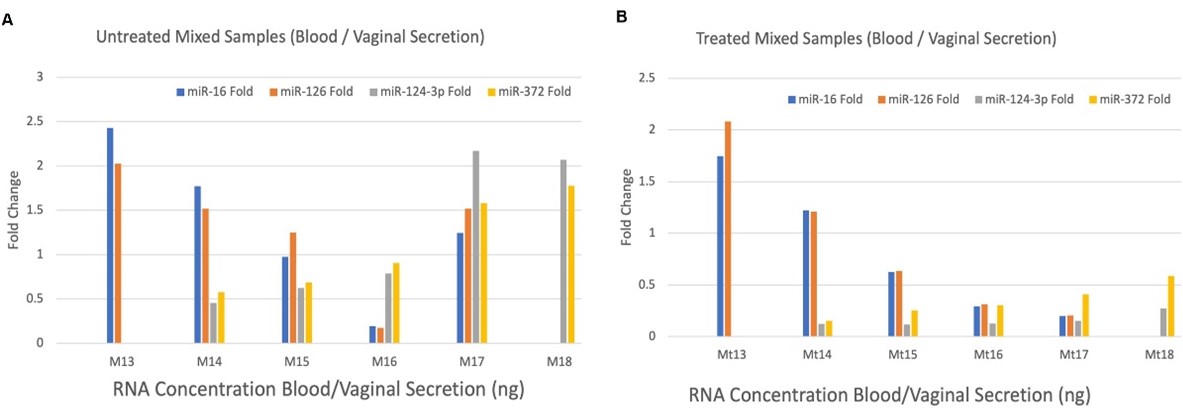
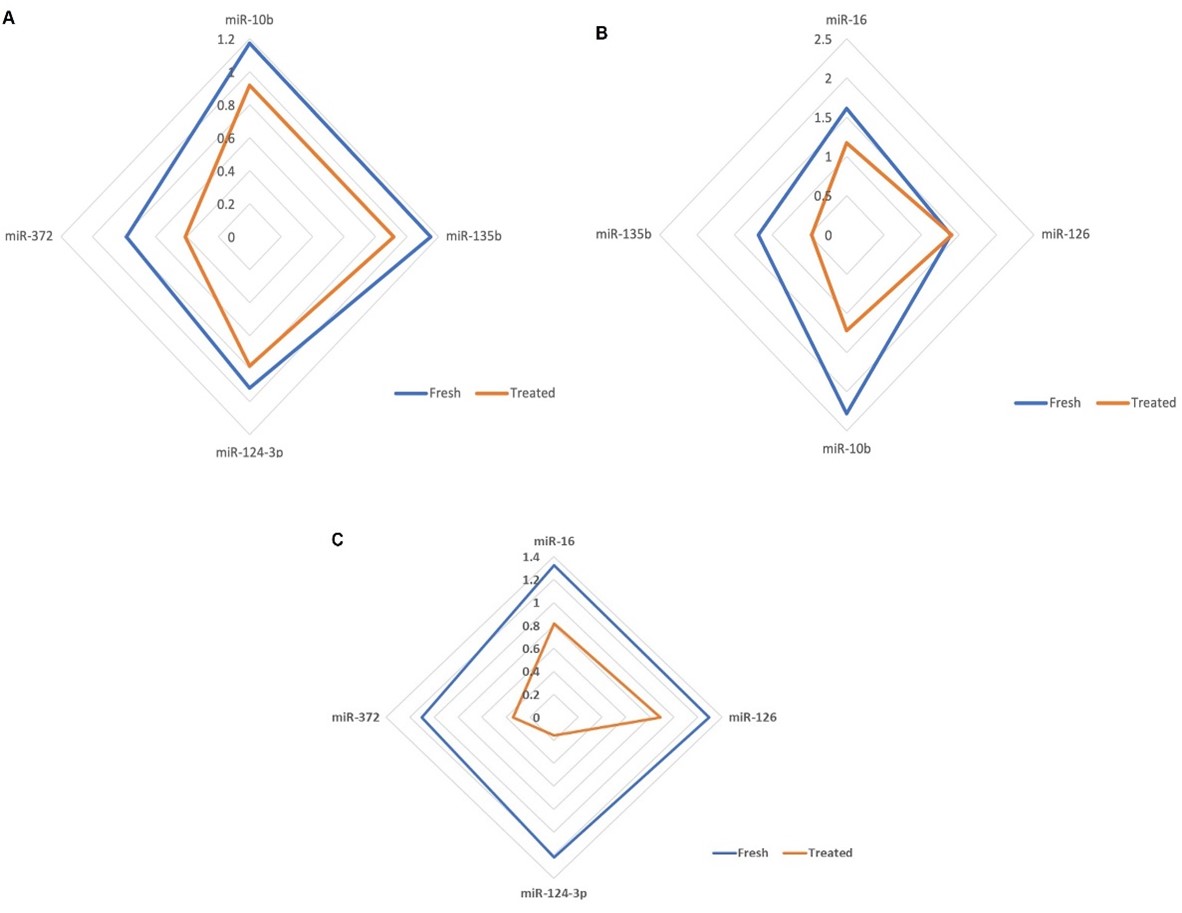
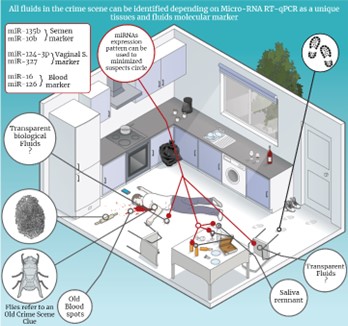
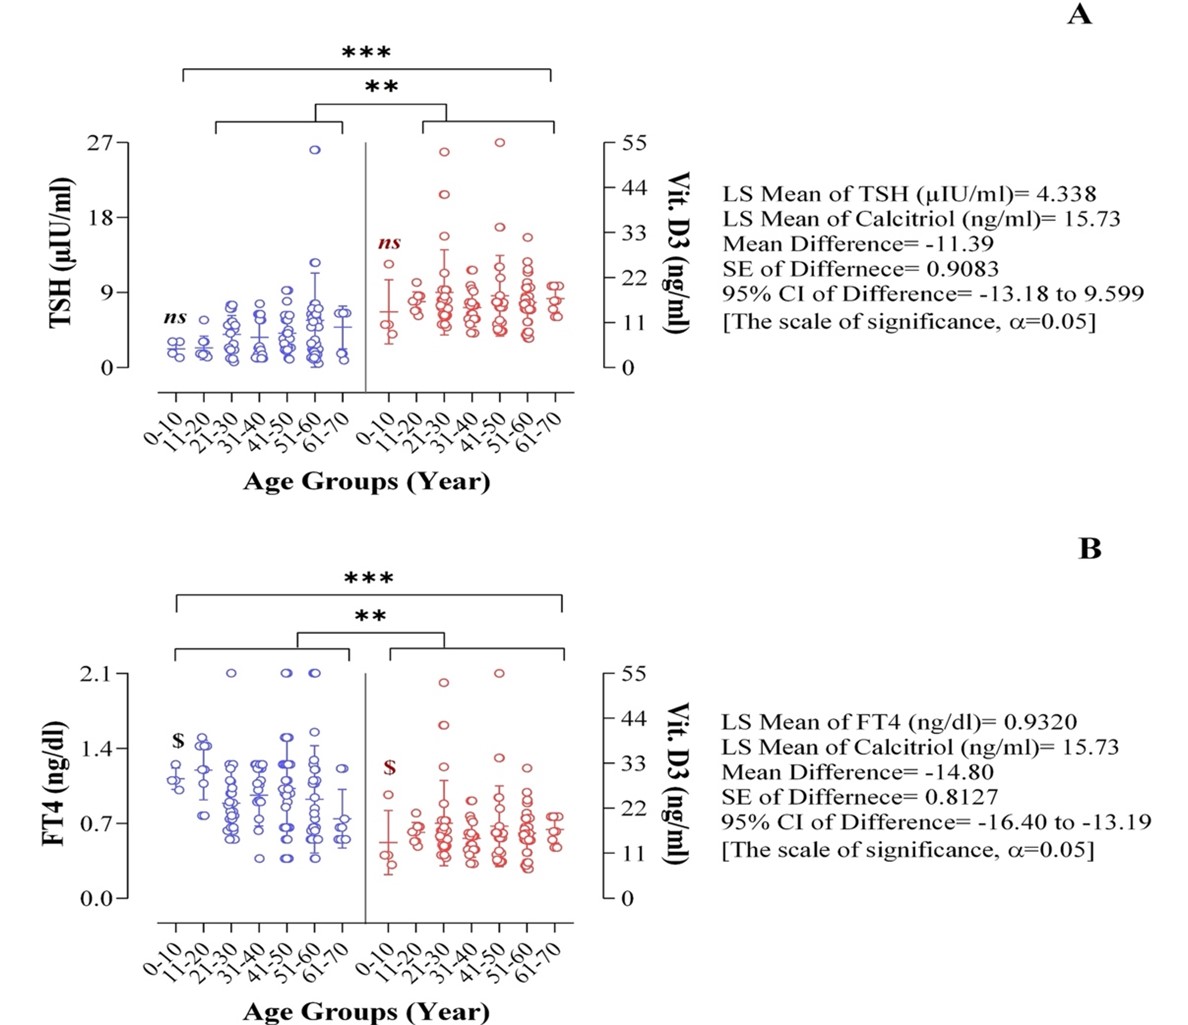
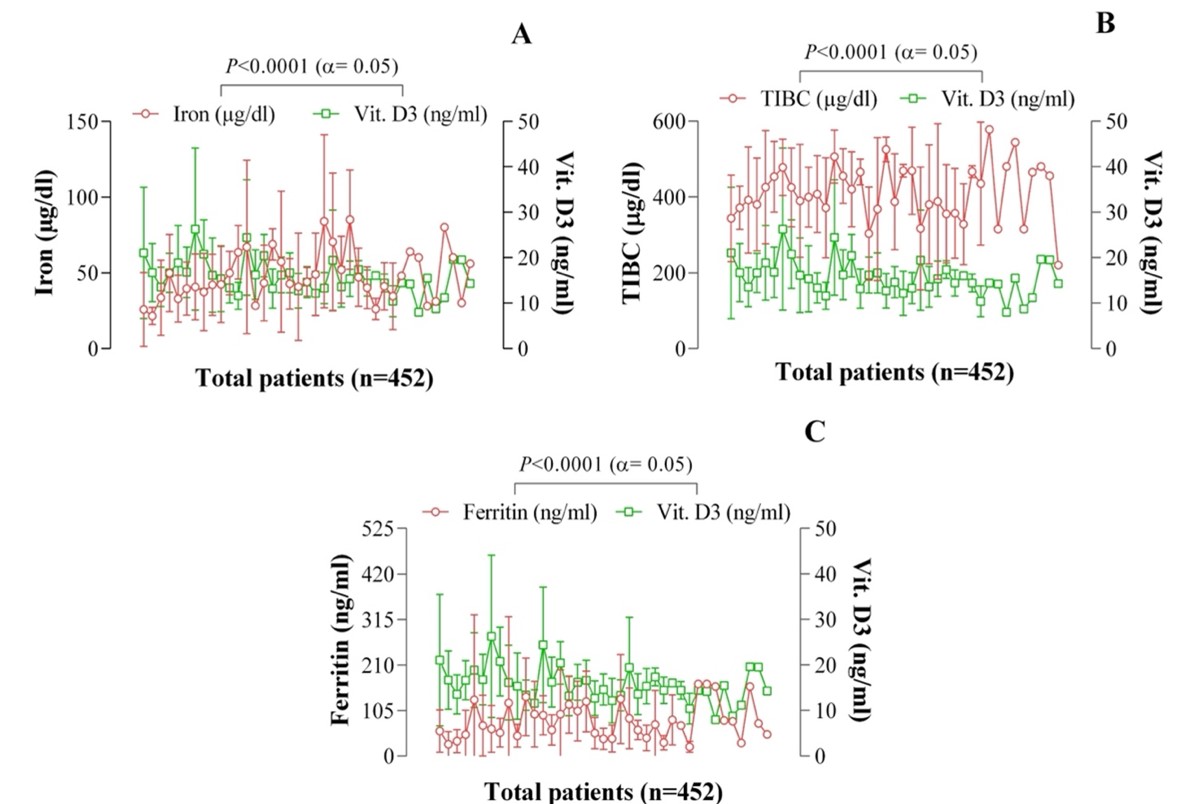
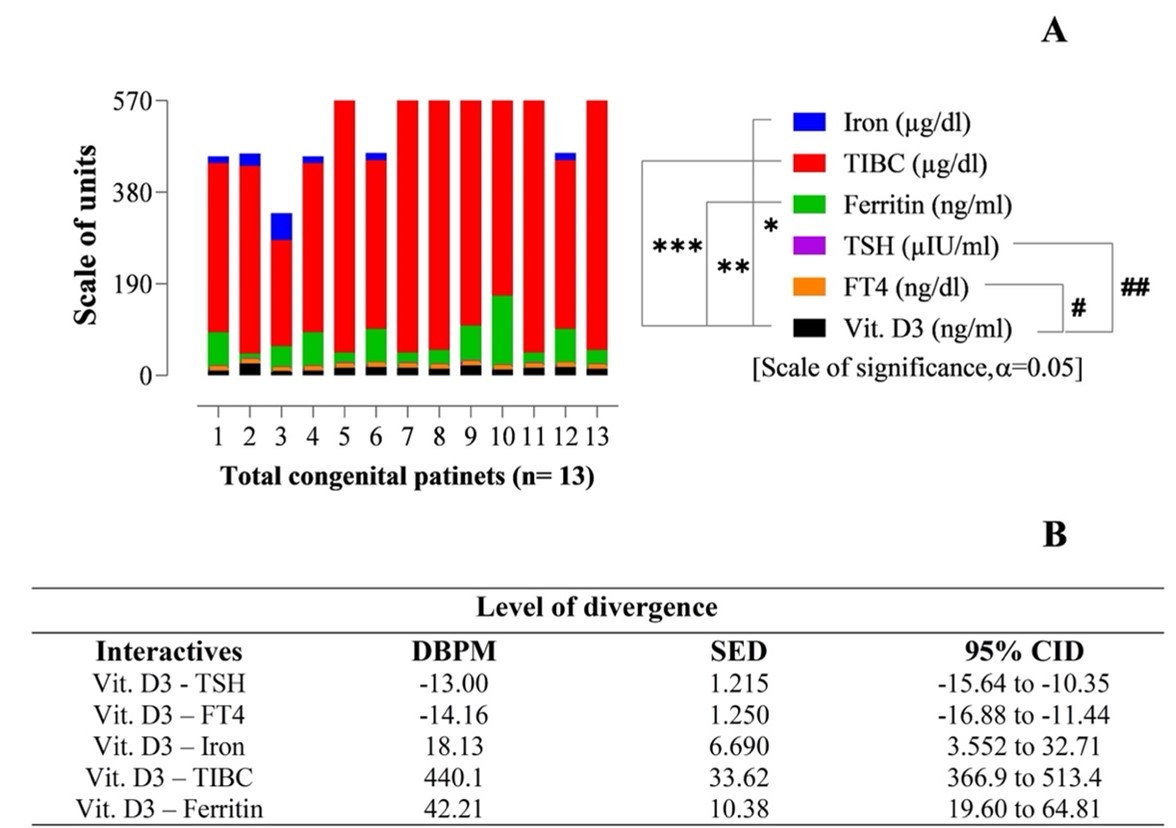
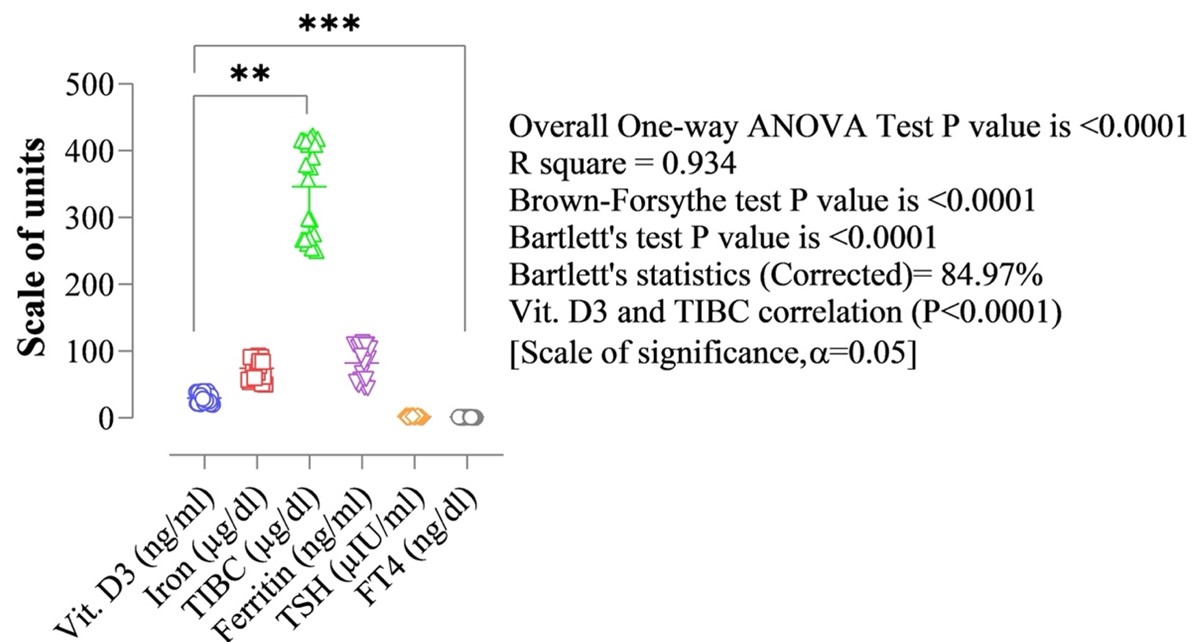
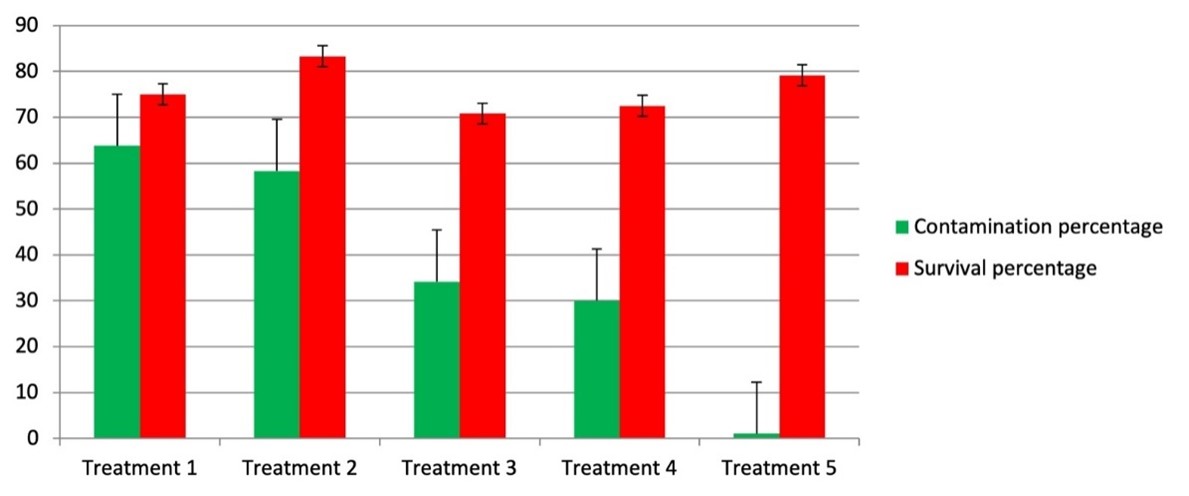
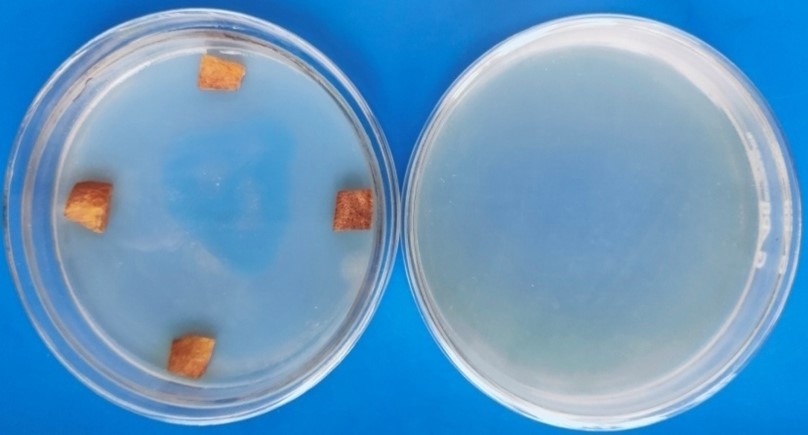
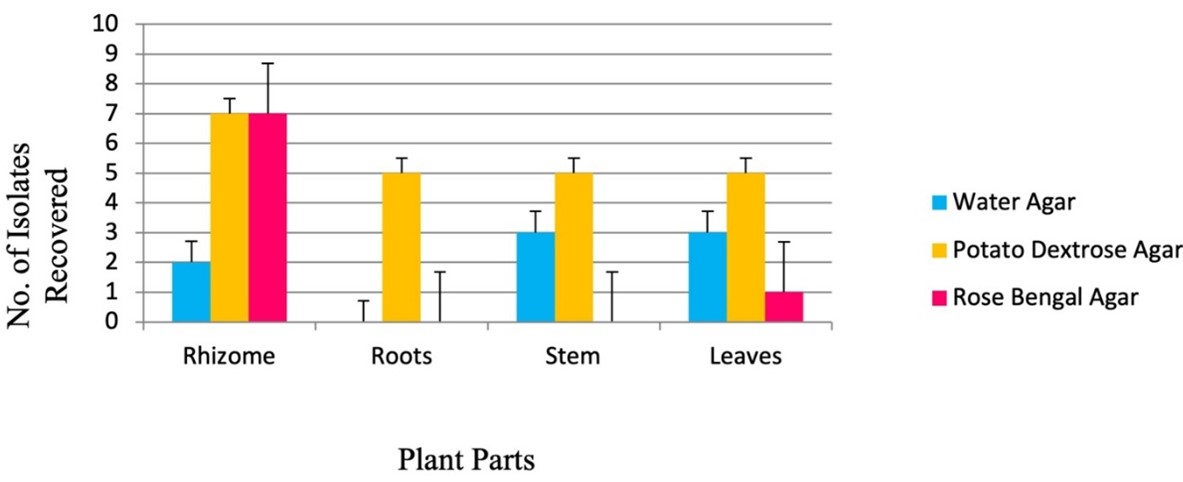
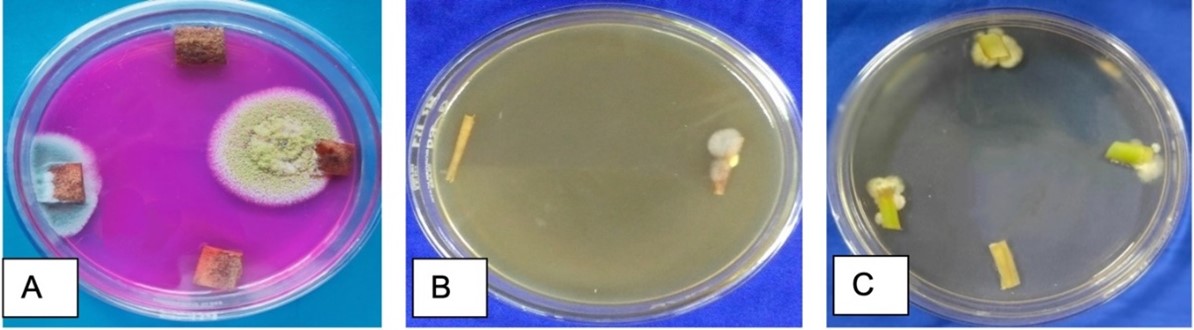
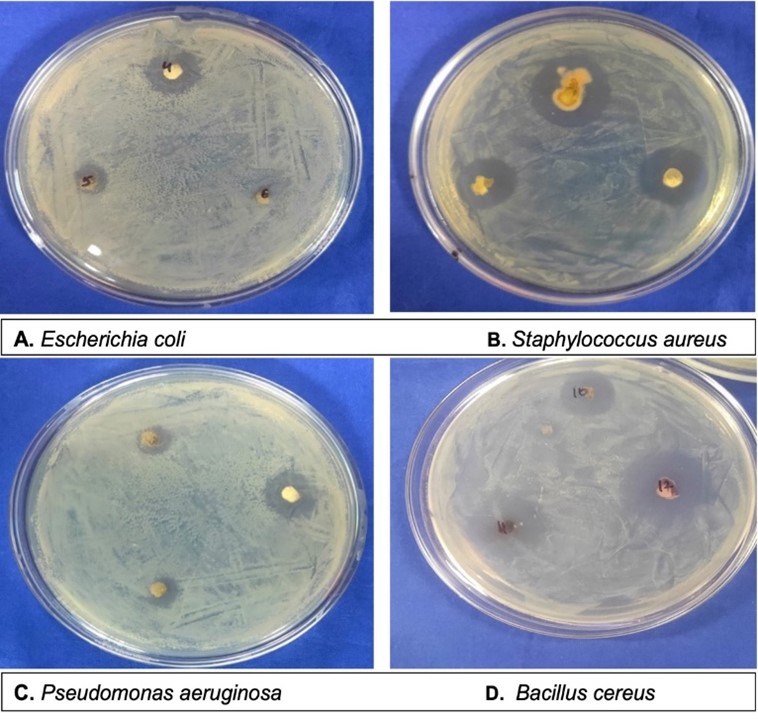
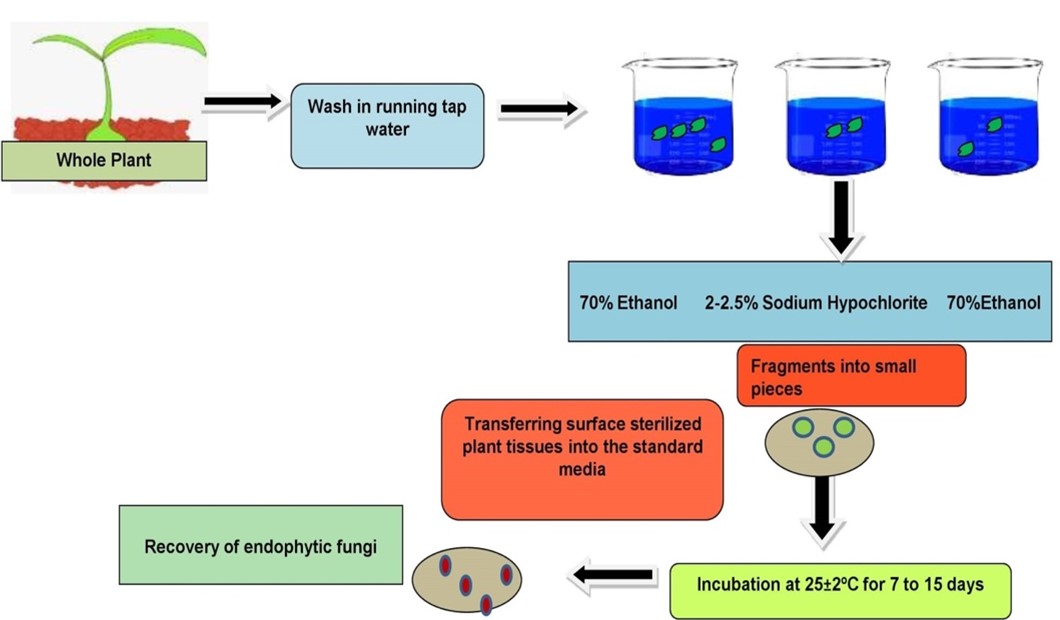
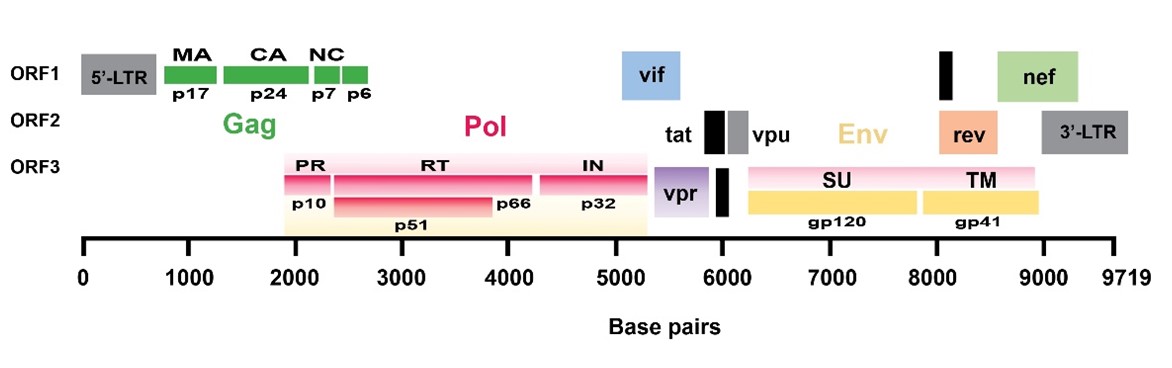
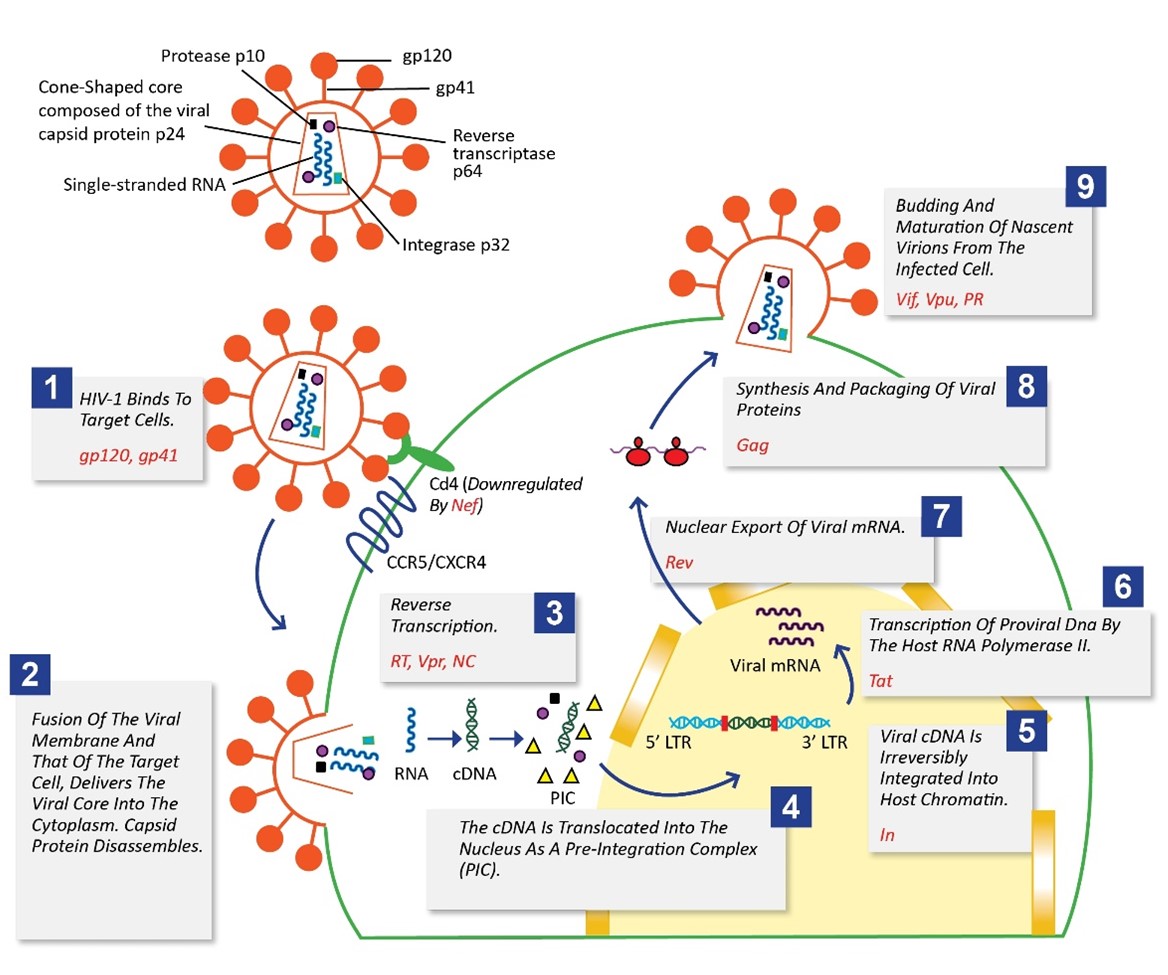
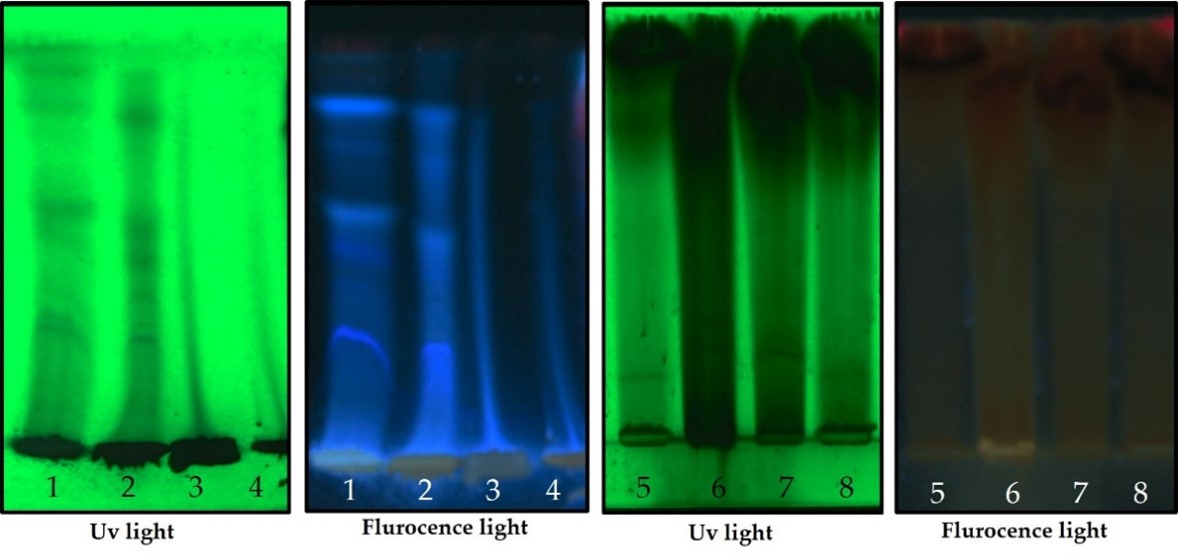
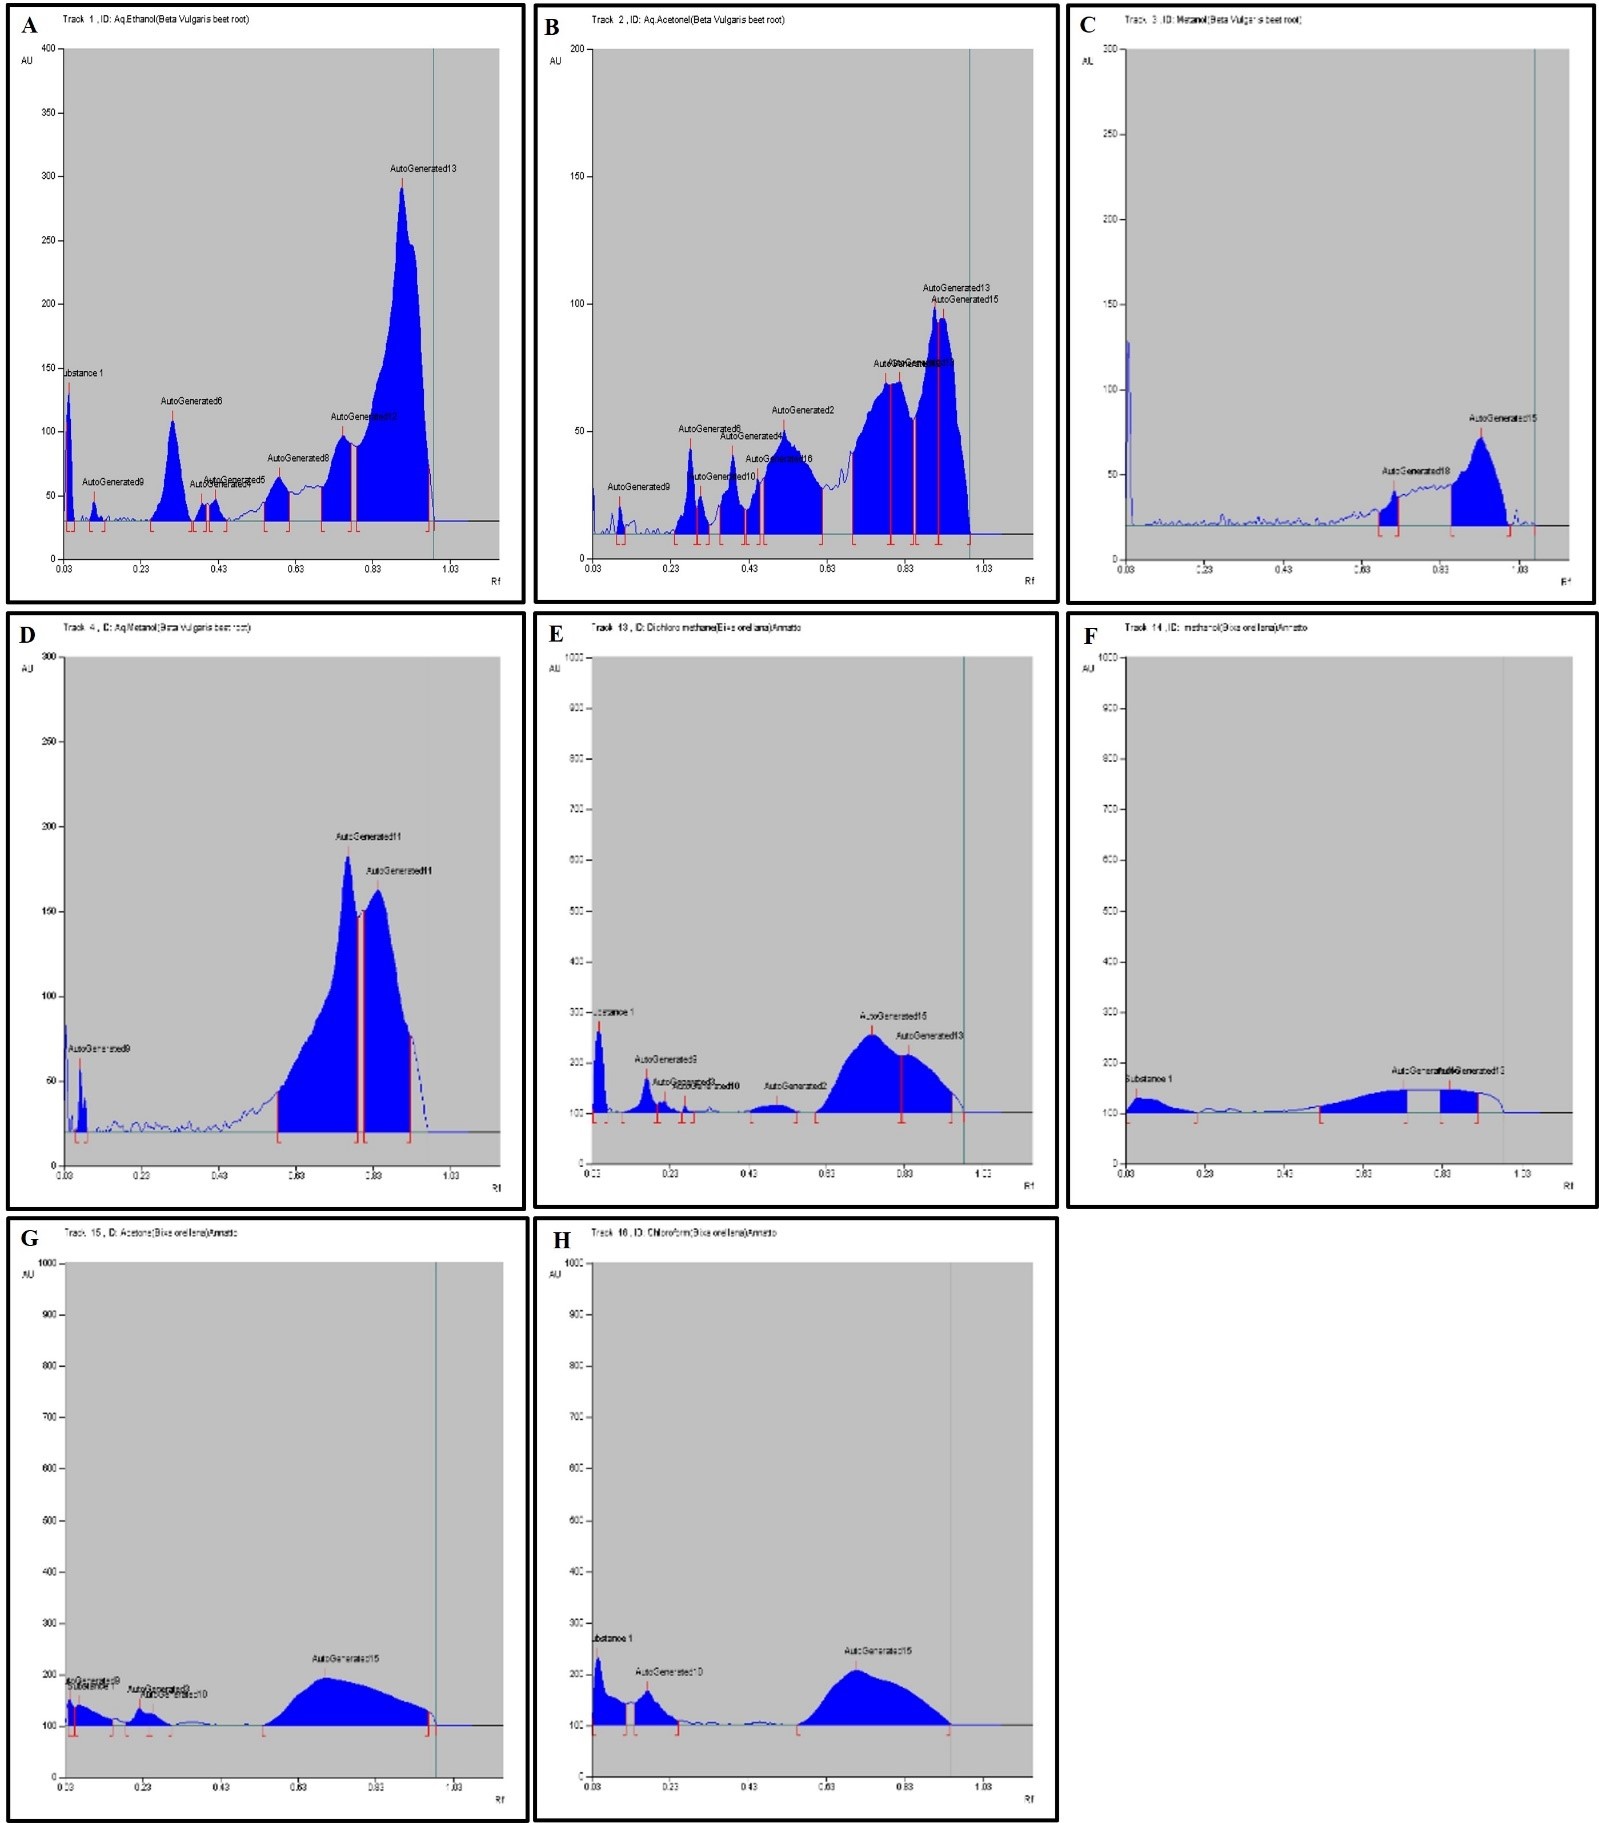
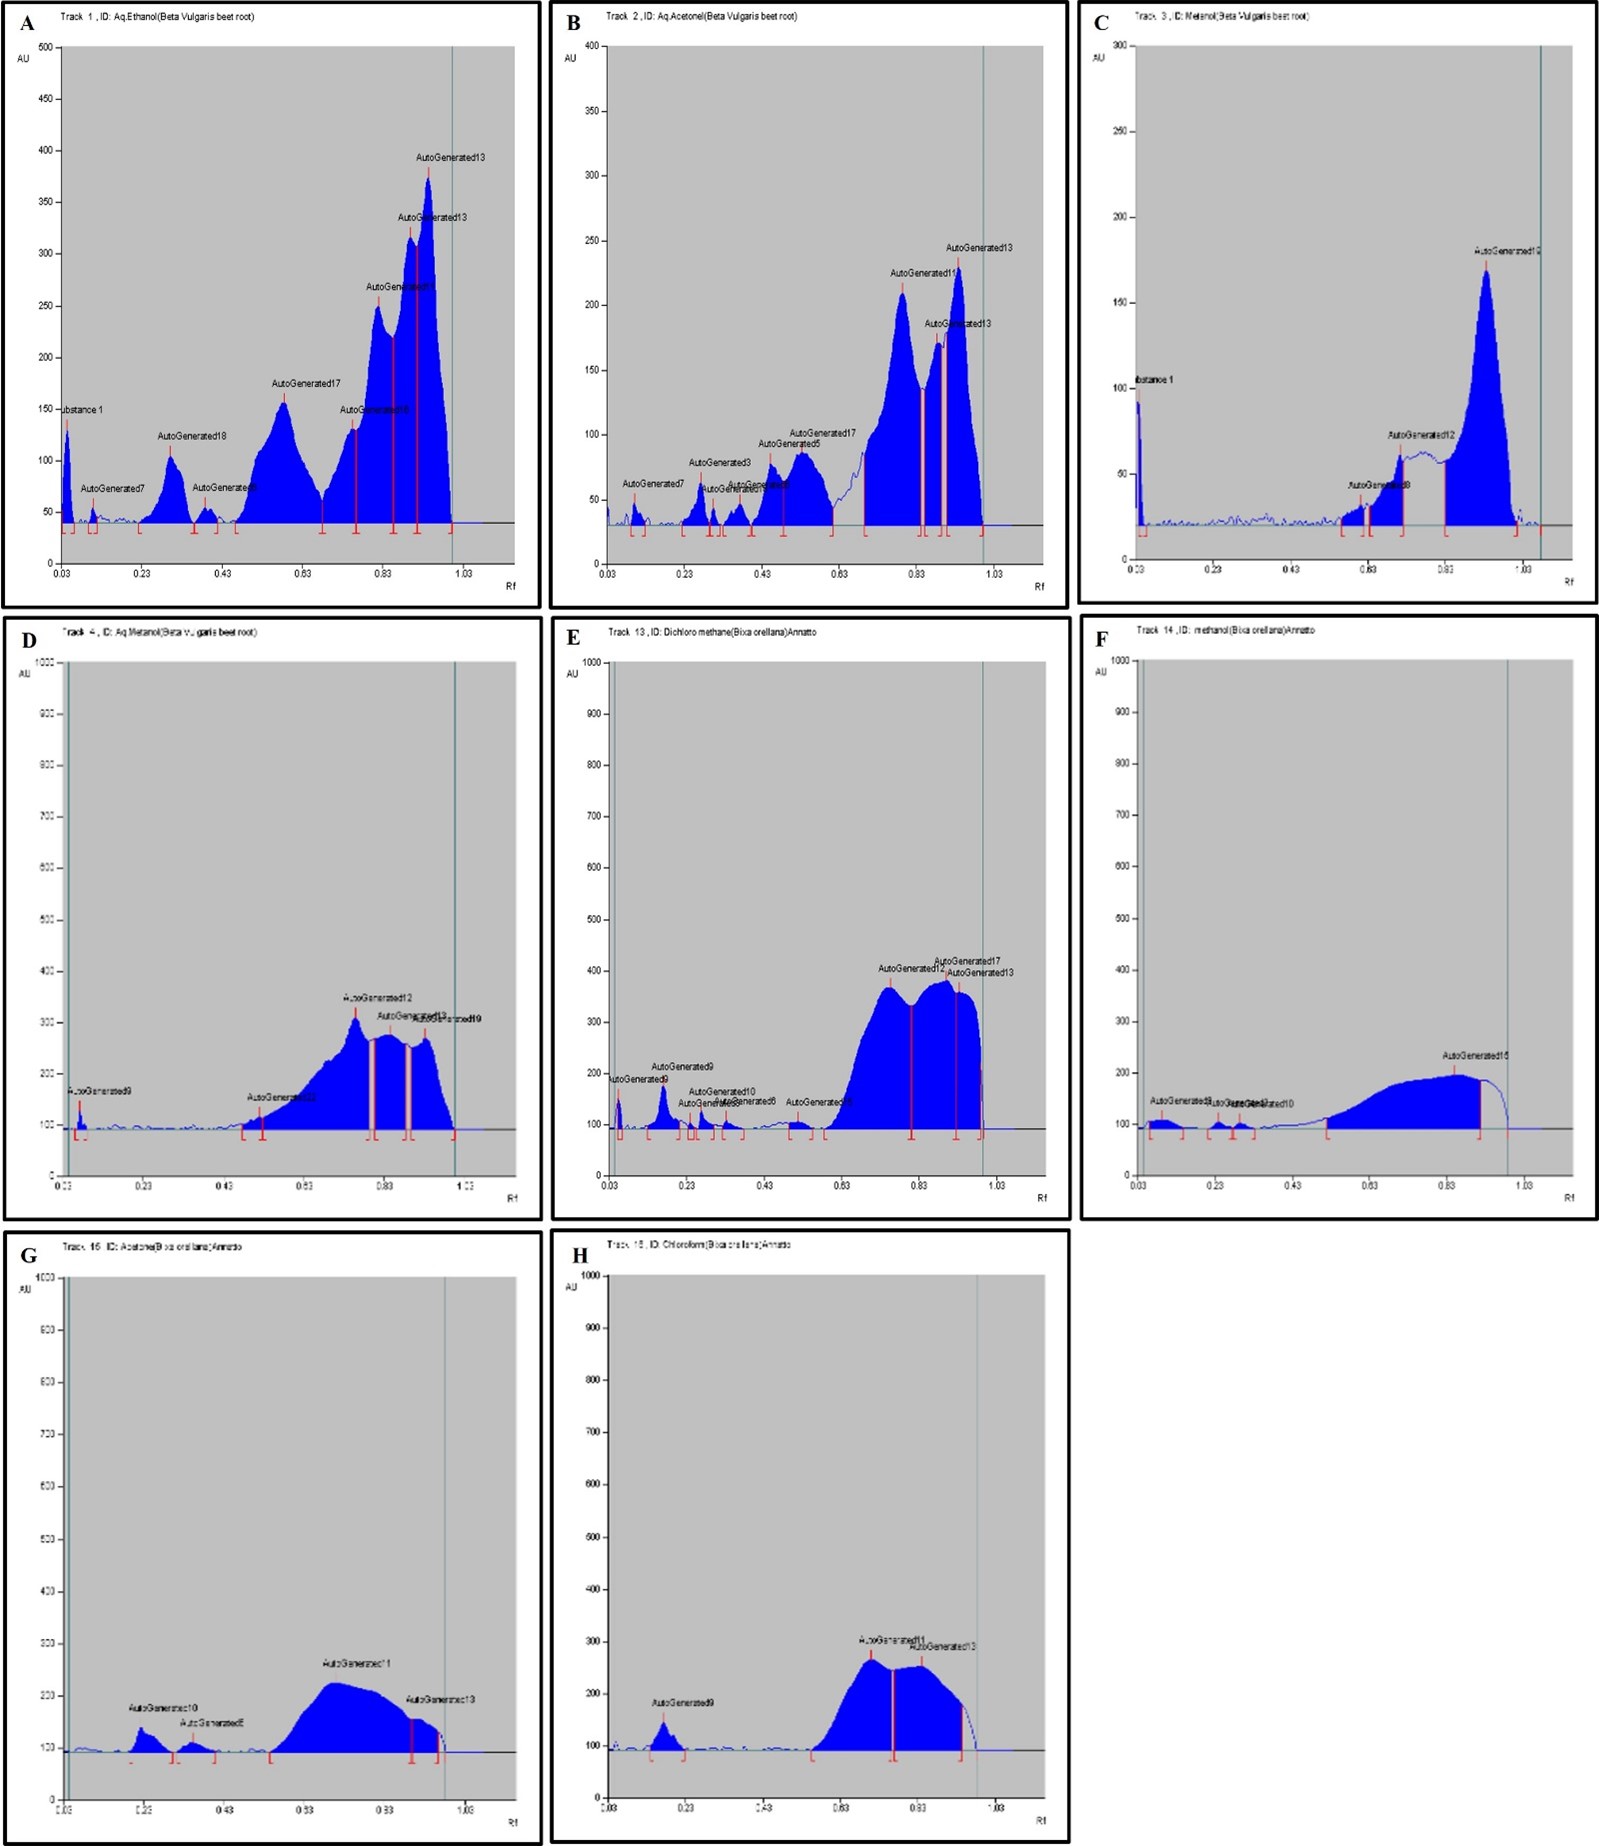
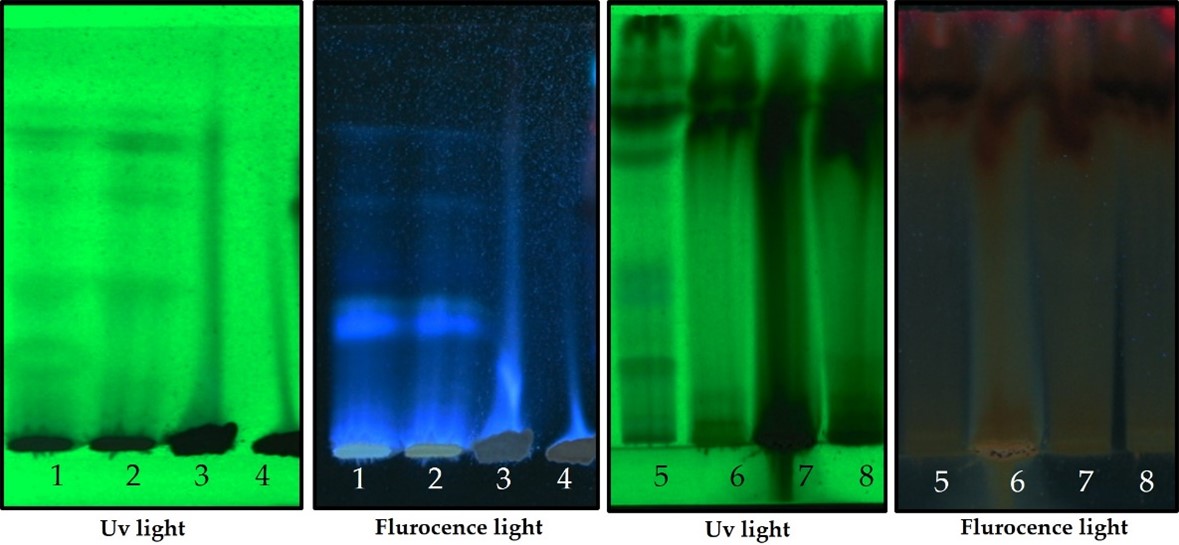
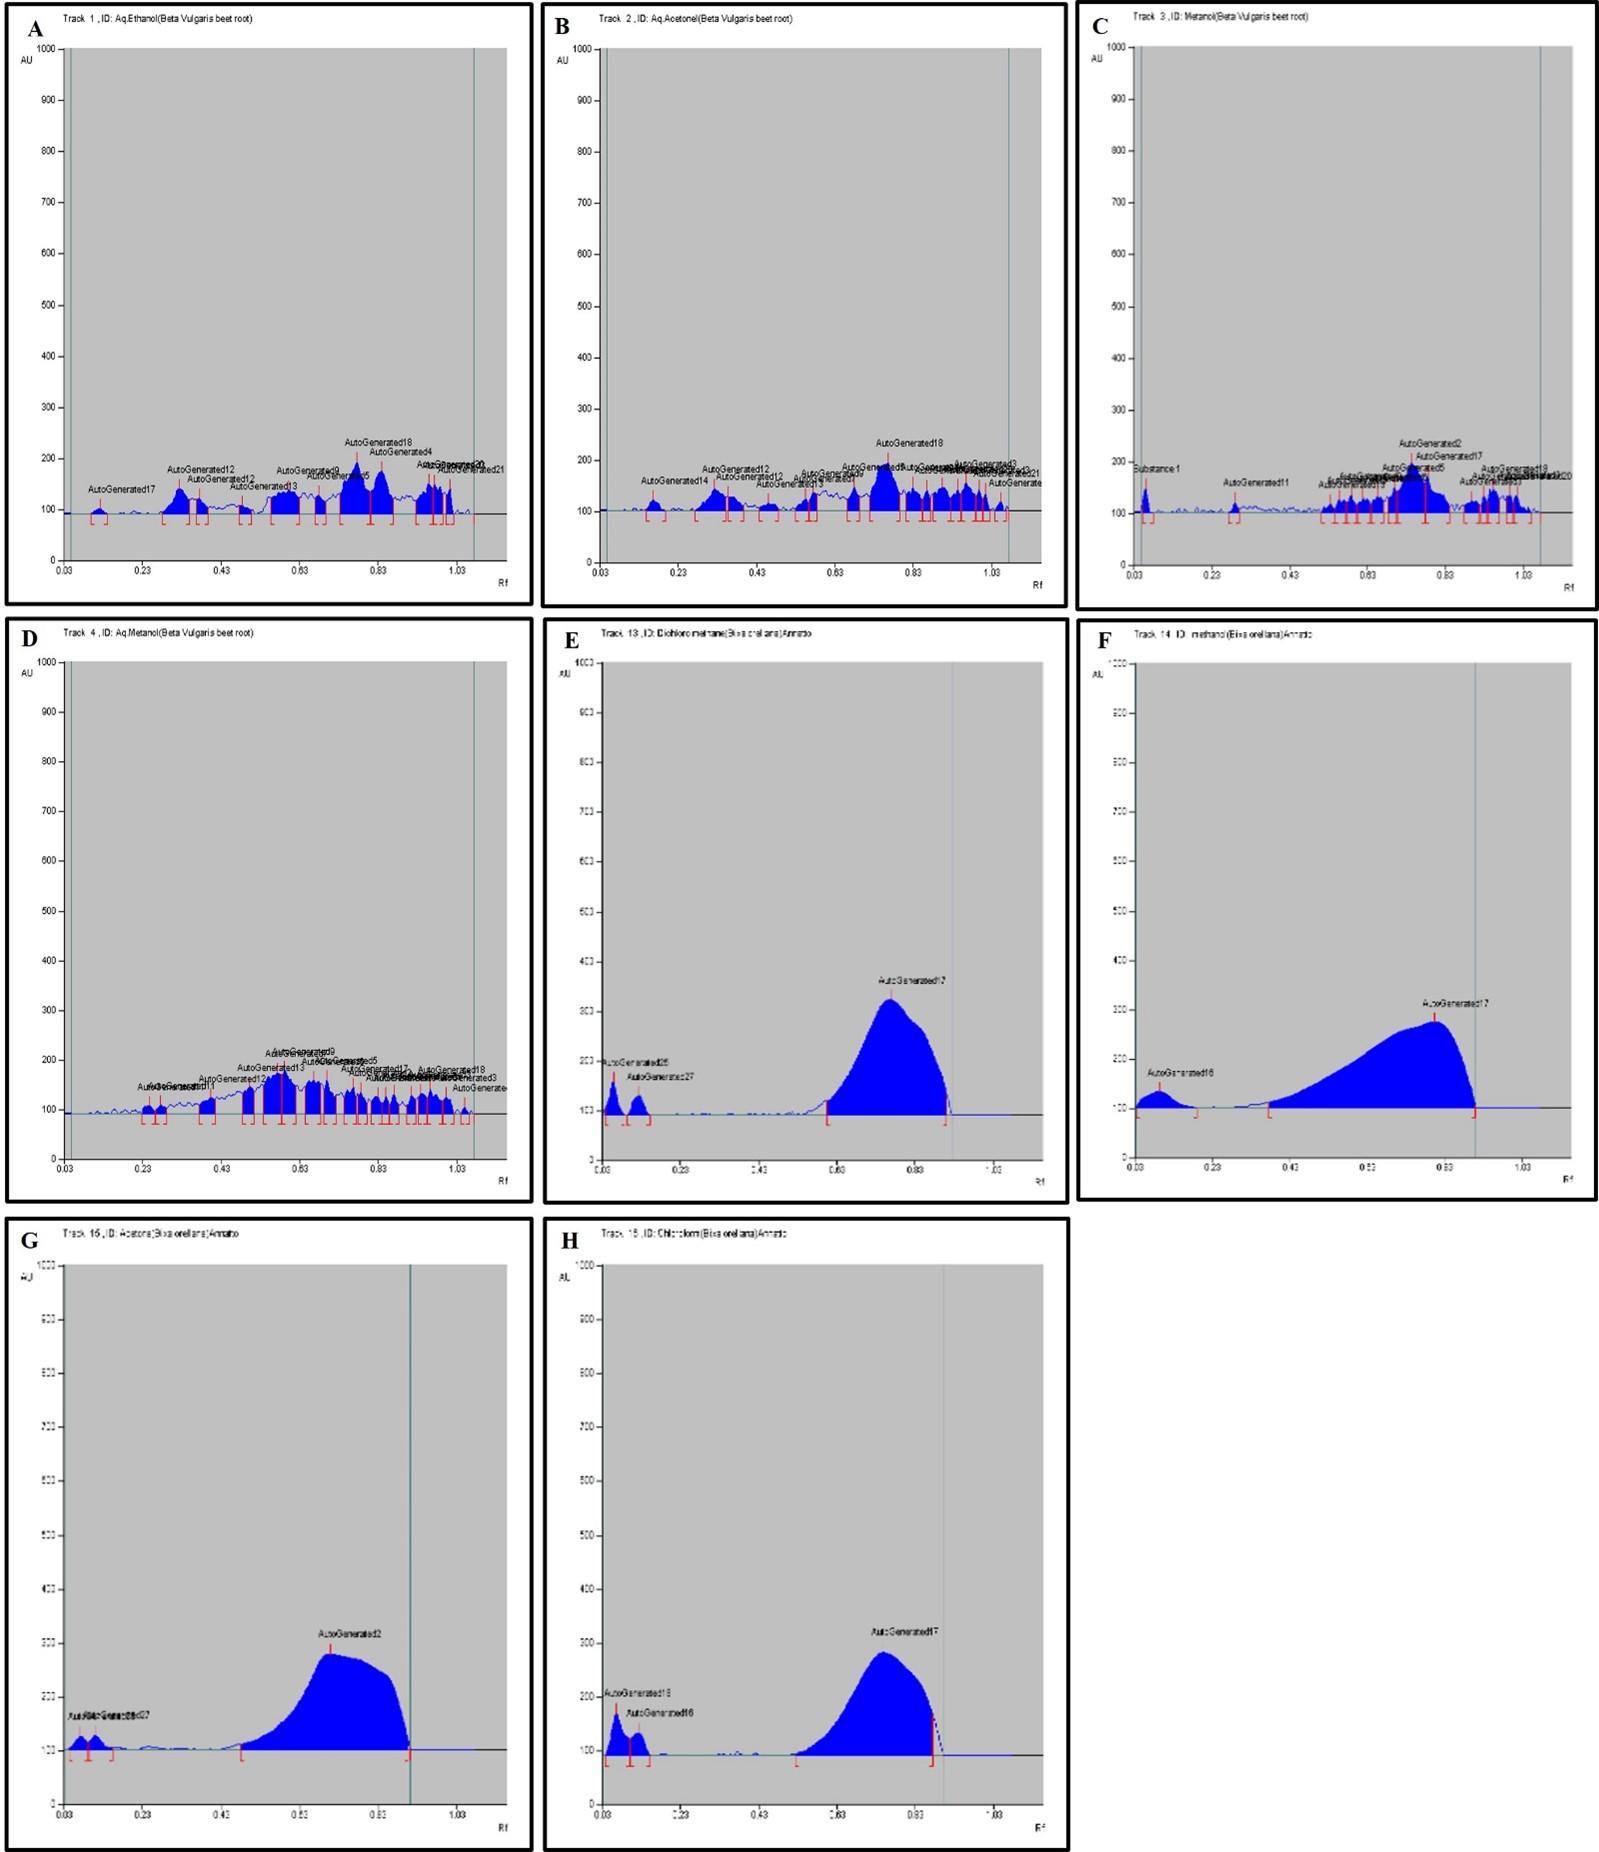
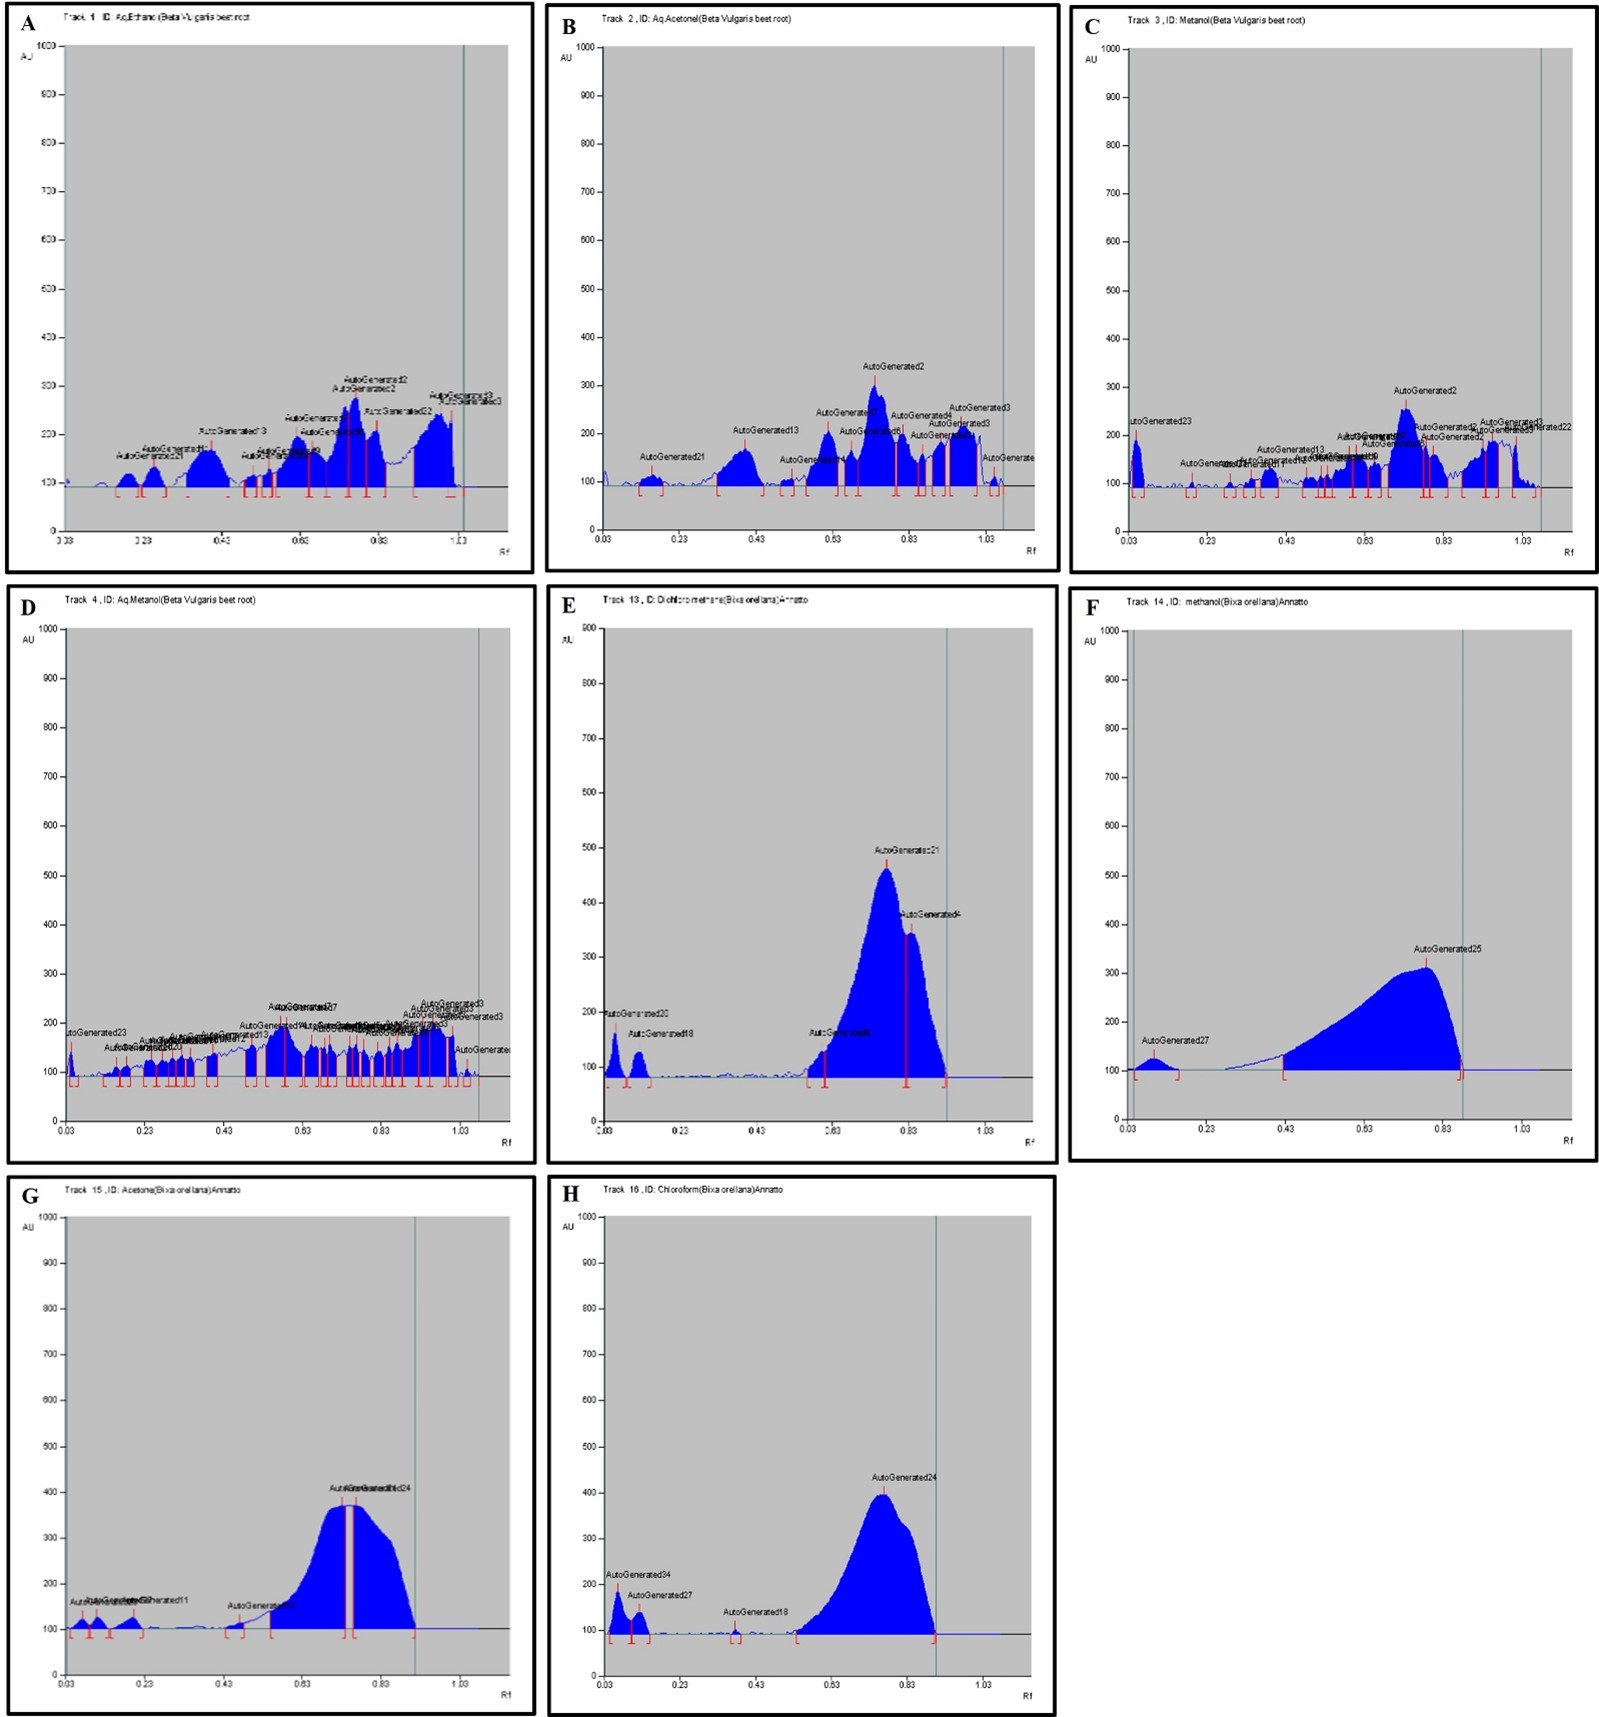